Spectral Power of Background EEG, Complex Visual-Motor Response, Galvanic Skin Response and Electrocardiogram Parameters in Adolescents With Autism Spectrum Disorders and Mental Retardation

Author: Elena Vorobyeva, Elena Rahimova
Journal: International Journal of Cognitive Research in Science, Engineering and Education @ijcrsee
Section: Original research
Article in issue: 2 vol.13, 2025.
Free access
The paper presents the results of a study of the parameters of the galvanic skin response, electrocardiogram, complex visual-motor response parameters and spectral power of the background EEG on a sample of 34 schoolchildren aged 12 to 17 years with autism spectrum disorders and mental retardation. Electroencephalogram and polygraphic channels (electromyogram, galvanic skin response, electrocardiogram) were recorded. Intelligence was diagnosed using the WISC test by D. Wechsler. The functional state was assessed by complex visual-motor response parameters using the Psychophysiologist device. The study found that a higher spectral power of the background EEG in the alpha range in the parietal region corresponds to a higher level of general intelligence in adolescents with autism spectrum disorders and mental retardation. Evaluation of the complex visual-motor reaction showed that a higher spectral power of the background EEG in the beta-1 range of the right and central occipital region corresponds to the average class of sensorimotor reactions. A higher spectral power of the background EEG in the beta-2 range of the right frontal region is noted in adolescents with a higher class of sensorimotor reactions. The obtained results are used in the development of individual correctional programs for adolescents with autism spectrum disorders and mental retardation.
Spectral power of background EEG, complex visual-motor reaction, adolescents with autism spectrum disorders and mental retardation
Short address: https://sciup.org/170210285
IDR: 170210285 | UDC: 616.896-07-053.6, 616.899-07-053.6 | DOI: 10.23947/2334-8496-2025-13-2-403-411
Text of the scientific article Spectral Power of Background EEG, Complex Visual-Motor Response, Galvanic Skin Response and Electrocardiogram Parameters in Adolescents With Autism Spectrum Disorders and Mental Retardation
There is an increase in the number of children and adolescents with autism spectrum disorders (ASD) and mental retardation worldwide. With the change in society as well as the receipt of new data on the specifics of the course of these types of disorders, it is becoming increasingly clear that the integration of individuals with these characteristics is possible based on knowledge of the psychophysiological basis of the development of children and adolescents ( Vorobyeva and Kaidanovskaya, 2018 ). Children with ASD often have brain macrocephaly, with an increase in volume and density recorded in both white and gray matter, especially in the frontal and temporal lobes ( Zhao et al., 2022 ) and studies of adults show data on both increased and decreased brain volume ( Arutiunian et al., 2023 ). Structural and functional abnormalities have been found in the basal ganglia, striatum, hippocampus, and hypothalamus ( Zhao et al., 2022 ). Brain tissue studies show active neuroinflammatory processes in the cortex and white matter ( Pardo et al., 2007 ), changes in sulcal depth in areas of the brain that are associated with language ( Arutiunian et al., 2023 ), reduced dendritic branching, increased density of smaller neurons in the hippocampus and amygdala nuclei, decreased number of Purkinje cells, and underdevelopment of inhibitory neurons ( Pardo et al., 2007 ). Individuals with ASD have elevated levels of serotonin, glutamate, aspartate, phenylalanine, histidine, tyrosine, and taurine, and decreased levels of oxytocin, endorphins, glutamine, and asparagine in the blood ( Brister et al., 2022 ; Zhao, Zhang et al., 2022 ).

© 2025 by the authors. This article is an open access article distributed under the terms and conditions of the Creative Commons Attribution (CC BY) license .
with diffuse waves of theta and delta ranges, and reduced amplitude indicators of evoked potentials, an asymmetric distribution in the occipital regions and a general decrease in alpha rhythm activity, a higher spectral power of the gamma rhythm ( Zhukova, 2016 ; Misyuk, 2012 ). Researchers also note the presence of hyperexcitable areas of the brain, differences in areas of activity from the norm, changes in coherence and disruption of information exchange processes between different areas of the brain ( Boutros et al., 2015 ; Gamirova et al., 2023 ). Studies also report redundancy of local connections of the cerebral cortex areas and insufficiency of functional interaction of relatively remote regions (frontal and parietal areas of the neocortex) ( Pavlenko et al., 2023 ). The features of the disorders vary depending on the type of ASD and its manifestations. One of the EEG features of people with ASD is the suppression of the mu rhythm (a subtype of the alpha rhythm recorded during sensorimotor activation). A change in the manifestation of the mu rhythm can signal a malfunction of mirror neurons ( Misyuk et al., 2012 ; Pavlenko et al., 2023 ). The frequency of epileptic seizures reaches 30% in people with ASD ( Misyuk et al., 2012 ), with various forms of epileptiform activity noted ( Boutros et al., 2015 ; Belousova et al., 2018 ).
The peripheral nervous system shows reduced phasic and tonic components of the electrodermal activity in individuals with ASD, as well as no change in amplitude when emotional stimuli are presented compared to normotypic individuals, indicating autonomic dysregulation ( Farmer et al., 2017 ; Gul et al., 2020 ). Signs of increased intracranial pressure are noted ( Avtenyuk, 2016 ). A reduced level of muscle activation is noted ( Borji et al., 2014 ). Heart rate variability in individuals with ASD is characterized by increased background heart rate with decreased background peripheral nervous system activity and reactivity to psychosocial stimuli ( Belova et al., 2017 ).
A lot of attention is paid to differential diagnostics in the work with children with mental retardation, in particular, an audiological examination is carried out in order to differentiate children with mental retardation from the children with hearing impairment ( Karantysh et al., 2022 ). Characteristic features of the EEG of children with mental retardation are a decrease in the frequency of the alpha rhythm and its unevenness, suppression of the theta rhythm and gamma rhythm, high-amplitude delta rhythm (especially in the left frontal-temporal region) ( Lobasyuk et al., 2021 ). Non-standard sources of rhythms in the brain are also noted ( Lobasyuk et al., 2023 ). Active epileptic and paroxysmal disorders are observed ( Ünal et al., 2009 ). Up to 20% of children with mental retardation have a right lateral profile ( Lobasyuk et al., 2021 ).
The theoretical and methodological basis of this work were formed by the ideas that have been developed in Russian and international clinical psychology about the specifics of the development of adolescents with ASD and mental retardation ( Appe, 2019 ; Volkmar et al., 2014 ; Grigorenko, 2018 ; Dovbnya S. et al., 2022 ; Isaev, 2007 ); standards for psychological assessment of intelligence ( Clinical, 2021 ; Clinical, 2024 ); psychophysiological approach ( Blinova et al., 2017 ; Blinova et al., 2017 ; Barbier et al, 2022 ; Borji et al, 2014 ); ideas about the relationship between EEG parameters and intellectual indicators ( Gamirova et al., 2023 ; Pavlenko et al., 2023 ; Lobasyuk et al., 2021 ).
In one of our previous works, a relationship was also established between general intelligence and functional state in adolescents with ASD and mental retardation ( Vorobyeva and Rahimova, 2023 ).
In correctional and developmental work with adolescents with autism spectrum disorders and mental retardation, the issue of taking into account their individual psychological characteristics (specificly, intellectual characteristics; neuropsychological characteristics; psychophysiological characteristics, such as the speed of response and the characteristics of the functional state, manifested in the parameters of a complex visual-motor reaction, as well as the characteristics of the spectral power of the background EEG and during activation procedures) remains insufficiently studied.
Materials and Methods
The study involved 34 teenagers (7 girls and 27 boys) aged 12–17 with ASD and mental retardation, students at the Rostov Specialized Boarding School No. 41 and the Rostov Specialized Boarding School No. 42 (Rostov-on-Don). The study was conducted individually.
Research methods. The electroencephalograph “Encephalan-EEGR-19/26” manufactured by “Medicom” in Taganrog (Russia) was used to record the EEG. 21 electrodes were placed according to the International 10–20 electrode placement system in Fp1, Fp2, Fpz, F3, F4, F7, F8, Fz, C3, C4, Cz, T3, T4, T5, T6, P3, P4, Pz, O1, O2, Oz positions using a monopolar scheme with ipsilateral earlobe referents. Polygraphic channels (electromyogram (EMG), galvanic skin response (GSR), electrocardiogram (ECG))
were used to track and suppress artifacts. Recording was made in an isolated room. The analysis epoch was 10 minutes. The resistance did not exceed 10 kOhm. The EEG recording was performed with the “background”, “eyes open”, “eyes closed” functional tests, tests with photo- and phono-stimulation, test with hyperventilation. This article presents estimates of the spectral power absolute values of the background EEG in the ranges of delta-1 (0-2 Hz), delta-2 (2-4 Hz), theta (4-7 Hz), alpha (8-12 Hz), beta-1 (14-20 Hz), beta-2 (20-35 Hz).
The children’s version of the D. Wechsler test (WISC) was used in the adaptation of A. Yu. Panasyuk for the diagnosis of intelligence ( Panasyuk, 1991 ).
The functional state was assessed based on the parameters of the complex visual-motor reaction (CVMR) using the UPFT-1/30 Psychophysiologist psychophysiological testing device (Medicom MTD, Russia, Taganrog). The level of sensorimotor reactions (LOSR) was assessed as follows: >0.81 — high; 0.58–0.8 — above average; 0.59–0.36 — average; 0.37–0.1 — below average; < 0.1 — low ( Methodical, 2015 ). Statistica 10.0 was used for statistical processing (Spearman’s rank correlation coefficient, oneway analysis of variance (ANOVA), post-hoc analysis with Bonferroni correction).
Results
Spectral power absolute values analysis of the background EEG (with closed eyes) was performed. Table 1 presents the results of spectral power absolute values analysis of background EEG by ranges (delta-1 (0–2 Hz), delta-2 (2–4 Hz), theta (4–7 Hz), alpha (8–12 Hz), beta-1 (14–20 Hz), beta-2 (20–35 Hz)) in Fp1, Fp2, Fpz, F3, F4, F7, F8, Fz, C3, C4, Cz, T3, T4, T5, T6, P3, P4, Pz, O1, O2, Oz leads.
Table 1. Results of the analysis of spectral power absolute values of background EEG
|
Positions |
Power by range (µV 2 ) |
|||||
|
Delta-1 |
Delta-2 |
Theta |
Alpha |
Beta-1 |
Beta-2 |
|
|
Fp1 |
9,5±5,6 |
15,3±7,9 |
18,1±14,2 |
21,4±18,4 |
6,3±4,4 |
0,1±0,1 |
|
Fp2 |
9,4±4,7 |
16,0±8,2 |
21,2±15,5 |
38,4±44,9 |
7,9±6,5 |
0,1±0 |
|
Fpz |
15,8±7,8 |
20,7±8,5 |
19,6±10,8 |
16,7±11 |
6,2±3,3 |
0,1±0,1 |
|
F3 |
10,6±5,8 |
16,4±8,3 |
21,4±17,2 |
39,9±39,3 |
7,9±6,2 |
0,1±0,1 |
|
F4 |
10,4±5,0 |
16,4±8,3 |
23,7±21,2 |
63,9±87,4 |
8,6±5,4 |
0,1±0 |
|
F7 |
8,9±4,4 |
14,6±7,2 |
18,6±13,1 |
22,5±21,0 |
6,6±5 |
0,1±0 |
|
F8 |
9,5±5,6 |
15,3±7,9 |
18,1±14,2 |
21,4±18,4 |
6,3±4,4 |
0,1±0,1 |
|
Fz |
13,1±5,5 |
20,0±7,6 |
26,3±14,3 |
25,4±20 |
7,9±4,6 |
0,1±0,1 |
|
C3 |
11,4±6,3 |
17,5±9,3 |
23,2±19,0 |
57,6±61,7 |
9,6±6,5 |
0,2±0,2 |
|
C4 |
11,9±5,1 |
18,1±8,6 |
26,1±18,8 |
37,6±35,8 |
8,4±6,2 |
0,1±0 |
|
Cz |
12,1±5,0 |
20,3±8,5 |
27,6±18,4 |
37,4±34,8 |
8,6±5,9 |
0,1±0,1 |
|
T3 |
9,4±4,7 |
16,0±8,2 |
21,2±15,5 |
38,4±44,9 |
7,9±6,5 |
0,1±0 |
|
T4 |
10,6±5,8 |
16,4±8,3 |
21,4±17,2 |
39,9±39,3 |
7,9±6,2 |
0,1±0,1 |
|
T5 |
10,4±5,0 |
16,4±8,3 |
23,7±21,2 |
63,9±87,4 |
8,6±5,4 |
0,1±0 |
|
T6 |
11,4±6,3 |
17,5±9,3 |
23,2±19,0 |
57,6±61,7 |
9,6±6,5 |
0,2±0,2 |
|
P3 |
12,3±5,5 |
19,7±9,0 |
24,8±17,7 |
72,7±91,5 |
9,6±6,7 |
0,1±0 |
|
P4 |
11,7±5,1 |
17,9±9,6 |
26,5±19,3 |
71,3±91,0 |
10,1±7,5 |
0,1±0,1 |
|
Pz |
12,4±5,7 |
20,1±9,6 |
26,6±19,1 |
75,8±96,9 |
10,2±7,6 |
0,1±0,1 |
|
O1 |
11,6±6,0 |
17,2±9,5 |
21,6±16,1 |
90,8±97,9 |
10,7±6,5 |
0,1±0,1 |
|
O2 |
10,8±5,5 |
14,5±7,4 |
22,0±17,0 |
66,9±56,5 |
11,9±6,6 |
0,2±0,2 |
|
Oz |
11,3±6,1 |
18,0±10,5 |
22,3±18,2 |
75,0±78,4 |
10,8±6,9 |
0,2±0,1 |
The data presented in Table 1 shows that adolescents with ASD and intellectual disability have absolute spectral power values of background EEG within the normal range in the delta-1, theta and beta-1 ranges, a wide range of absolute spectral power values in the alpha range, as well as an increase of absolute spectral power values in the delta-2 range and a decrease in absolute spectral power values in the beta-2 range compared to age-related normative indicators ( Tereshchenko et al., 2010 ). The following descriptive statistics were obtained from the participants’ completion of the WISC test: verbal intelligence 63.7±17.5, non-verbal intelligence 82.5±24.8, general intelligence 69.6±20.4. Analysis of the general intelligence level showed that 16 people (52%) have the “intellectually poor” level, 4 people have the “borderline” level (13%), 5 people have the “below average” level (16%), 5 people have the “average” level (16%), 1 person has the “high” level (3%). Results show that the study participants have a statistically higher level of non-verbal intelligence compared to verbal intelligence (z = 2.7, p < 0.01).
A one-way analysis of variance was carried out for the spectral power absolute values of the background EEG of different ranges depending on the level of general intelligence. Further, in Figures 1, 2 and 3, statistically significant results of one-factor ANOVA are presented, where the assessment of the level of general intelligence was used as an independent variable, and the assessment of the spectral power of the background EEG was used as a dependent variable.
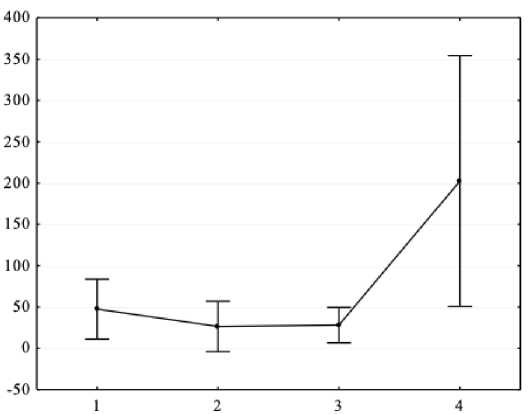
Figure 1. Results of one-way analysis of variance (X-axis – independent variable: general intelligence level (1 - intellectually poor, 2 - borderline level, 3 - below average, 4 - average level); Y-axis – dependent variable – spectral power absolute values of the background EEG alpha range in P3 lead, μV2.

Figure 2. Results of one-way ANOVA (X-axis – independent variable: general intelligence level (1 – intellectually poor, 2 - borderline level, 3 - below average, 4 - average level); Y-axis – dependent variable – spectral power absolute values of the background EEG alpha range in P4 lead, μV2.
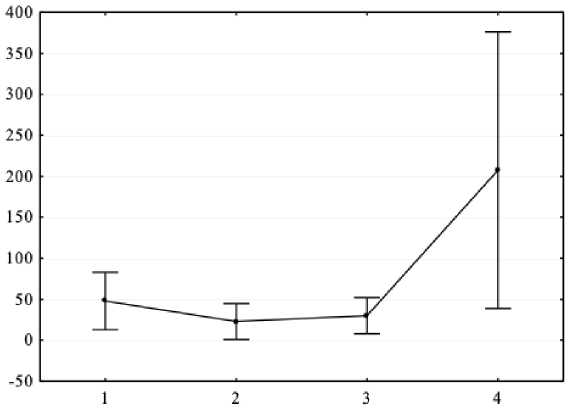
Figure 3. Results of one-way ANOVA (X-axis – independent variable: general intelligence level (1 – intellectually poor, 2 – borderline zone, 3 – below average, 4 – average IQ); Y-axis – dependent variable – spectral power absolute values of the background EEG apha range in Pz lead, μV2.
As a result of one-way analysis of variance, it was found that there are significant differences in the EEG spectral power in adolescents with ASD and mental retardation in the alpha range for P3 (F = 4.6, p < 0.05), P4 (F = 3.99, p < 0.05) and Pz (F = 4.18, p < 0.05) leads. Post-hoc comparisons with Bonferroni correction showed that a higher level of general intelligence corresponds to a higher EEG spectral power in the alpha range (all p < 0.05).
Moreover, a higher level of general intelligence corresponds to a higher spectral power of the EEG in the alpha range. As a result of completing the task on complex visual-motor reaction (it was possible to assess the visual-motor reaction time in 31 teenagers), the following indicators were assessed: average reaction time (ms) 666.9±197.6, integral reliability index (IRI) 29.3±25.9, standard deviation (ms) 211.5±101.5, number of anticipations 2.4±3.5, number of incorrect answers 1.4±1.4, number of omissions 2.0±3.1, total number of errors 6.1±6.6, class of sensorimotor reactions 1.9±1.55, assessment of the level of sensorimotor reactions 0.17±0.23. The assessment of the level of sensorimotor reactions showed that seven (23%) adolescents with ASD and mental retardation failed to complete the task during the complex visual-motor reaction test, due to the fact they completed the task too slowly, made a critically large number of errors or did not understand the instructions. Further, the number of adolescents with ASD and mental retardation who completed the complex visual-motor reaction task was distributed as follows: the first (low) class of sensorimotor reactions was detected in eight adolescents (26%), the second (below average) class - in four adolescents (13%), the third (average) class - in six adolescents (19%), the fourth (above average) class - in five adolescents (16%), the fifth (high) class - in one adolescent (3%).
A one-way analysis of variance was performed for the absolute values of the spectral power of the background EEG of different ranges depending on the class of sensorimotor reactions. The results of the conducted one-factor ANOVA on the influence of the class of sensorimotor reactions on the spectral power of the background EEG are presented in Figures 4, 5, 6.
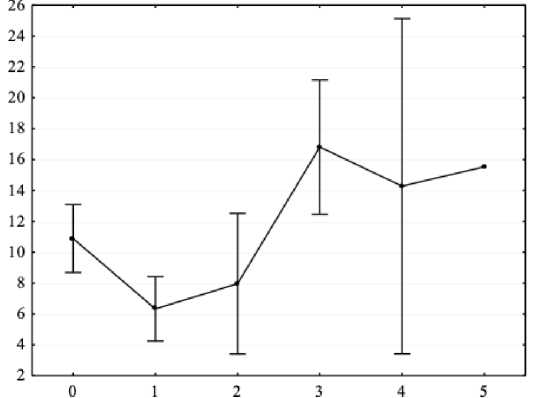
Figure 4. Results of one-way ANOVA (X-axis – independent variable: sensorimotor reaction class (0 – no class, 1 – low, 2 – below average, 3 – average, 4 – above average, 5 – high); Y-axis – dependent variable – spectral power absolute values of the background EEG beta-1 range in O2 lead, μV2.
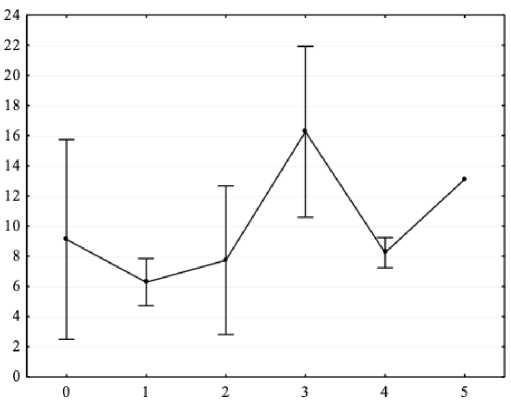
Figure 5. Results of one-way ANOVA (X-axis – independent variable: sensorimotor reaction class (0 – no class, 1 – low, 2 – below average, 3 – average, 4 – above average, 5 – high); Y-axis – dependent variable – spectral power absolute values of the background EEG beta-1 range in Oz lead, μV2.
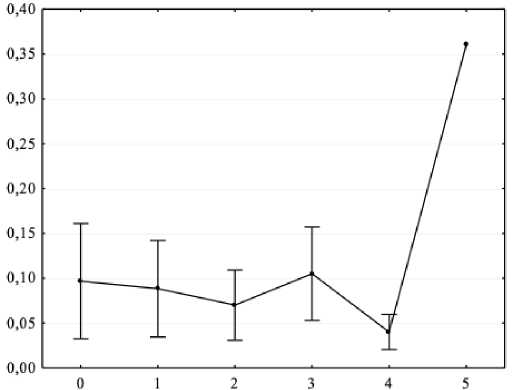
Figure 6. Results of one-way analysis of variance (X-axis – independent variable: sensorimotor reaction class (0 – no class, 1 – low, 2 – below average, 3 – average, 4 – above average, 5 – high); Y-axis – dependent variable – spectral power absolute values of the background EEG beta-2 range in F8 lead, μV2.
The conducted one-factor ANOVA allowed us to determine the parameters of the EEG spectral power in the background of adolescents with ASD and mental retardation: in the beta1 range for O2 (F = 4.53, p < 0.05) and Oz (F = 3.18, p < 0.05) leads; in the beta2 range for F8 (F = 4.81, p < 0.05) lead. Post-hoc analysis with Bonferroni correction showed that the average class of sensorimotor reactions corresponded to higher spectral power values in the beta-1 range; a higher class of sensorimotor reactions corresponded to higher spectral power values in the beta-2 range (all p < 0.05).
One-factor ANOVA also showed that, depending on the class of sensorimotor reactions, there were statistically significant differences in the spectral power of the galvanic skin response (F = 18.8; p < 0.01) and electrocardiogram (F = 513.31; p < 0.01) data recorded during the background electroencephalogram recording.
Discussions
As shown by the results obtained in this work, a higher level of intelligence corresponds to a higher EEG spectral power in the alpha range for P3, P4 and Pz leads in adolescents with ASD and mental retardation. This may indicate instability of information processing processes, which existing data confirms ( Boutros et al., 2015 ; Arutiunian et al., 2023 ; Gamirova et al., 2023 ). In our work, it was found that, according to the parameters of the complex visual-motor reaction, the average class of sensorimotor reactions in adolescents with ASD and mental retardation corresponds to higher values of the EEG spectral power of the beta-1 range for O2 and Oz leads, and a higher class of sensorimotor reactions corresponds to higher values of the spectral power in the beta-2 range for F8 lead. An increase in the parameters of sensorimotor reactions at the EEG level corresponds to an increase in the high-frequency component in the right frontal region in adolescents with ASD and mental retardation, which can be regarded as an increase in the activation of the right frontal cortex.
It was also found in our work that in relation to the parameters of a complex visual-motor reaction, a higher class of sensorimotor reactions corresponds to higher spectral power values of the GSR and ECG, that is, at a higher level of the functional state, the peripheral nervous system is more activated. The higher values of the peripheral nervous system performance indicators in adolescents with ASD and mental retardation obtained in our work are also consistent with the information on the features of its work in these groups of adolescents ( Gul et al., 2020 ).
Conclusions
-
1. In adolescents with ASD and mental retardation, a higher level of general intelligence corresponds to a higher spectral power of the EEG in the alpha range in the parietal region.
-
2. Evaluation of the complex visual-motor reaction showed that the average class of sensorimotor reactions in adolescents with ASD and mental retardation corresponds to a higher spectral power in the beta-1 range of the right and central occipital region; a higher class of sensorimotor reactions corresponds to a higher spectral power in the beta-2 range of the right frontal region.
-
3. A higher class of sensorimotor reactions corresponds to higher spectral power values of the galvanic skin response and electrocardiogram.
Obtained results contribute to the theoretical basis of psychophysiology and psychology of adolescents with ASD and mental retardation. The obtained data is used to draw up a plan for psycho-correctional and psycho-developmental work.
Acknowledgments
The authors would like to express their sincere gratitude to the 34 participants who cooperated in this study.
Conflict of interests
The authors declare no conflict of interest.
Author Contributions
Conceptualization and methodology, Vorobyeva E.; formal analysis, Rahimova E.; writing—original draft preparation, Vorobyeva E., Rahimova E.; writing—review and editing, Vorobyeva E., Rahimova E.; All authors have read and agreed to the published version of the manuscript.
