Stable isotope analysis: outline of methodology and a review of studies in Siberia and the Eurasian steppe

Author: Svyatko S.V.
Journal: Archaeology, Ethnology & Anthropology of Eurasia @journal-aeae-en
Section: Paleoenvironment, the stone age
Article in issue: 2 т.44, 2016.
Free access
Short address: https://sciup.org/145145262
IDR: 145145262 | DOI: 10.17746/1563-0110.2016.44.2.047-055
Text of the article Stable isotope analysis: outline of methodology and a review of studies in Siberia and the Eurasian steppe
Isotope analysis is one of the most productive modern techniques for the investigation of various aspects of life in ancient populations, such as diet and migrations. Carbon (δ13C) stable isotope analysis is used to estimate the proportions of so called C3 versus C4 plants and to distinguish between the consumption of marine versus terrestrial organisms in an individual’s diet; and it is often used in conjunction with nitrogen stable isotope (δ15N) analysis, which identifies the trophic level (position in a food chain) of an individual. Hydrogen isotope ratios (δD) of bone collagen can also demonstrate a trophic level effect (Reynard, Hedges, 2008). The sulfur (δ34S), lead (208Pb/206Pb and 207Pb/206Pb), strontium (87Sr/86Sr), and oxygen (δ18O) isotope values reflect the geographical origin of an individual, as these are characteristic of particular regions. Analysis of sulfur isotopes has also been employed in studies of estuarine food webs where there is a pronounced difference between the isotopic composition of primary sulfur-sources—for example, between marine, freshwater, and terrestrial sulfate (Richards, Fuller, Sponheimer et al., 2003; Privat, O’Connell, Hedges, 2007).
This work focuses on carbon and nitrogen stable isotope analysis of bone collagen. This technique allows
dietary measurements at individual level, and the analysis of a group of people can demonstrate dietary variations within a population (between people of different sexes, age groups, and social status).
Theoretical framework of the method
Use of carbon isotopes. Carbon occurs in the atmosphere in two stable isotopes, 12C and 13C. Isotopic ratio of 13C/12C is expressed in delta (δ) values per mil (‰), relative to the international standard of PDB (a marine fossil Belemnitella from the Pee Dee geological formation in South Carolina). In the process of photosynthesis, carbon atoms are incorporated into plants in the form of CO2, and then transferred further up the food chain. There are several types of photosynthetic pathways. Most plants use the C3 photosynthetic pathway, which incorporates atmospheric CO2 into a three-carbon molecule in plant tissue; but some use the C4 photosynthetic pathway, which generates a molecule containing four carbon atoms. The latter group is represented by approximately ten plant families; and includes, in particular, maize, cane sugar, certain millets, chenopods, sorghums, and amaranths. The Crassulacean acid metabolism (CAM) group of plants, represented by tropical succulents, also exists; but these plants only rarely form part of the diets of herbivores or humans. C3 plants are well adapted to temperate climates, their δ13C values average about –26.5 ‰. C4 plants are better adapted to arid climates and their δ13C average about –12.5 ‰ (Chisholm, 1989; Tieszen, Fagre, 1993).
A fractionation difference of around 4–5 ‰ occurs between the δ13C values of plant food and the bone collagen of its consumer. This is the “collagen enrichment factor” and is caused by the metabolic processes of the consumer (Ambrose, 1993). Thus, the bone collagen δ13C value from herbivores that subsist only on C3 grasses would be ca –21.5 ‰. If the diet were based only on C4 grasses, δ13C would be ca –7.5 ‰. If an individual consumes both C3 and C4 species, the δ13C value for its collagen will lie somewhere between –21.5 and –7.5 ‰, and ideally the proportions of C3 and C4 plants in its diet could be estimated.
A small (approximately 0.5–2 ‰) enrichment for isotopic values of carbon occurs in each step of a food chain: if the δ13C value of bone collagen of a herbivore subsisting on C3 plants provides a value of ca –21.5 ‰, then the collagen of a human consuming the meat of that herbivore will give a δ13C value of ca –20.5 ‰ (Schoeninger, 1985; Bocherens, Drucker, 2003). Therefore, carbon isotopic ratios may be enriched in weaning infant mammals, owing to the trophic level increase as a result of consuming maternal milk (Jenkins et al., 2001).
The δ13C values in marine ecosystems usually lie in an intermediate position between the values of terrestrial C3 and C4, depending on their carbon sources. Freshwater aquatic food-webs appear to have more depleted C3-like carbon isotopic compositions (Ambrose, 1993). Therefore, freshwater fish appears to be more problematic to detect in paleodietary reconstructions, as compared to marine fish. As both the consumption of C4 plants and marine food can result in increased δ13C values of bone collagen, it can be difficult to distinguish between the two dietary components when the analysis is restricted to only carbon stable isotopes. However, an examination of stable isotopes of both carbon and nitrogen can address this issue, as nitrogen stable isotope analysis enables the determination of the trophic level of a consumer.
Several non-dietary factors may also affect the carbon isotopic ratios of an adult individual. In particular, the canopy effect in forests results in more negative δ13C of leaves nearest the ground, in the shade, in comparison with those at the top of canopy (van der Merwe, Medina, 1991). This effect extends on to the food chain, to forest and aquatic fauna, and thus will apparently have an effect on δ13C values of humans consuming fauna from different areas.
Use of nitrogen isotopes. Nitrogen is represented by two stable isotopes, 14N and 15N. Their isotopic ratio (δ15N) is expressed per mil (‰) relative to the international standard of atmospheric nitrogen (i.e. Ambient Inhalable Reservoir, or AIR). Nitrogen penetrates into most plants from soil as a result of bacterial degradation; the δ15N values of most modern plants vary between 0 and 5 ‰. The consumer collagen usually displays δ15N ratios, which are about 3–6 ‰ greater than its diet (Hedges, Reynard, 2007; O’Connell et al., 2012). Therefore, the nitrogen isotopic values of populations that rely on terrestrial herbivore animal protein in their diet would average around 9 ‰, although this depends on the starting nitrogen isotopic values of local plants. The nitrogen levels of a consumer will further increase when relying on aquatic resources, owing to the more complicated structure of the food-web (e.g. a larger number of trophic levels) in water ecosystems.
Past research has suggested several non-dietary factors which may influence the nitrogen isotopic ratios of an adult individual.
Nursing effect. Pre-weaned infants less than two years of age are commonly enriched with nitrogen by around 2–3 ‰, as compared to weaned infants and older individuals: the feeding child is a level higher in the food-chain than its mother. For this reason, young individuals are usually excluded from stable-isotope studies, as their high δ15N levels can confuse the dietary interpretations. Since most of an individual’s teeth are formed during infancy, dentine and enamel are also subject to the nursing effect. However, the isotopic analysis of dentine is widely used for determining the weaning age (see, e.g., (Clayton, Sealy, Pfeiffer, 2006)).
Climatic effect. δ15N ratios in humans and animals may be higher in arid, savannah or desert environments (see, e.g., (Murphy, Bowman, 2006)).
Manuring effect. Manuring increases δ15N ratios of soil and, consequently, the ratios of plants raised in manured soil (Bogaard et al., 2007, 2013). One can suggest that continuous use of nitrogen-enriched plants in the diet would increase the δ15N ratios of the bone collagen of a consumer, which could be erroneously interpreted as a result of consumption of animal protein.
Limitations of carbon and nitrogen stable isotope techniques. Bone collagen is the main material used for carbon and nitrogen stable isotope analysis. Collagen is absorbed primarily from the protein component of the diet, and therefore it reflects mainly the protein sources of the individual’s diet (Chisholm, 1989). Bone, including its collagen component, is constantly being repaired. According to different data, the turnover rate of bone-collagen varies between two and 30 years, depending on the particular part of the skeleton (Ibid.; Wild et al., 2000). For example, it has been demonstrated that the collagen turnover-rate in a human femur is more than ten years (Hedges et al., 2007). In trabecular bone, the turnover is quicker than in the cortical part of bone (Parfitt, 1994; Manolagas, 2000). Thus, isotopic data reflect not the average diet of the individual’s entire life, but rather the diet of the last decade before death. Comparison of the results from collagen and dentin enables identification of an individual’s dietary changes or migrations throughout his life.
Bone-sampling and pretreatment of osteological materials
Stable isotope analysis requires several grams of compact, solid bone (brittleness of bone often indicates that its collagen has degraded). Ideally, samples from a group of individuals should originate from the same part of each skeleton. As mentioned above, depending on the nature of the study, tooth-dentin should be treated with caution. Obviously, bones with traces of contaminants (glue, ink) should not be sampled.
In most laboratories, pretreatment of the bone sample for the analysis (collagen extraction) is carried out using an improved method (Brown et al., 1988), with an additional ultrafiltration step (Bronk Ramsey et al., 2004), and includes bone demineralization, protein gelatinization, filtration and ultrafiltration of gelatin (for removing the smallest impurities), and subsequent freezedrying. The isotopic composition of the resulting dry collagen is analyzed using a mass spectrometer.
Quality assessment for well-preserved bone gelatin
-
1. Bone collagen content of at least 0.5 % (van Klinken, 1999).
-
2. Carbon to nitrogen atomic ratio of collagen (C : Nat) within 2.9–3.5 (DeNiro, 1985; Bronk Ramsey et al., 2004). C : Nat is calculated according to the following %С 14
-
3. As an additional criterion, the individual contents of carbon and nitrogen in collagen can be used. %C = = 34.8±8.7 (1σ) wt and %N = 11÷16 wt are characteristics of well-preserved collagen (van Klinken, 1999). Higher %C ratios might indicate admixture of organic carbon, while lower ratios indicate the admixture of inorganic substances.
formula: С : Nat = ---х — , where %C and %N represent at , carbon and nitrogen content in collagen.
When publishing the results, in addition to the laboratory ID and isotopic results, the collagen content/ yield of the sample, С : Nat, skeletal part analyzed, and also the species, sex, and age of the individual and details of the burial (site, grave/skeleton number) should be specified.
Review of studies in Siberia and the Eurasian Steppe
To date, a substantial number of paleodietary studies using stable isotope analysis has been undertaken throughout the world, in particular with regard to the economy of ancient populations in the transitional periods between various archaeological epochs (Richards, Schulting, Hedges, 2003), and the spread of cereals in Asia (Pechenkina et al., 2005; Hu et al., 2008) and America (Schoeninger, 2009). This section brings together examples of the most relevant work carried out in the Eurasian Steppe (Fig. 1). The modern isotopic background (analysis of plants) for the region has been presented in series of works (Makarewicz, Tuross, 2006; Makarewicz, 2014; Wang, 2004, 2005; Wang et al., 2005; Pyankov et al., 2000; and others).
Northern China. As documented archaeologically, millet-cultivation has been practiced in Northern China since 6500 BC, and by 5000 BC millet-remains are found in nearly every site of the region. However, the isotopic analysis of the Early Neolithic individuals from the Henan Province (site of Jiahu, 7000– 5800 BC) suggests for this population a primarily C3-based diet that included a substantial proportion of animal protein. Further stable-isotope analysis of humans from the Xiaojingshan site (6000 BC) showed that millet contributed approximately 25 % of dietary protein, with the rest coming from C3-based plant and animal sources (Hu et al., 2008).
Interesting results were obtained for humans from the Xinglongwa site (6200–5400 BC) in Inner Mongolia (Ibid.). Despite the high δ13C and δ15N values of humans (δ13Cmean= –8.9 ‰; δ15Nmean= 9.6 ‰), soil flotation showed very little evidence of millet-grains; however, pollen analysis and plant-seed recovery performed in the area nearby revealed that a large number of C4 species dominated the grassland. Apparently, high δ13C values in human collagen came from the consumption of C4-derived animal protein, rather than from the direct consumption of millet.
Stable-isotope evidence from Middle-to-Late Neolithic humans and animals from Northern China indicates subsistence strategies different from those of Early Neolithic populations. Human samples from Jiangzhai and Shijia (4900–4000 BC) suggest that millet constituted 75–85 % of their diet. Pig and dog samples from Xipo and Kangjia sites (4000–3500 and 2500– 2000 BC respectively) indicate consumption of substantial amounts of C4 plants (presumably millets) by those animals. Apparently, millet was used as a fodder for the animals (Pechenkina et al., 2005). However, it is quite possible that pigs and dogs just scavenged human refuse for food.
Southern Trans-Urals. A variety of domestic animal remains, as well as burnt food residues from the interior of the pottery vessels found in the Bolshekaragansky cemetery (the necropolis of the settlement of Arkaim, Sintashta culture, 18th–16th centuries BC) suggest that meat, dairy, and plant (including cereal) meals formed the basis of the human diet. However, the results of the isotopic analysis of humans and animals from kurgan 25 of Bolshekaragansky cemetery and from Kamennyi Ambar-5 site indicate that people consumed a large amount of animal protein, and were not dependent upon plants as their primary source of nutrition (Privat, 2002).
Baraba forest-steppe. The archaeological finds from the Late Bronze–Iron Age site of Chicha-1 (14th century BC to 1st century AD), including bird- and fish-bones, suggest that stock-breeding, fishing, and hunting were the main sources of subsistence for the people. Systematic investigations of the site did not reveal any botanical remains which could be associated with agriculture. Isotopic analysis of humans, fish, and terrestrial fauna from Chicha-1 indicates that freshwater resources, primarily fish, formed the main protein source for the population, with further dietary input from domestic and wild terrestrial herbivores, mainly horse and elk (Privat et al., 2005).
Dnieper region. The analysis of humans and fauna from Mesolithic and Chalcolithic sites of the Dnieper Rapids region of Ukraine revealed that the diet of the populations throughout the period of 10 000– 4500 cal BC was based mainly on C3 terrestrial resources and significant amount of river-fish (Lillie, Richards, 2000; Lillie, Jacobs, 2006; Lillie, Budd, Potekhina, 2011). The overall contribution of river-fish apparently increased during the Neolithic.
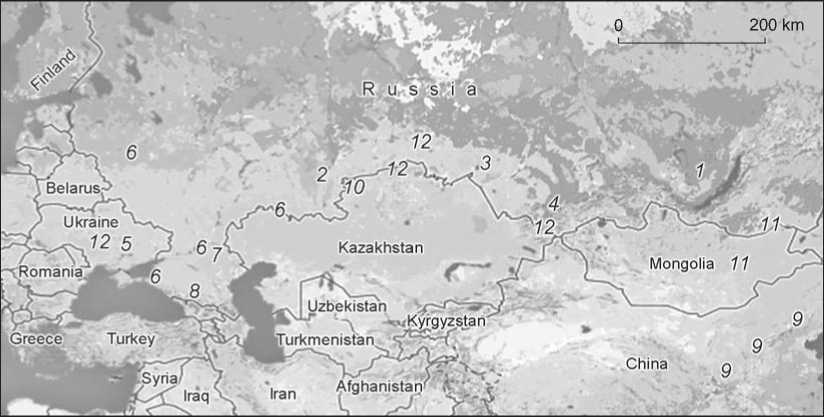
Fig. 1. Isotopic research in the Eurasian Steppe:
1 – Lake Baikal region (Katzenberg, Goriunova, Weber, 2009; Katzenberg et al., 2012; Katzenberg, Weber, 1999); 2 – Chelyabinsk Region (Privat, 2002); 3 – Baraba forest-steppe (Privat et al., 2005); 4 – Minusinsk Basin and Tuva (Murphy et al., 2013; Svyatko et al., 2013); 5 – Dnieper region (Lillie, Richards, 2000; Lillie, Budd, Potekhina, 2011); 6 – Volga-Don interfluve, middle Ural River, Novorossiysk and Moscow Regions (Iacumin et al., 2004); 7 – Northern Caspian region (Shishlina et al., 2007, 2009, 2012); 8 – North Caucasus (Hollund et al., 2010); 9 – Northern China (Hu, Ambrose, Wang, 2006; Hu et al., 2008; Pechenkina, Benfer, Zhijun, 2002; Pechenkina et al., 2005; Pechenkina, Benfer, Xiaolin, 2007); 10 – Northern Kazakhstan (Miller et al., 2014); 11 – Mongolia (Fenner, Tumen, Khatanbaatar, 2014); 12 – sites of Botai (Kazakhstan), Krivoy Rog (Ukraine), Verkh-Kaldzhin-2 (the Altai Republic), and Abatsky-3 (SW Siberia) (O’Connell, Levine, Hedges, 2003).
North Caucasus. Chalcolithic to Bronze Age materials from North Caucasus (Hollund et al., 2010) revealed a negative correlation between isotopic values of humans and fauna on the one hand, and geographical location of the sites on the other: the highest isotopic values were observed in individuals from arid steppeareas in the north of the region. Apparently, climatic fluctuations in the region resulted in isotopic variations in local fauna, and, subsequently, in humans. In general, high δ15N ratios of people also suggest dietary reliance on aquatic sources.
The European part of Russia. The possible relation between the aridity of a region and the isotopic ratios of its inhabitants has also been observed by Iacumin et al. (2004). C4 plants have been recorded in the steppe zone of the European part of Russia from at least the 3rd millennium BC; however, there is no evidence for C4 plants in Moscow Region until at least the 3rd millennium BC, and in the Black Sea coast until at least the 4th millennium BC. The diet of the human populations of the steppe was mainly terrestrial-based, and included some proportion of fish. By contrast, the ancient Mesolithic and Neolithic populations who lived in the territory of modern Moscow Region apparently used large amounts of fish.
Northern Caspian region. The Bronze Age population of the Caspian steppes are characterized by particularly high δ15N levels and a generally wide spread of both isotopic values (Shishlina et al., 2007, 2009, 2012). This is probably related to both dietary (a large proportion of aquatic foods—fish and shellfish) and climatic factors (increased δ15N values in plants during arid periods).
Northern Kazakhstan. The archaeological data indicate that in the Middle and Late Bronze Age, significant changes occurred in the settlement patterns and mortuary practices of the region, which traditionally have been related to the transition from a semi-settled lifestyle (combining stock-rearing and agriculture) to more mobile forms of pastoralism. However, stable-isotope analysis of humans and fauna from the Bestamak and Lisakovsk sites (Middle and Late Bronze Age, respectively) demonstrated that the diet of the population did not undergo significant change (Miller et al., 2014). The diet of the populations was primarily based on C3 resources, including meat and dairy products, and a small portion of fish.
Lake Baikal. From the isotopic perspective, this region is outstanding, as local fauna demonstrate a highly variable range of both carbon and nitrogen values (Katzenberg, Goriunova, Weber, 2009; Katzenberg et al., 2012; Katzenberg, Weber, 1999). Freshwater fish are highly variable in the δ13C values ranging from –24.6 ‰ for the pelagic omul to –12.9 ‰ for littoral species such as ide. Nitrogen isotopic values for the freshwater seals average 14±1.1 ‰, whereas terrestrial herbivores have much lower δ15N values, ranging from 4 to 5 ‰ for deer and elk. These data demonstrate that considerable variation in the carbon stable isotope values of various animal species can occur even in inland freshwater ecosystems.
Isotopic variations in the prehistoric humans were primarily related to the proximity of the sites to the Lake: people who lived close to the Lake had the highest δ13C and δ15N values for collagen, suggesting their reliance on the fish and seals from the Lake. People who lived further down the Angara River and along the upper Lena River had lower δ13C and δ15N values, and apparently relied mainly on terrestrial herbivores and riverine fish as their protein source.
Mongolia. The appearance of the Mongol Empire in the 13th century significantly affected the lifestyle of both conquered populations and the conquerors. To assess the influence on its own population of the emergence of the Empire, isotopic analyses of the elite cemetery of Tavan Tolgoi, the less elite cemetery of Tsagaan chuluut, Bronze Age necropolis of Ulaanzuukh, and post-Empire human remains from Eastern Mongolia have been conducted (Fenner, Tumen, Khatanbaatar, 2014; Turner et al., 2012). In general, the results reveal C3-food chains for the populations. δ15N values of individuals from Tavan Tolgoi are significantly higher than those from Tsagaan chuluut and Ulaanzuukh. This was apparently related to either more animal protein in the diet of the elite strata, or to varying isotopic backgrounds for the three regions. No other differences in the diet of the elite and common people, nor in that of local Bronze Age pastoralists, have been identified.
Southern Siberia. Several isotopic studies have been performed in Southern Siberia (Murphy et al., 2013; Svyatko et al., 2013). Analysis of ca 280 human and animal bones from approximately 40 sites of five Chalcolithic to Early Iron Age archaeological cultures of the Minusinsk Basin (Svyatko et al., 2013) allowed a number of conclusions to be drawn:
– the diet of all the populations included fish;
– regional variations in the diets of different groups of the same culture have been observed, which apparently reflects the adaptation of people to the local landscapes and climates; and
– by the 14th century BC, millet (apparently brought from Northern China) spread in the Minusinsk Basin. This datum is consistent with the archaeological evidence for extensive contacts between the Karasuk and Tagar populations and China at the end of the Bronze Age and the beginning of the Early Iron Age. Apparently, Southern Siberia became one of the first centers for the spread of millet in Siberia in general. However, the exact time of the appearance of millet still needs to be specified, taking into account the possible existence of freshwater reservoir effects in the region.
Conclusions. At the moment, stable-isotope paleodietary studies in Siberia and the Eurasian Steppe are at the data acquisition stage. Many regions, populations and phenomena still remain unexplored (e.g., the impact of climate-change on the isotope values of humans and animals, spread of millet in the region, the role of fish consumption and manuring in different cultures, etc.).
In general, the diet of the populations of various archaeological cultures in Siberia and the Eurasian Steppe varied in time and space (Fig. 2). The latter was apparently related to the attempts of people (even within the same culture) to adapt to specific environmental conditions.
The majority of the inland Neolithic–Bronze Age cultures (with the exception of the population from the Lake Baikal region) demonstrate low δ13C values (below –18 ‰) and relatively high δ15N levels, which is characteristic of the populations of temperate latitudes with an only partially producing economy (employing hunting, fishing and gathering together with stockbreeding). High δ15N ratios (more than one trophic level high as compared to terrestrial fauna) indicate the important role of fish in the diet of the populations, despite the common scarcity of archaeological evidence for fishing. A strong marine influence (elevated levels of both δ15N and δ13C) has been recorded for the cultures of the Caspian steppes, as well as for the Early Iron Age population of the Black Sea’s northern coast. Another food strategy was followed by the prehistoric population of Northern China: low δ15N levels indicate consumption of primarily terrestrial foods.
Elevated δ13C values, suggesting consumption of millet, have been observed in populations of Northern China from the 6th millennium BC, and in the population of the Minusinsk Depression since the 14th century BC. The increase in δ13C levels of the Early Iron Age population of Southern Urals and the Bronze Age to Medieval population of Mongolia is probably related to the aridity, which resulted in increased carbon isotopic levels of terrestrial fauna and, subsequently, humans. Obviously, even in temperate climatic zones such as the Eurasian Steppe, variation in isotopic values of their inhabitants can be determined not only by diet, but also by environmental factors (e.g. a change in humidity). Failure to take into account such factors may lead to erroneous conclusions on the diet of the populations.
One of the most important aspects of modern research in Siberia and the Eurasian Steppe is the necessity of a systematic and well-planned approach to the isotopic analysis, which should include not only the analysis of
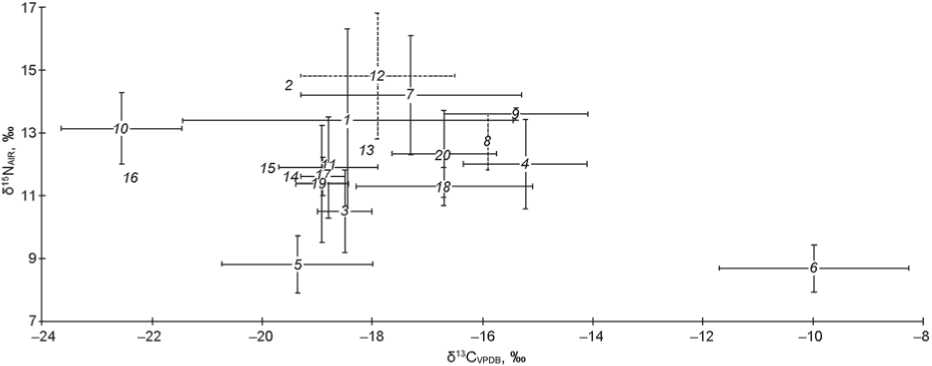
Fig. 2. Isotopic values of the Eurasian Steppe populations (mean values and standard deviations are presented; n is the number of analyzed individuals):
1 – Lake Baikal region, Neolithic–Bronze Age, n = 176 (Katzenberg, Goriunova, Weber, 2009; Katzenberg et al., 2012; Katzenberg, Weber, 1999); 2 – Baraba forest-steppe, Late Bronze–Early Iron Age, n = 13 (Privat et al., 2005); 3 – Chelyabinsk Region, Bronze Age, n = 14 (Privat, 2002); 4 – Minusinsk Basin and Tuva, Early Iron Age, n = 39 (Murphy et al., 2013); 5 – Northern China, 7000–5800 BC, n = 25 (Hu, Ambrose, Wang, 2006; Hu et al., 2008); 6 – Northern China, 6200–4000 BC, n = 20 (Pechenkina et al., 2005); 7 – Volga-Don interfluve, Bronze–Early Iron Age, n = 12 (Iacumin et al., 2004); 8 – North Black Sea region, Early Iron Age, n = 3 (Ibid.); 9 – Southern Urals, Early Iron Age, n = 2 (Ibid.); 10 – Dnieper region, Mesolithic-Chalcolithic, n = 28 (Lillie, Richards, 2000; Lillie, Jacobs, 2006; Lillie, Budd, Potekhina, 2011); 11 – North Caucasus, Chalcolithic–Early Bronze Age, n = 50 (Hollund et al., 2010); 12 – Northern Caspian region, Chalcolithic– Bronze Age, n = 78 (Shishlina et al., 2007, 2009, 2012); 13 – Botai (Kazakhstan), Chalcolithic, n = 1 (O’Connell, Levine, Hedges, 2003); 14 – Krivoy Rog (Ukraine), Chalcolithic, n = 1 (Ibid.); 15 – Altai Territory, Early Iron Age, n = 1 (Ibid.); 16 – Abatsky-3, SW Siberia, Early Iron Age, n = 1 (Ibid.); 17 – Minusinsk Basin, Chalcolithic–Middle Bronze Age, n = 132 (Svyatko et al., 2013); 18 – Minusinsk Basin, Late Bronze–Early Iron Age, n = 135 (Ibid.); 19 – Northern Kazakhstan, Early–Late Bronze Age, n = 55 (Miller et al., 2014); 20 – Mongolia, Bronze Age–Medieval period, n = 31 (Fenner, Tumen, Khatanbaatar, 2014).
humans, but also of all potential components of their diet, such as associated terrestrial and aquatic fauna and plants. It is essential to assess not only dietary changes through time, but also variations in the isotopic baselines of different regions.
In general, the main area of productive paleodietary research in the Eurasian Steppe at the moment is the synthesis of data from different sources (archaeology, isotopic analysis, dental pathology, paleobotany, paleozoology, etc.). With respect to stable isotope analysis, it is important to measure different elements: in addition to nitrogen and carbon isotope analysis, sulfur and hydrogen isotope analysis can provide very detailed data on the diets of ancient populations.
