Statistical analysis of the functional status of the students

Author: Zalyapin V.I., Isaev A.P., Erlikh V.V., Gainullin R.A.
Section: Программирование
Article in issue: 4 т.9, 2016.
Free access
The South Ural is one of the most advanced industrial regions in Russia. It has huge industrial potential (metal industry, mechanical engineering, chemical process industry, oil-extracting industry, mineral resource industry) which predetermines negative ecological trends in the region. Levels of air pollution with salts of heavy metals, phenol and CO2 are 2-4 times higher than national air quality standards. Moreover, natural background radiation in the region is increased. Under the stated conditions, low levels of motor activity lead to hypoxia and cumulative disorders of the locomotor system as well as to respiratory, gastric, oncological, allergic and other diseases. Poor environmental background significantly affects demographic rates including the life expectancy which is 72 in average for the region: 60 years for men, and 75 years for women. The paper studies how the main anthropometric and physiological parameters in the local residents who are divided into three groups according to their health status and motor activity (so called health groups) influence the physical fitness. Social-biological and medical aspect of the study - to find out the correlation between parameters in the examined people from different groups - may also be of interest for specialists working on optimization of physical education practice and student's health promotion.
Statistical analysis, cardiovascular system, skibinski index, orthostatic test, models
Short address: https://sciup.org/147159404
IDR: 147159404 | UDC: 519.23+796.01:612 | DOI: 10.14529/mmp160409
Статистический анализ функционального состояния студентов
Южный Урал один из наиболее развитых в производственном отношении регионов России. Он обладает мощным промышленным потенциалом (металлургия, машиностроение, химическая, нефтедобывающая, горнодобывающая), что создает предпосылки для неблагоприятных тенденций в развитии экологической обстановки региона. Содержание в атмосфере солей тяжелых металлов, фенола, СО2 превышает предельно допустимые концентрации в 2-4 раза. Все это сопровождается повышенным естественным радиоактивным фоном. В этих условиях низкая двигательная активность приводит к гипоксии и распространению совокупных деформаций опорно-двигательного аппарата, респираторных, желудочно-кишечных, онкологических, аллергических и других заболеваний. Вследствие неблагополучного экологического фона существенно изменяются демографические показатели, в том числе продолжительность жизни, которая составляет по региону в среднем 72 года, соответственно в мужской популяции - 60, а в женской - 75 лет. В настоящей работе исследовалось влияние основных антропометрических и физиологических показателей жителей региона, ранжированных в соответствии с особенностями состояния здоровья и двигательной активности на три группы (т.н. группы здоровья), на их физическую подготовленность. Социально-биологический и медицинский аспект исследования - выявление взаимосвязей показателей у обследуемых в различных группах - также представляет определенный интерес с точки зрения оптимизации практики физического воспитания и повышения уровня здоровья студентов.
Text of the scientific article Statistical analysis of the functional status of the students
According to the existing Russian and foreign literature [1, 2], 75 % of population suffer from disorders of general motor activity (foot deformities, disorders of extremities and spinal column, shift of general center of mass, osteoarthritis, osteochondrosis, myofascial and vertebrogenic pains) and visceral diseases (gastritis, colitis, gastric ulcers, oncological diseases) as well as from restrictive and obstructive pulmonary diseases (bronchial spasms, bronchoconstrictions).
In order to study the influence of certain health status parameters on motor activity we invited the university students who were further divided into three groups according to the results of preliminary medical examination.
The first group (16 students) included apparently healthy individuals, the second group (15 students) - individuals with insignificant abnormalities, and the third group (15 students) included individuals with significant abnormalities. The age of the students involved in our study was between 18 and 21. Physical exercising in the first group was aimed at increased motor activity (two fitness classes per week and three classes per week dedicated to their favorite sports) with 8 hours of exercising per week in total. The second group followed the regular program of physical education (2 classes per week) and, in addition, practiced weekend hiking, so both kinds of activities took 8 hours per week in total. Students from the third group followed the individual programs of exercise therapy having their classes twice a week and also practicing self-exercises on the daily basis except the exercise therapy days.
We analyzed the following parameters: age (Aye), height (Я) and weight (W) of the examined students, levels of systolic and diastolic pressure (SAD and DAD, respectively), heart rate reaction to orthostatic effect (OD), Skibinski index (Ind-Skib) and some other parameters including arm strength dynamometry results for right ( F right) and left ( F left) arms, and global strength endurance parameter. It is notable that arm strength dynamometry index reflects the specific of the students exercising, and heart rate parameters may indicate the impairment of circulation.
Physical fitness test indicator was based on the student’s performance in 100-meter race (Sprint) and 500-meter and 1000-meter cross-country running (Cross). We were mainly interested in morpho-functional parameters influencing the test results in different health groups. The results of preliminary medical examination which was used to form the health groups agree nicely with the parameters under analysis. The performed discriminant analysis of health group affiliation showed that identification of the first and the second group affiliation was absolute (100 % correct identification), and that identification of the third group affiliation was sufficient - 80 %. The total percent of correctly ranged individuals was over 93 %.
1. Analysis of Health Group Homogeneity Relative to CertainParameters 1.1. Age, Weight, Height
Statistical analysis of these parameters (ANOVA and Multiple Range Tests in particular) at 95 % reliability level does not show the influence of a certain group affiliation on the stated parameters. The absence of such influence may be seen from the weight levels ranging in groups shown in the tables below. Tables of weight (Table 1) and height
Table 1
Means for W with 95.0 percent LSD intervals
|
Group |
Count |
Mean |
Lower lim |
Upper lim |
|
1 |
16 |
54,2 |
50,9 |
57,4 |
|
2 |
15 |
55,5 |
52,1 |
58,8 |
|
3 |
15 |
55,5 |
52,1 |
58,8 |
|
Total |
46 |
55,0 |
(Table 2) of the examined and the corresponding tables (Table 3 and Table 4) of analysis of variance.
The same is observed for the Age variable. Thus, the studied groups show homogeneity relative to the parameters listed above - they do not differ significantly for members of different health groups.
Table 2
Means for Я with 95,0 percent LSD intervals
|
Group |
Count |
Mean |
Lower lim |
Upper lim |
|
1 |
16 |
163 |
161 |
166 |
|
2 |
15 |
166 |
163 |
168 |
|
3 |
15 |
166 |
163 |
168 |
|
Total |
46 |
165 |
Table 3
|
Source |
Sum of Squares |
DF |
Mean Square |
F - ratio |
P - value |
|
Between groups Within groups |
17,1 3,58E3 |
2 43 |
8,54 83,2 |
0,10 |
0,9027 |
|
Total (Corr.) |
3,59E3 |
45 |
Table 4
|
Source |
Sum of Squares |
DF |
Mean Square |
F - ratio |
P - value |
|
Between groups Within groups |
51,7 2,37E3 |
2 43 |
25,8 51 |
0,47 |
0,6291 |
|
Total (Corr.) |
2,42E3 |
45 |
ANCA A for W by Group
ANCA'A for H by Group
1.2. Systolic and Diastolic Blood Pressure
Visual analysis (Fig. 1) of dynamics of mean values of systolic (Fig. 1 (left)) and
Table 5
Contrasts for SAD and DAD by Group (Sign * denotes a statistically significant difference.)
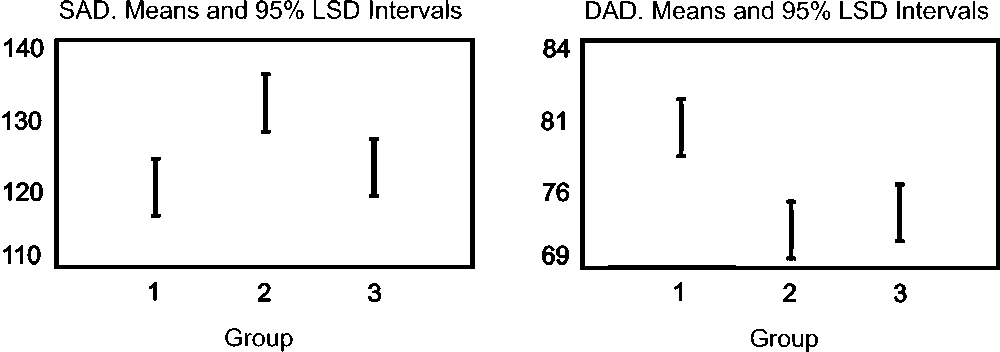
Fig. 1. Means plot for SAD (left) and DAD (right)
time levels of systolic blood pressure in the first and the third groups are statistically indistinguishable as seen from the table of contrasts (Table 5).
The same is true for the mean level of diastolic blood pressure for the first examined group. It is significantly higher than corresponding values in the second and the third groups which are indistinguishable relatively to this parameter (Fig. 1 (right), Table 5).
1.3. Orthostatic Effect
The distribution of this parameter is not Gaussian, so it is not appropriate to use the standard technique of analysis of variance. To assess the health group homogeneity relative to orthostatic effect we used the Kruskal - Wallis test by ranks which made it possible to find out whether there were significant differences between medians in each of groups. It turned out that test statistics = 7,29 and p = 0 , 0261 < 0 , 05, so we had to admit the significant difference of orthostatic effect (Table 6) in different groups at 95 % reliability level. Moreover, the orthostatic effect level in the second group is significantly
Table 6
Kruskal - Wallis Test for Ort by Group
1.4. Skibinski’s Index
Adaptation parameters of cardiopulmonary system determined by Skibinski’s index (lung capacity, heart rate, timed inspiratory capacity) had low and average (10-30 units)
levels which is normal for people with low motor activity. Mean group values are shown in Table 7. Mean value for the second group differs from values of the first and the third groups: it is apparently lower. The results of analysis of variance (Table 8) show that
Table 7
Summary Statistics for Ind — Skib
Group Count Average St. dev Min Max
1 16 24Л 6T8 ПТ38,1
2 15 14,1 2,97 9,5220,0
3 15 25,0 7,32 11,632,6
Total 46 21,1 7,67 9,5238,1
this difference is significant, and the table of contrasts (Table 9) shows that the values of
ANOVA for Ind — Skib by Group
Table 8
|
Source Sum of Squares DE Mean Square F - ratio |
P - value |
|
Between groups 51,7 2 25,8 0,47 Within groups 2,37E3 43 51 |
0,6291 |
Total (Corr.)2,42E3 45
Skibinski’s index in the first and the third groups are statistically indistinguishable.
Table 9
Contrasts for Ind — Skib by Group (Sign * denotes a statistically significant difference)
Contrast Sig. Differ. ± Limits
П1 * 7^25G7
1 - 3 * 6,965,47
2 - 3 —0,4675,56
1.5. Other Parameters
2. Statistical Analysis of Physical Fitness
2.1. Sprint
2.2. Cross
The similar statistical analysis of other parameters including the results of arm strength dynamometry, stabilometry and ergospirometry showed that the individuals with abnormalities of different regions of vertebral column had cardiac abnormalities which required treatment, rehabilitation and prevention. Low levels of motor activity, presence of xenobiotics, unbalanced diet, excess CO 2 and environmental pollution cause disorders of homeostasis in students.
The influence of a certain health group affiliation on performance in 100-meter race was assessed on the basis of one-way ANOVA test (by health group) of the statistical data with preliminarily stated nice agreement with normal-theory test. Table 10 presents the summary statistics for groups (left), and Table 11 presents the results of analysis of variance.
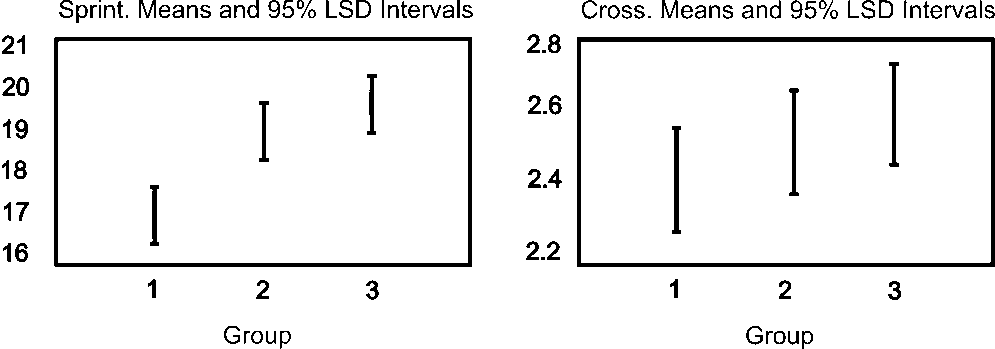
Fig. 2. Means plot for Sprint (left) and Cross (right)
Fig. 2 (left) shows the corresponding group means with 95 % confidence interval. As follows from Table 11, mean values of performance for 100-meter race in the second and the third groups are statistically indistinguishable, meanwhile the values of the first group are significantly different.
The results of the similar analysis of performance of different groups in 500-1000-meter cross-country running are presented in Tables 10 (right), 12 and in Fig. 2 (right).
As follows from Table 12, there are no significant ( p ~ 0 , 43 > 0 , 05) differences between health groups relative to cross-country running performance, though there is visually seen tendency to decrease in physical fitness level with the growth of the group number.
Summery stat for Sprint (left) and Cross (right)
|
Group |
Count |
Mean |
Std. dev. |
Var |
|
1 |
16 |
16,7 |
1,03 |
6,16 % |
|
2 |
15 |
19,0 |
1,96 |
10,3 % |
|
3 |
15 |
19,8 |
2,01 |
10,2 % |
|
Total |
46 |
18,5 |
2,16 |
11,7% |
Table 10
|
Mean |
Std. dev. |
Var |
|
2,38 |
0,429 |
18,0 % |
|
2,51 |
0,416 |
16,6 % |
|
2,59 |
0,495 |
19,1 % |
|
2,49 |
0,446 |
17,9 % |
Table 11
|
Source |
Sum of Squares |
DF |
Mean Square |
F - ratio |
P - value |
|
Between groups Within groups |
80,7 130 |
2 43 |
40,4 3,02 |
13,38 |
0,0000 |
|
Total (Corr.) |
210 |
45 |
Table 12
|
Source |
Sum of Squares |
DF |
Mean Square |
F - ratio |
P - value |
|
Between groups Within groups |
0,346 8,62 |
2 43 |
0,173 0,2 |
0,86 |
0,4289 |
|
Total (Corr.) |
8,96 |
45 |
ANOVA for Sprint by Group
ANOVA for Cross by Group
2.3. Models
The performed study allowed the modelling of performance in 100-meter race general for representatives of all health groups. After statistical analysis of significance of predictors, the following variables were determined as significant: heart rate reaction to orthostatic effect (Ort), general strength endurance parameter (pull-ups and sit-ups) (Podpress) and right arm strength dynamometry parameter (F-right). Regression model of 100-meter race performance was found as
Sprint = 29 , 5 - 0 , 122 · Ort - 0 , 0715 · P od press - 0 , 205 · F right .
The model predicts about 51% of Sprint parameter variability and indicates statistically significant influence of predictors on sprint performance as follows from ANOVA table (Table 13). Correlation between calculated (predicted by model) and observed values
ANOVA table for regression model
Table 13
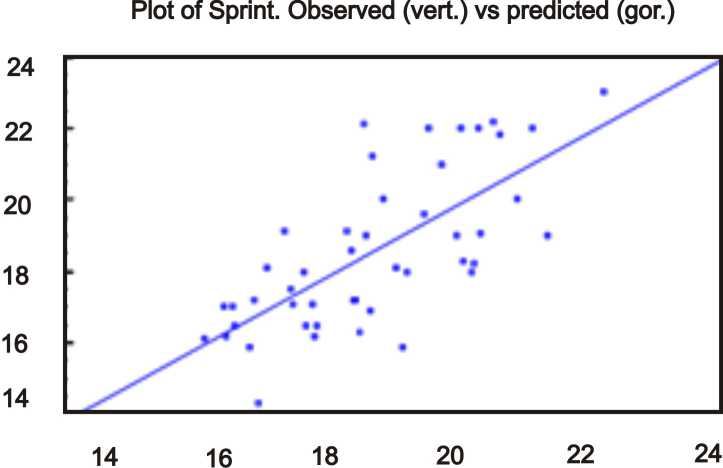
Fig. 3. Regresion line for Sprint
References Statistical analysis of the functional status of the students
- Гайнуллин, Р.А. Корреляционный, регрессионный анализ и возможности моделирования функционального состояния студентов/Р.А. Гайнуллин, А.П. Исаев, Н.В. Меньшикова//Теория и практика физической культуры. -2015. -№ 6. -С. 32-35.
- Янда, В. Функциональная диагностика мышц/В. Янда. -М.: Эксмо, 2010. -352 с.
- Handbook of Applicable Mathematics. Vol. VI: Statistics, Part B. -Dallas: John Wiley and Sons, 1984.
- Draper, N.R. Applied Regression Analysis/N.R. Draper, H. Smith. -N.-Y.: John Wiley and Sons, 1981.
