STEM-Focused Science Identity Questionnaire Based on the PISA 2025 Framework: Rasch Model Validation

Author: Siti Eneng Sururiyatul Mu'aziyah, Syech Zainal, Raya Agni, Supriyadi Supriyadi, Isnawati Isnawati
Journal: International Journal of Cognitive Research in Science, Engineering and Education @ijcrsee
Section: Original research
Article in issue: 3 vol.13, 2025.
Free access
This study developed and validated a Science Identity Questionnaire for secondary school students based on the PISA 2025 framework using a Rasch model analysis. The questionnaire aimed to measure key aspects of science identity, including science capital, attitude toward science, and environmental awareness. A total of 496 students (200 males and 269 females) from various Indonesian provinces participated. The data were analyzed using the Rasch model to examine item validity, reliability, and demographic bias. The results indicated that the questionnaire fit the Rasch model excellently, confirming its validity, with Outfit and Infit Mean Square values within acceptable ranges. Reliability analysis yielded person and item reliabilities of 0.72 and 0.99, respectively. No significant bias was detected between male and female students or between urban and rural respondents. These findings support using this tool to assess science identity and its role in promoting long-term STEM engagement. This instrument can inform interventions that aim to foster inclusive science education.
Science Identity, PISA 2025 Framework, Rasch Model, STEM
Short address: https://sciup.org/170211411
IDR: 170211411 | UDC: 159.947.5.075-057.874(594); 37:001.1(594) | DOI: 10.23947/2334-8496-2025-13-3-737-748
Text of the scientific article STEM-Focused Science Identity Questionnaire Based on the PISA 2025 Framework: Rasch Model Validation
A strong science identity is a critical driver of students’ engagement, motivation, and achievement in science ( Zhu and Luo, 2024 ; Belova et al., 2024 ). Students who perceive themselves as competent and recognized in science are more likely to persist in STEM pathways and pursue related careers ( Young et al., 2025 ; Lockhart et al., 2024 ). However, systemic inequities often limit this development, particularly among underrepresented groups such as females and students from low-income or rural backgrounds ( Rodriguez et al., 2024 ; Mahasneh et al., 2024 ). Addressing these disparities requires robust instruments capable of capturing science identity as a multidimensional construct that bridges personal background, affective engagement, and educational outcomes ( Latip, 2024 ).
Science identity is therefore a critical link between students’ personal backgrounds and their educational outcomes ( Young et al., 2025 ; Rodriguez et al., 2024 ). For previously underrepresented groups, science identity can help address systemic inequalities by establishing a sense of belonging to the science community and increasing their passion for achieving success in science ( Lockhart et al., 2024 ; Mahasneh et al., 2024 ). Educational programs that foster science identity, such as experiential learning, mentorship, and engagement in real research, have been shown to be effective in improving students’ academic processes and career goals ( Morell et al., 2025 ; Hsu and Frausto, 2024 ).
Science Identity and Educational Outcomes

-
© 2025 by the authors. This article is an open access article distributed under the terms and conditions of the Creative Commons Attribution (CC BY) license ( https://creativecommons.org/licenses/by/4.0/ ).
identity demonstrate higher levels of engagement and confidence in science subjects, which translates into improved academic performance and a deeper conceptual understanding of scientific principles ( Zhu and Luo, 2024 ; Morell et al., 2025 ). This connection is particularly important for fostering persistence in Science, Technology, Engineering, and Mathematics (STEM) fields, as students who see themselves as capable science learners are more likely to pursue advanced studies and careers in science-related domains ( Belova et al., 2024 ; Young et al., 2025 ).
Therefore, science identity serves as a critical mediator between students’ personal backgrounds and their educational outcomes ( Young et al., 2025 ; Rodriguez et al., 2024 ). In the case of historically underrepresented groups, science identity can help mitigate the impact of systemic inequities by strengthening their sense of belonging within scientific communities and enhancing their motivation to excel in STEM fields Lockhart et al., 2024 ; Mahasneh et al., 2024 ). Educational interventions that focus on enhancing science identity through experiential learning, mentorship, and authentic research opportunities have been shown to significantly improve students’ academic trajectories and career intentions ( Morell et al., 2025 ; Hsu and Frausto, 2024 ).
Science Identity in The PISA 2025 Framework
The Programme for International Student Assessment (PISA) plays a vital role in evaluating students’ scientific literacy on a global scale ( Latip, 2024 ). The PISA 2025 framework introduces a transformative approach by integrating science identity as a key component of scientific literacy, reflecting a broader understanding of what it means to be scientifically literate ( Latip, 2024 ). The framework recognizes the importance of students’ identities, values, and emotional connections to science ( Deta et al., 2024 ).
This shift aligns with current educational trends that prioritize holistic learning outcomes ( Sadler and Zeidler, 2009 ). Embedding science identity within the assessment criteria, PISA 2025 aims to evaluate not only students’ knowledge and skills but also their engagement with socio scientific issues (SSI), environmental awareness, and their capacity to apply scientific reasoning in complex real-world contexts ( Deta et al., 2024 ). This comprehensive approach is designed to foster a deeper connection between students and science, encouraging them to view themselves as active participants in scientific inquiry and decision-making ( Latip, 2024 ).
The focus on science identity in PISA 2025 also reflects the growing consensus that students’ affective engagement with science plays a critical role in their long-term STEM participation ( Rodriguez et al., 2024 ; Mahasneh et al., 2024 ). Evaluating how students perceive their role in the scientific community and their ability to contribute to societal challenges, PISA 2025 seeks to promote lifelong engagement with science and enhance the inclusivity of STEM education ( Latip, 2024 ; Young et al., 2025 ).
Developing a Science Identity Questionnaire Using The Rasch Model
Despite the increasing recognition of science identity as a crucial factor in STEM education, there remains a lack of robust instruments for measuring this construct ( Mahasneh et al., 2024 ; Morell et al., 2025 ). Existing tools often rely on traditional psychometric methods, such as factor analysis, which may not fully capture the dynamic and multidimensional nature of science identity ( Bhatti et al., 2023 ; Rodriguez et al., 2024 ). Ensuring the psychometric soundness of measurement instruments, including validity and reliability, is a critical step in educational research ( Sawitri et al., 2024 ). Addressing this gap, this study leverages the Rasch model, a psychometric framework within Item Response Theory (IRT), in developing a Science Identity Questionnaire that aligns with the PISA 2025 framework ( Bhatti et al., 2023 ; Latip, 2024 ).
The Rasch model offers several advantages for science identity measurement. It provides detailed item-level analyses, ensuring unidimensionality and enabling the development of instruments that yield reliable, objective, and cross-comparable results ( Oktavianti and Aini, 2024 ; Bhatti et al., 2023 ). Measuring individuals’ perceptions and responses is essential for understanding their engagement and identity within a specific context. Previous studies have highlighted how individual threat appraisals or perceptions can influence behavior and engagement ( Sari and Adiati, 2023 ), providing useful insights for assessing science identity. This model has been successfully applied in educational contexts to assess constructs such as scientific literacy, career identity, and science process skills, demonstrating its versatility and effectiveness ( Budi et al., 2024 ; Sunni et al., 2024 ).
Adapting the Rasch model to measure science identity, the study aims to capture key dimensions of the construct, including students’ perceptions of competence, recognition, and belonging in science (Lockhart et al., 2024; Young et al., 2025). The approach is expected to provide a more nuanced understanding of how science identity develops across diverse educational contexts and demographic groups (Rodriguez et al., 2023; Mahasneh et al., 2024).
Furthermore, the study aims to develop and validate a Science Identity Questionnaire for middle school students based on the PISA 2025 framework, using Rasch model-based validation and reliability analysis. Providing a robust measurement tool, the research seeks to enhance understanding of science identity and its role in shaping students’ academic and career outcomes ( Mahasneh et al., 2024 ; Young et al., 2025 ). Additionally, integrating the PISA 2025 framework, which emphasizes affective engagement, environmental awareness, and global competence, could contribute to a more holistic understanding of scientific literacy and its broader societal implications. Ultimately, the study aims to inform educational practices and policies that promote equitable and inclusive STEM education, thereby supporting the development of a diverse and capable STEM workforce ( Latip, 2024 ; Mahasneh et al., 2024 ; Young et al., 2025 ).
Materials and Methods
The research instrument employed was a questionnaire developed based on the PISA 2025 framework. The questionnaire was designed to explore various aspects of students’ science identity, encompassing three primary constructs: Science Capital, Attitudes Toward Science, and Environment. The instrument consists of 20 statements addressing epistemic beliefs, science capital, self-concept, self-efficacy, enjoyment of science, instrumental motivation, environmental awareness, environmental concern, and environmental agency. These statements were designed using a 4-point Likert scale: 1 (Strongly Disagree), 2 (Disagree), 3 (Agree), and 4 (Strongly Agree), excluding a neutral option to elicit clearer responses from students. The questionnaire items, along with their respective indicators, are presented in Table 1.
Table 1 . Questionnaire statements based on the PISA 2025 framework
|
Construct |
Aspect |
Statement |
|
Science Capital |
Epistemic Beliefs Access to Resources Involvement in Science Activities |
I believe that science is an effective way to understand the world. ( A1 ) Scientific methods rarely provide real solutions to important problems. ( A2 ) I have access to sufficient science resources (such as books, laboratories, internet) to learn more about science. ( A3 ) I find it difficult to understand some scientific concepts. ( A4 ) I often engage in scientific activities outside of school. ( A5 ) I often discuss science with friends or family. ( A6 ) |
|
Attitude |
Science Self-Concept Self-Efficacy in Science Enjoyment of Science Instrumental Motivation |
I feel I am good at learning science. ( B1 )
Q9) I feel uncertain about my ability in science. ( B4 ) Q10) I get bored when studying science topics in school. ( B5 ) I enjoy conducting scientific experiments. ( B6 ) I study science because I think it is important for my future. ( B7 ) I am unsure how knowledge of science will be useful for my career. ( B8 ) |
|
Environment |
Environmental Awareness Environmental Concern Environmental Agency |
I understand the importance of preserving the environment for our future. ( C1 ) I feel that environmental issues are often exaggerated. ( C2 ) I care about the impact of human activities on the environment. ( C3 ) I don’t think I need to contribute to environmental conservation. ( C4 ) I am actively involved in activities aimed at protecting the environment. ( C5 ) I am not sure I can make a significant impact on environmental conservation. ( C6 ) |
The questionnaire was verified by three experts to ensure that the structure and preparation of the instrument were organized systematically and logically, the content of the questionnaire was in accordance with the concept of scientific identity, and the language used was appropriate, easy to understand, and in accordance with the ability level of junior high school students. The three experts stated that the questionnaire was valid and reliable.
After that, the questionnaire that had been validated by experts was then disseminated to junior high school students throughout Indonesia through Google Form. The researcher distributed the Google Form link via email and WhatsApp messages to junior high school science teachers to distribute to students. So that every student gets the opportunity to become a sample in this study.
Participants
This study involved 469 junior high school students, including 200 males and 269 females. Of those students, 142 lived in urban areas, while 327 lived in rural areas. The students’ ages ranged from 11 to 15 years old, in accordance with the target age range of the PISA 2025 framework. The students who completed the questionnaire were from several provinces: Banten, Jakarta, West Java, Central Java, East Java, East Kalimantan, West Sulawesi, Central Sulawesi, South Sulawesi, and West Sumatra.
Data Analysis Using The Rasch Model
The Rasch Model is a powerful tool for evaluating the validity and reliability of educational and psychological instruments. It provides a detailed analysis of item fit statistics, which are crucial for assessing how well items align with the model’s expectations. This approach is particularly useful in educational settings, where it can help ensure that test items accurately measure the intended constructs, such as mathematical creative thinking or self-efficacy. The Rasch Model’s ability to identify misfit items and persons enhances the precision of the instrument, making it a preferred choice for researchers aiming to develop robust assessment tools. Data analysis for Rasch model calibration and item fit statistics was conducted using WINSTEPS Version 5.7.1.0, which is specifically designed for item response theory (IRT) analysis and provides in-depth insights into item and person fit.
Instrument Validity and Item Fit Statistics
-
• Item Fit Statistics: The Rasch Model evaluates item fit using statistics such as Outfit Mean Square (MNSQ), and Outfit Z-standard (ZSTD). These statistics help determine whether each item on a test fits the expected model. For instance, items with MNSQ values between 0.5 and 1.5 and ZSTD values within the range of -2 to +2 are typically considered to demonstrate good fit ( Soeharto, 2021 ).
-
• Misfit Identification: The Rasch Model can identify items or persons that do not fit the model, providing insights into potential biases or inconsistencies. Misfit items or respondents may indicate areas where the test could be improved, such as revising ambiguous items or addressing unintended interpretations ( Fischer et al., 2021 ).
Reliability Testing
-
• Reliability Scores : The Rasch Model provides reliability scores for both items and persons, which indicate the consistency of the instrument. Person reliability reflects the consistency of respondents’ answers, while item reliability assesses the stability of item difficulty across different samples. Reliability scores range from 0 to 1, with values above 0.80 generally considered high, indicating excellent reliability, values between 0.70 and 0.80 considered acceptable, and values below 0.70 indicating lower reliability ( Qudratuddarsi et al., 2022 ; Soeharto, 2021 ).
-
• Cronbach’s Alpha: This statistic is often used alongside the Rasch Model to assess internal consistency. High Cronbach’s Alpha values, typically above 0.70, indicate that the items on the test reliably measure the same underlying construct. Studies on self-concept and self-acceptance have reported high Cronbach’s Alpha values, further supporting the reliability of these instruments when used in conjunction with Rasch analysis ( Latifah et al., 2024 ; Gunawan et al., 2023 ).
Results
Validity Analysis
Based on the results from the Rasch model analysis presented in Table 2, several important parameters were assessed to confirm the validity and fit of the instrument. The Outfit MNSQ values for both person and item are 1.05, respectively, which fall within the acceptable range of 0.5 to 1.5. These values indicate that the instrument fits the Rasch model well, suggesting that the items and respondents align with the model’s expectations. Additionally, the Infit MNSQ values for person (1.03) and item (1.00) also fall within this range, further confirming that there is no significant misfit in how the instrument measures respondents’ abilities and item difficulty.
The Outfit ZSTD values for both person and item are -0.3 and 0.7, meanwhile the Infit ZSTD values for person and item are -0.4 and -0.1, respectively, which are acceptable, indicating no substantial misfit in the model’s application to both persons and items.
The instrument can achieve unidimensionality if the raw variance explained by the measure exceeds 30% ( Soeharto, 2021 ; Chou and Wang, 2010 ; Linacre, 1998). The analysis confirmed that the instrument surpassed this minimum threshold, with a raw variance explained by the measure of 35.8%. This indicates that the instrument effectively explains a significant portion of the variance in the data, demonstrating its ability to measure the intended construct.
Table 2. Summary of validity indices for person and item measures
|
Person |
Item |
|
|
Number |
469 |
20 |
|
Mean |
53.6 |
1257.6 |
|
SD |
6.3 |
237.5 |
|
Outfit MNSQ |
1.05 |
1.05 |
|
Infit MNSQ |
1.03 |
1.00 |
|
Outfit ZSTD |
-0.3 |
0.7 |
|
Infit ZSTD |
-0.4 |
-0.1 |
|
Raw variance by measure: |
35.8% |
Reliability Analysis
The reliability of the instrument was assessed using various metrics, as shown in Table 3, including person reliability, item reliability, and Cronbach’s Alpha (α). These values were generated using WINSTEPS software. The person reliability is 0.72, which is within the acceptable range for Rasch analysis (values above 0.70 are typically considered acceptable). This indicates that the instrument is effective in differentiating between respondents with varying abilities. The item reliability is exceptionally high at 0.99, demonstrating excellent consistency in measuring item difficulty across the sample.
The Cronbach’s Alpha for the test is 0.66, which is adequate but could be improved for better internal consistency. This value indicates that the test items generally measure the same underlying construct, though it may benefit from slight improvements in internal consistency to ensure stronger coherence among items.
The person separation index is 1.60, which is above the minimum threshold of 1.4, indicating that the instrument is able to distinguish between different levels of science identity among respondents. While this value is acceptable, an ideal separation index is closer to 2.0, suggesting that there is still room for improvement in separating respondents at the extreme ends of the ability spectrum.
The item separation index is 12.81, which is high, indicating that the items are well spread across different difficulty levels, effectively differentiating between the various levels of science identity. A higher separation value suggests that the instrument is well-designed to measure different levels of the construct.
Although the Cronbach’s Alpha coefficient (0.66) is slightly below the conventional threshold of 0.70, this level remains acceptable for exploratory validation studies, particularly in multidimensional constructs such as science identity ( Tavakol and Dennick, 2011 ). The multidimensionality of this question-naire—which captures aspects of epistemic beliefs, self-efficacy, and environmental engagement—can naturally lower inter-item homogeneity without compromising construct validity. Future revisions will consider expanding and refining items in the self-concept and recognition sub-dimensions to further enhance internal consistency and content balance across domains.
Table 3. Summary of reliability indices for person and item measures
|
Person |
Item |
|
|
Reliability |
0.72 |
0.99 |
|
Separation |
1.60 |
12.81 |
|
Cronbach’s Alpha |
0.66 |
Person-Item Map
The Wright Map visually represents the relationship between respondents’ abilities and item difficulty, according to the Rasch model ( Soeharto and Csapo, 2022 ). On the left side of the map (Figure 1), person measures range from -3 to 5, illustrating the diverse ability levels of the respondents. Individuals with lower abilities are represented by negative values (-3, -2 and -1), indicating that they find most items difficult. Those around 0 have moderate abilities, while respondents with higher abilities, marked by positive values (from 1 to 5), are more likely to answer difficult items correctly. The majority of respondents are concentrated around the 0 mark, suggesting that most participants have moderate abilities, with fewer respondents at the extremes of the ability scale.
MEASURE
PERSON - MAP - ITEM
+
Figure 1. Person-item distribution in science identity measurement
On the right side of the map (Figure 1), item measures also span from -3 to 5. Items with negative values (-3, -2, and -1) are very difficult and are typically answered only by high-ability respondents. Items with values near 0 represent moderate difficulty, and those with positive values (from 1 to 5) are easier, often answered correctly by respondents with moderate abilities. This distribution of item difficulty ensures that the instrument captures a wide range of respondent abilities, from easy to difficult.
The vertical alignment of items in the Wright Map (Figure 1) further highlights that each item targets different aspects of science identity, with varying levels of difficulty. This design ensures that the instrument assesses a broad spectrum of abilities and provides a comprehensive measure of respondents’ science identity engagement and capabilities.
Item Bias Based on Differential Item Functioning (DIF)DIF According to Gender
A DIF analysis was conducted in this study to evaluate potential item bias between male and female respondents across all ability levels ( Soeharto, 2021 ). DIF analysis compares participant responses based on gender for each item in the test, highlighting any differences in item difficulty ( Khine, 2020 ). DIF is assessed using two criteria: statistical significance (p < 0.05) and DIF size, which is categorized as negligible, slight to moderate (|DIF| ≥ 0.43 logits), and moderate to large (|DIF| ≥ 0.64 logits) ( Zwick et al., 1999 ).
Based on the DIF analysis, none of the items showed significant or moderate-to-large DIF. All items had DIF sizes below 0.43 logits, suggesting that there were no substantial differences in difficulty between male and female respondents (Figure 2). Therefore, no significant gender bias was detected, and the test can be considered fair for both male and female respondents, ensuring equal opportunities for both genders to perform well on the test.
This aligns with the broader discourse on minimizing gender bias in educational and psychological assessments. Addressing gender-based disparities and biases is critical for promoting equality and inclusivity ( Huda et al., 2024 ). Ensuring that the Science Identity Questionnaire does not exhibit significant DIF based on gender strengthens its contribution to the development of unbiased educational tools that reflect students’ abilities, engagement, and science identity without being influenced by demographic factors such as gender.
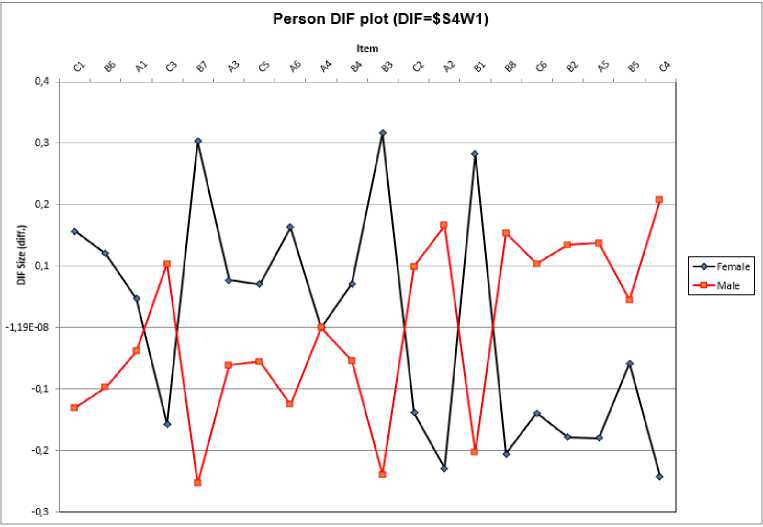
Figure 2. DIF based on gender
DIF According to Area
The results of the DIF analysis based on area (rural vs. urban) indicated that none of the items in the test displayed a significant DIF with a value ≥ 0.43 logits. This suggests that all the items fall within the
“negligible” DIF category, meaning the items did not exhibit substantial differences in difficulty between rural and urban respondents. As shown in Figure 3, the DIF sizes for all items are below 0.43 logits, confirming that there is no meaningful bias in how the test items function across the two areas. Therefore, the test appears to be fair and unbiased for respondents from both rural and urban areas, with no need for further adjustments based on geographical differences.
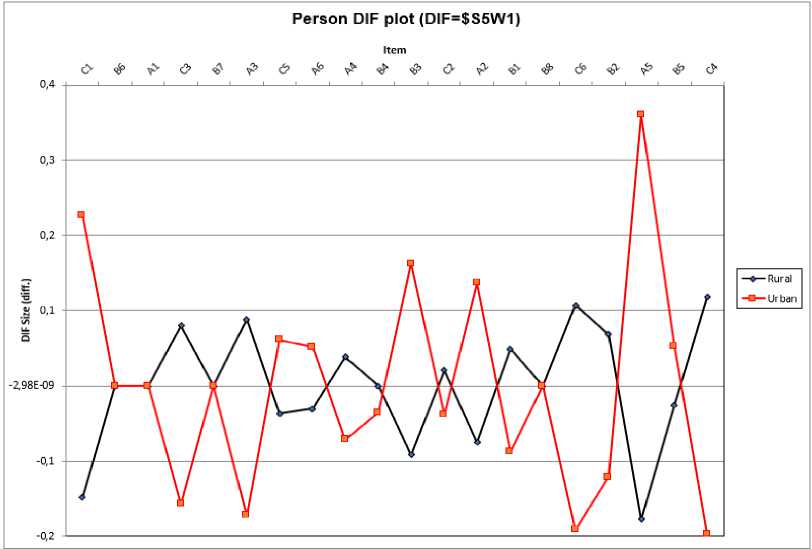
Figure 3. DIF based on area
Discussions
Summary of Main Findings
This study aimed to develop and validate the Science Identity Questionnaire based on the PISA 2025 framework, employing the Rasch model to measure students’ science identity. The questionnaire was designed to capture three primary constructs: Science Capital, Attitudes Toward Science, and Environmental Awareness. The key findings derived from the analysis can be summarized as follows:
-
1. Instrument Validity and Model Fit: The item-fit analysis demonstrated that all questionnaire items fell within the acceptable range, indicating a good fit with the Rasch model ( Soeharto, 2021 ). Specifically, the Outfit Mean Square (MNSQ) values for items and respondents were within the optimal range of 0.5 to 1.5, confirming that the instrument effectively differentiates students based on varying levels of science identity. This finding aligns with previous research that underscores the importance of developing psychometrically sound instruments for assessing multidimensional constructs like science identity ( Mahasneh et al., 2024 ; Rodriguez et al., 2024 ). By employing the Rasch model, this study contributes to the growing body of evidence demonstrating that Rasch-based instruments provide reliable and nuanced measurements of complex psychological constructs, including selfefficacy, epistemic beliefs, and science engagement ( Bhatti et al., 2023 ).
-
2. Reliability and Internal Consistency: The reliability analysis indicated that the instrument was robust, with person reliability of 0.72 and item reliability of 0.99. Although the Cronbach’s Alpha value was 0.66, which is slightly below the ideal threshold of 0.70, it still reflects acceptable internal consistency. This suggests that while the test items measure related aspects of science identity, there is some room for improvement in enhancing item coherence. Several studies have highlighted that increasing the number of items measuring specific dimensions of identity, such as recognition and competence, could potentially enhance Cronbach’s Alpha by improving internal consistency ( Mahasneh et al., 2024 ;
-
3. Differential Item Functioning (DIF): The DIF analysis revealed no significant bias between male and female respondents or between students from urban and rural areas. This indicates that the questionnaire functions fairly and without bias across different demographic groups, making it an inclusive tool for assessing science identity. This finding contrasts with prior research that identified gender-based differences in science identity, particularly the tendency for female students to report lower self-efficacy and interest in STEM-related fields ( Rodriguez et al., 2024 ; Lockhart et al., 2024 ). The absence of significant DIF in this study suggests that the instrument effectively captures science identity in a way that minimizes potential biases related to gender or geographic background. This is a critical consideration for promoting diversity and inclusion in STEM education, as it supports the development of equitable assessment tools that provide an accurate picture of students’ engagement and potential across diverse contexts.
Gunawan et al., 2023 ). Future refinements may involve expanding items related to key subdimensions of science identity, particularly those that may exhibit greater variability among respondents. The moderate internal consistency observed (α = 0.66) reflects the multidimensional nature of science identity, which integrates affective, cognitive, and contextual dimensions. In Rasch measurement theory, such variation does not necessarily indicate a weakness but rather supports construct coverage across diverse subdomains ( Bhatti et al., 2023 ). Moreover, the alignment between the acceptable person reliability (0.72) and very high item reliability (0.99) suggests that the questionnaire’s precision in estimating item difficulty is excellent, although respondent differentiation could still be optimized ( Soeharto, 2021 ). These reliability indicators collectively affirm that the instrument is psychometrically robust, yet flexible enough for further refinement across cross-cultural and educational contexts.
Implications for Educational Practice
The findings have important implications for educational practice and the measurement of science identity. The focus on science capital, attitudes toward science, and environmental awareness aligns closely with the PISA 2025 framework’s emphasis on holistic scientific literacy ( Latip, 2024 ). Addressing these dimensions allows the Science Identity Questionnaire to provide valuable insights that can guide the development of targeted interventions aimed at strengthening science identity, particularly for underrepresented groups such as female students and those from rural areas. Research has also highlighted the importance of designing contextualized assessment tools that embed test items in real-life situations, which can enhance both the validity and applicability of the instrument ( Constantinou, 2024 ). Applying these principles in the Science Identity Questionnaire could improve its ability to capture students’ perceptions and engagement with science, thereby contributing to a more comprehensive understanding of how science identity develops in diverse educational contexts.
Furthermore, the emphasis on epistemic beliefs, self-efficacy, and environmental awareness underscores the multidimensional nature of science identity, which has been linked to long-term STEM engagement and career aspirations ( Mahasneh et al., 2024 ; Young et al., 2025 ). These dimensions are crucial for fostering students’ confidence, sense of belonging, and motivation in STEM fields, thereby contributing to more equitable and inclusive STEM education. Capturing this multidimensionality requires an understanding of the potential heterogeneity among students, as different groups may engage with science in diverse ways. This aligns with findings from mixed Rasch model applications in educational research, where distinct respondent classes have been identified based on variations in cognitive strategies or test-taking behavior, providing deeper insights into latent traits and engagement patterns ( Baghaei and Carstensen, 2013 ).
Given its alignment with the global PISA 2025 science framework, the Science Identity Questionnaire possesses strong potential for international use. Its multidimensional structure enables adaptation across different cultural and linguistic contexts while maintaining psychometric rigor. Cross-cultural validation could reveal how socio-cultural values influence students’ recognition and belonging in science, supporting international benchmarking of science identity ( Liu et al., 2023 ; Potgieter et al., 2022 ). Such cross-contextual insights would help refine educational policies and contribute to the global discourse on equitable STEM participation.
Limitations and Directions for Future Research
Although the Science Identity Questionnaire demonstrated strong validity and reliability, some limitations must be acknowledged. First, the Cronbach’s Alpha value indicates that there is potential to improve the internal consistency of the questionnaire. Future studies could explore additional refinements to the items to enhance coherence and strengthen the instrument’s psychometric properties. While this study primarily focused on the psychometric properties of the Science Identity Questionnaire using the Rasch model, future research could explore students’ test-taking effort as an additional factor influencing response quality. Analyzing response time and the number of actions taken could provide deeper insights into student engagement and its impact on the validity of questionnaire data ( Ivanova and Michaelides, 2023 ). Additionally, advanced response pattern detection methods could be considered in future studies to identify repetitive response patterns and improve data quality and validity ( Gottfried et al., 2022 ).
Furthermore, this study focused on middle school students within the context of the PISA 2025 framework. Extending the research to other educational levels and international contexts could provide a broader understanding of how science identity develops across diverse populations and educational systems ( Latip, 2024 ). Longitudinal studies could also explore the long-term impact of science identity on students’ academic trajectories and career outcomes in STEM fields.
Conclusions
The Science Identity Questionnaire developed and validated in this study has proven to be a reliable and valid tool for measuring science identity in middle school students, based on the PISA 2025 framework. The Rasch model analysis confirmed that the instrument effectively differentiates students with varying levels of science identity, with strong item and person reliability, though minor refinements could enhance its internal consistency. Additionally, the absence of significant Differential Item Functioning (DIF) across gender and geographic background indicates that the questionnaire functions equitably, making it an inclusive tool for diverse populations. These findings highlight the instrument’s potential for providing nuanced insights into students’ engagement, self-efficacy, and sense of belonging in science, essential factors for fostering long-term STEM participation. Ultimately, the questionnaire aligns with global educational goals by integrating affective dimensions such as environmental awareness and epistemic beliefs, offering valuable applications in educational assessment, intervention, and policy development aimed at promoting diversity and inclusivity in STEM fields. Beyond its national context, this study offers a foundation for future comparative research across ASEAN and OECD countries, where science identity serves as a core indicator for inclusive STEM education. By combining psychometric precision with global relevance, the Science Identity Questionnaire can serve as a reference instrument for international educational assessment aligned with PISA 2025 goals.
Acknowledgements
Thanks go to the Directorate of Research and Community Service (DPPM), the Ministry of Higher Education, Science, and Technology of Indonesia, for fully funding this research. We would also like to thank the Institute for Research and Community Service (LPPM) of Tadulako University for assisting in the implementation of this research.
Funding
This work was supported by the Ministry of Higher Education, Science, and Technology of Indonesia (grant number 114/C3/DT.05.00/PL/2025)
Conflict of interests
The authors declare no conflict of interest.
Data availability statement
The original contributions presented in the study are included in the article/supplementary material, further inquiries can be directed to the corresponding author.
Institutional Review Board Statement
This study was conducted in strict accordance with the ethical standards of research involving human participants and in line with the principles of the Declaration of Helsinki. The research protocol was reviewed and approved by the Institutional Review Board (IRB) / Ethics Committee of [University of Trunojoyo Madura] (Approval Number: [B/9895/UN46.4.1/PT.01.04/2025], Date of Approval: [November 9th, 2025]).
Author Contributions
Conceptualization, S.E.S.M., S.Z., and R.A.; methodology, S.E.S.M.; software, I.I..; formal analysis, S.E.S.M. and S.S.; investigation, S.E.S.M, S.Z., R.A., and I.I; writing original draft preparation, S.E.S.M. and S.Z.; writing review and editing, S.S. and R.A. All authors have read and agreed to the published version of the manuscript.
