Study of saving and investment pattern on sample farms households

Author: Singh Manoj, Singh Radhey Shyam, Singh Krishna Pratap
Journal: Овощи России @vegetables
Section: Экономика и организация сельскохозяйственного производства
Article in issue: 6 (62), 2021.
Free access
The saving and investment pattern of different forms sample group was studied during 2014-16 and it was observed that large farm holders were able to save higher income than small farmers while lowest income group had negative savings. In respect of investment on different fixed assets, irrigation was on first priority, followed by purchase of milch animals, farms buildings and investment in land and its improvement. Investment on working capital amongst different cash inputs, hired human labourer accounted highest share (29.44 per cent), followed by manure & fertilizers (22.33 per cent), hired power tractor (16.96 per cent), irrigation (13.61 per cent) and seeds (13.50 per cent) to total cash inputs. Marginal farmers could not invest for nonfarm physical capital because of no savings with them. Small and large farmers groups invested in all the items in which it was highest in working capital (61.28 to 61.84 per cent), followed by investment in fixed capital (14.41 to 16.84 per cent), financial capital (12-14 per cent) and non-farm capital (7-12 per cent). The highest investment was made on working capital (69.02 per cent) by sample farmers. Current income was found to be the main source of finance in all income groups which accounted for 49.70 to 94.79 per cent share of the total investment followed by savings which shared for 40.10 to 49.12 per cent in total investment.
Saving, investment, income, sample forms
Short address: https://sciup.org/140261756
IDR: 140261756 | DOI: 10.18619/2072-9146-2021-6-10-15
Изучение структуры сбережений и инвестиций на примере выборочных фермерских хозяйств
Структура сбережений и инвестиций в различных группах выборки изучали в течение 2014-2016 годов. Было замечено, что крупные фермерские хозяйства смогли сэкономить более высокий доход, чем мелкие фермеры, в то время как группа с самым низким доходом имела отрицательные сбережения. Что касается инвестиций в различные основные фонды, первоочередной задачей было орошение, за которым последовали покупка дойного скота, хозяйственных построек и инвестиции в землю и ее улучшение. Инвестиции в оборотный капитал среди различных денежных затрат, наемный рабочий составлял наибольшую долю (29,44%), за ним следовали навоз и удобрения (22,33 процента), наемный трактор (16,96%), ирригация (13,61%) и семена (13,50%) к общему количеству денежных вложений. Маржинальные фермеры не могли вкладывать средства в физический капитал, не связанный с сельским хозяйством, из-за отсутствия у них сбережений. Группы мелких и крупных фермеров инвестировали во все статьи, по которым они были самыми высокими, в оборотный капитал (от 61,28 до 61,84%), за которыми следовали инвестиции в основной капитал (от 14,41 до 16,84%), финансовый капитал (12-14%) и несельскохозяйственный капитал (7-12%). Наибольшие инвестиции в оборотный капитал (69,02%) были вложены фермерами из выборки. Текущий доход оказался основным источником финансирования во всех доходных группах, на долю которых приходилось от 49,70 до 94,79% от общего объема инвестиций, за которыми следовали сбережения, на которые приходилось от 40,10 до 49,12% от общего объема инвестиций.
Text of the scientific article Study of saving and investment pattern on sample farms households
A griculture contributes about 17 per cent of the national income in the Indian economy and more than 70 per cent ruralhouseholdsdependonagriculture. In this respect income, saving and investment have been regarded as main variables of economic development. Increase in capital stock along with its efficiency directly influences the productive capacity of economy for increasing total income. However, this growth in capital is in turn directly dependent on the part of additional output which is not immediately consumed but is saved and is available for investment in capital. This important role of saving is a determinant factor of growth in income and economic development. Even the Keynsian consumption function which brought a revolution in the theory of employment is intimately linked to what he called, 'propensity to save'.
From the neo-classical economists, “saving is an excess of income overnecessary expenditure”.According to J.S.Mill,“saving enriches and spending impoverishes the community along with the individual”. Alfred Marshall said, “The power to save depends on an excess of income over necessary expenditure and that a rise in the rate of interest offered for capital. Thus income, saving and investment constituted the three strategic determinants of economic development in the classical, neo-classical and Keynesian system.
Progressiveness of agriculture will, however, depend upon what farmersdowith theadditional income generated from their savings. Growth rate in the farm economy largely depends on the stock of capital built and plans of saving for further improvement. If increase in farm income, it is mostly utilized for increasing capital investment in farm organization, the growth rate in agriculture sector would be higher. If the increasing capital investmentsare spentonhousehold expenditure without building up the necessary infrastructure, the economic development of agriculture might be hampered. Thus saving and investment in agriculture has assumed great significance in view of the Government's policy wherein it is clearly stated that investment in agriculture would receive highest priority in the economic development of the country side by side farmers would be motivated to increase production and make such adjustment in their investment pattern as to meet fully consumer's demand.
District Azamgarh of Eastern Uttar Pradesh, India has an important place in terms of fertility and agricultural advancement (Figure 1).Out of total cultivated area of the district, 74.20 per cent is under irrigation having 157.94 per cent cropping intensity. Thus, keeping in view the importance of saving and investment pattern in agricultural economy of the country, state and study area, present study was planned. The findings of the study would be of great significance to the policymakers, administrators, economists and extension workers for making development plans for the improvement of agricultural sector in the study area.
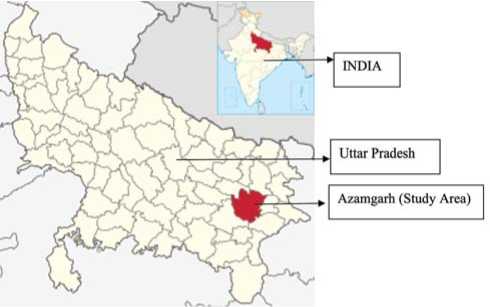
Figure 1.Study areahighlighted.
Materials and Methods:
-
1 .Sampling Technique:
-
2 .Method ofEnquiry and CollectionofData:
A multistage stratified random sampling technique was used to select the blocks, villages and sample farms. Out of 22 Blocks, 02 namely Koelsa and Mohamadpur were selected randomly. The list of all villages of the selected blocks was obtained from Lekhpal and Village D evelopment Officer. Respondents were grouped under four categories namely, below 1 hectare (marginal), 1-2 hectare (medium), and more than 2 hectare (large). Sample of 100 farmers were drawn from the 10 villages (50 farmers from each block).
Results and Discussion
It is evident from Table 1 that marginal farm households groups were having no savings with them because of higher family consumption expenditure than total income. The main constraints to the small holder farmers’ inability to save are inadequacy of income and fearof lossof their income[1;2]. In caseof smalland large farm households, the savings level was of ₹ 21219.79(318.81 US $) and ₹ 117047.89 (1758.53 US $) per household respectively. Thus, it is observed that farmersof large farmholdingswereable to savehigh-er income in comparison to small farmers.This trendwasdue to the fact that marginal propensity to consume goes on decreasing with increase in incomes of farm families. Therefore, percentage of total income consumed decreases with the increase in farm size, resulting in comparatively higher savings on large farms.
Table 2 reveals that sample households of lowest income group had negative savings ₹ -2193.80 per farmhousehold (32.96 US $)]. However, savings gave an increasing trend with increase in size of income groups. It was ₹ 25239.47 (379.20 US $) on medium and ₹ 141980.15(2133.12 US $) per household on large income groups.
InvestmentPattern ofSample Farms
InvestmentonFixed Capital
Table 1. Level of saving on sample farm households in ₹ per household
|
Particulars |
Size Group (in hectare) |
Average |
||
|
Below 1 Hectare |
1-2 Hectare |
2 hectare & above |
||
|
1. Total Income |
||||
|
Average (₹) (In US $) |
31750.42 477.02 |
63865.30 959.52 |
173551.31 2607.44 |
57249.80 860.12 |
|
2. Total family consumption expenditure |
||||
|
Average (₹) (In US $) |
31827.75 478.18 |
42645.51 640.71 |
56503.42 848.91 |
37415.42 562.13 |
|
3. Savings |
||||
|
Average (₹) (In US $) |
(-) 77.33 1.16 |
21219.79 318.81 |
117047.89 1758.53 |
19834.39 297.99 |
|
4. Percentage of savings to income |
||||
|
- 0.24 |
33.22 |
67.44 |
34.64 |
|
(US $ as on April 14, 2016; 1 US $ = 66.56 ₹)
Table 2. Level of savings according to income groups ₹ Per household
|
Particulars |
Income Group (in₹) |
Average |
||
|
Below ₹ 25,000 (375.6 US $) |
₹ 25000- 50000 (375.6 – 751.20 US $) |
₹ 50000 & above (751.20 US $) |
||
|
1. Total income per household |
||||
|
Average (₹) (In US $) |
31534.05 473.77 |
66179.44 994.28 |
192833.02 2897.13 |
63350.89 951.79 |
|
2. Total family consumption expenditure |
||||
|
Average (₹) (In US $) |
33727.85 506.73 |
40939.97 615.08 |
50852.86 764.02 |
38189.81 573.77 |
|
3. Savings per household |
||||
|
Average (₹) (In US $) |
(-) 2193.80 32.96 |
25239.47 379.20 |
141980.15 2133.12 |
25161.08 378.02 |
|
4. Percentage of saving to income |
||||
|
(-) 6.96 |
38.14 |
73.62 |
42.39 |
|
(US $ as on April 14, 2016; 1 US $ = 66.56 ₹)
Investmentin Working Capital
Investmentin Non-farm capital
It is evident from the Table 5 that marginal farmers could not invest for non-farm physical capital because of no savings with them. Maximum investment by small farmers and large farmers group was made on vehicle items, followed by television radio etc. because these farmers were able to spend their surplus savings.
Financial Investment
Financial investment made by sample farmers consisted of investment in National Saving Certificate (NSC), Kisan Vikas Patra, Life Insurance Corporation Policies, deposits in commercial banks and post offices, etc. and in the form of ornaments, besides repay-mentof loans. Personal sources of information plays greater roleas compared to official sources in bringing awareness regarding institutional investments [7].
Table 6 reveals that on overall basis, the sample farmers made a financial investmentof ₹ 5149.00(77.36US $) indifferent schemes. They also kept some cash money with them to meet out day to day expenses. The marginal farmers group could not make investment in financial capital because of having no savings. However, they
Table 3. Pattern of Investment as fixed capital ₹ per household
|
Particulars of Investment |
Size group in hectare |
Average (1.17 hectare) |
||
|
Below 1 Hectare (0.52) |
1-2 Hectare (1.35) |
2 hectare & above (4.14) |
||
1. Lands and its improvement
|
Average (₹) (In US $) |
- |
1377.50 20.70 (13.22) |
3570.00 53.64 (12.85) |
767.15 11.53 (13.00) |
|
2. Live stock (Milch cattle) |
||||
|
Average (₹) (In US $) |
- |
4560.00 68.51 (43.80) |
4305.00 64.68 (15.50) |
1562.85 23.48 (26.48) |
|
3. Farm equipment and machinery |
||||
|
Average (₹) (In US $) |
- |
437.00 6.57 (4.20) |
4987.50 74.93 (17.96) |
744.51 11.19 (12.62) |
|
4. Irrigation works |
||||
|
Average (₹) (In US $) |
- |
2612.50 39.25 (25.10) |
9975.00 149.86 (35.92) |
1871.50 28.12 (31.72) |
|
5. Farm buildings |
||||
|
Average (₹) (In US $) |
- |
1425.00 21.41 (13.68) |
4935.00 74.14 (17.77) |
955.05 14.35 (16.18) |
|
Total investment |
||||
|
Average (₹) (In US $) |
- |
10412.00 156.43 (100.00) |
27772.50 417.26 (100.00) |
5901.06 88.66 (100.00) |
Note: Figures in parenthesis are per cent to total. (US $ as on April 14, 2016; 1 US $ = 66.56 ₹)
managed to repay some part of their loans by managing current incomes. The small farmers invested a higher share in post office deposits, followed by LIC policies while large farmers preferred to invest in purchase of NSC and Kisan Vikash Patra, followed by deposits in postoffice,Banksand purchaseofornaments etc. While in N igeria around 64 per cent respondent saved their money at home/in cooperative societies, only 5% population saved it with microfinance institutions and 0% population saved their money with commercial banks [8].
Total Investmentand sourceoffinance according to income groups
An examination of the total investment made by sample farmers distributed according to different income groups showed that
Table 4. Investment pattern of working capital ₹ per household
|
Variable input |
Size group in hectare |
Average |
||
|
Below 1 hectare |
1-2 Hectare |
2 hectare & above |
||
1. Hired labourer
|
Average (₹) (In US $) |
1913.56 28.75 (17.32) |
6709.28 100.80 (22.13) |
41555.61 624.33 (39.31) |
8122.08 122.03 (29.44) |
|
2. Hired Tractor Power |
||||
|
Average (₹) (In US $) |
2709.00 |
6725.55 |
11075.74 |
4680.31 |
|
40.70 |
101.04 |
166.40 |
70.32 |
|
|
(24.53) |
(22.18) |
(10.48) |
(16.96) |
|
|
3. Seeds |
||||
|
Average (₹) (In US $) |
1511.26 |
4175.31 |
14008.64 |
3722.01 |
|
22.71 |
62.73 |
210.47 |
55.92 |
|
|
(13.68) |
(13.77) |
(13.25) |
(13.50) |
|
|
4. Manure & Fertilizers |
||||
|
Average (₹) (In US $) |
2725.74 |
7142.84 |
21678.10 |
6161.31 |
|
40.95 |
107.31 |
325.69 |
92.57 |
|
|
(24.68) |
(23.56) |
(20.51) |
(22.33) |
|
|
5. Irrigation |
||||
|
Average (₹) (In US $) |
1662.64 |
4320.61 |
13271.52 |
3756.55 |
|
24.98 |
64.91 |
199.39 |
56.44 |
|
|
(15.05) |
(14.25) |
(12.55) |
(13.61) |
|
|
6. Insecticides/ Pesticides |
||||
|
Average (₹) (In US $) |
523.32 |
1247.71 |
4119.65 |
1150.20 |
|
7.86 |
18.75 |
61.89 |
17.28 |
|
|
(4.74) |
(4.11) |
(4.00) |
(4.16) |
|
|
Total Variable cost |
||||
|
Average (₹) (In US $) |
11045.52 |
30321.30 |
105709.28 |
27592.47 |
|
165.95 |
455.55 |
1588.18 |
414.55 |
|
|
(100.00) |
(100.00) |
(100.00) |
(100.00) |
|
Note: Figures in parenthesis are per cent to total. (US $ as on April 14, 2016; 1 US $ = 66.56 ₹)
Table 5. Investment in non-farm capital ₹ per household
Particulars
|
Size group in hectare |
||
|
Below 1 hectare |
1-2 Hectare |
2 hectare & above |
Average
1. Residential plots house etc.
|
Average (₹) (In US $) |
- |
- |
- |
- |
2. Furniture
|
Average (₹) (In US $) |
- |
472.50 7.10 |
1222.50 18.37 |
262.87 3.95 |
3. Vehicle (Car, Motor cycle, Scooter, Bicycle etc.)
Average (₹) (In US $)
2172.00 32.64
11825.00 2015.20
177.66 30.28
4. Television, Radio etc.
Average (₹) (In US $)
1627.50 24.45
8662.50 130.15
1484.17 22.30
5. Other items
|
Average (₹) (In US $) |
- |
266.50 4.00 |
892.50 13.41 |
174.65 19.15 |
Total Non- Farm expenditure
Average (₹) (In US $)
4539.00 22602.50
68.19 339.58
3936.90
59.15
(US $ as on April 14, 2016; 1 US $ = 66.56 ₹)
highest investmentof ₹48368.65(726.69US $)was madeonwork-ing capital being 69.02 per cent. Our results are also in conformity of the Odoemenem et al [9]. A similar trend was observed in all income groups. However, it stood highest being 98.48 per cent in lowest income groupsbecauseof no savings for investment inother items. Small and large farmers groups invested in all the items in which it washighest inworking capital(61.28 to61.84 per cent), fol- lowed by investment in fixed capital (14.41 to 16.84 per cent), financial capital (12-14 per cent) and non-farm capital (7-12 per cent).
In caseof sourcesof finance for investment, current incomewas found to be the main source of finance in all income groups which accounted for 49.70 to 94.79 per cent share of the total investment followedby savingswhich shared for40.10 to49.12 per cent in total investment.
Table 6. Financial investment made by sample farmers ₹ per household
|
Particulars of investment |
Size group in hectare |
Average |
||
|
Below 1 hectare |
1-2 Hectare |
2 hectare & above |
||
|
Average (₹) (In US $) |
- |
- |
5250.00 78.88 (22.65) |
682.50 9.44 (13.25) |
2. Life Insurance Policies
|
Average (₹) (In US $) |
- |
2257.50 33.92 (24.98) |
3024.00 45.43 (13.04) |
889.77 13.37 (17.28) |
3. Deposits in banks
|
Average (₹) (In US $) |
- |
1930.95 29.01 (21.38) |
5534.34 83.15 (23.87) |
1144.27 17.19 (22.22) |
4. Deposits in post office
|
Average (₹) (In US $) |
- |
2649.57 39.81 (29.33) |
4567.50 68.62 (19.70) |
1176.67 17.68 (22.85) |
|
Average (₹) Ли HQ |
- |
1942.50 29.18 |
4357.50 65.47 |
993.82 14.93 |
|
(In US $) |
(21.50) |
(18.80) |
(19.30) |
6. Repayment of Loans
|
Average (₹) (In US $) |
227.00 |
254.10 |
450.00 |
261.95 |
|
3.41 |
3.82 |
6.76 |
3.94 |
|
|
(100.00) |
(2.81) |
(1.94) |
(5.10) |
Total investment
|
Average (₹) (In US $) |
227.00 3.41 (100.00) |
9034.62 135.74 (100.00) |
23183.34 348.31 (100.00) |
5149.00 77.36 (100.00) |
Note: Figures in parenthesis are per cent to total (US $ as on April 14, 2016; 1 US $ = 66.56 ₹)
Table 7. Total Investment and source of finance according to income groups ₹ per household
|
Particulars |
Size group in hectare |
Average |
||
|
Below 1 hectare |
1-2 Hectare |
2 hectare & above |
||
A. Farm Capital
(i) Working Capita
|
Average (₹) (In US $) |
17074.12 |
26860.07 |
119181.15 |
33381.68 |
|
256.52 |
403.55 |
1790.58 |
501.53 |
|
|
(98.48) |
(61.28) |
(61.84) |
(69.02) |
(ii) Fixed Capita
|
Average (₹) (In US $) |
- |
7389.16 111.02 (16.84) |
27772.50 417.26 (14.41) |
5901.06 88.66 (12.20) |
B. Non-farm capital
|
Average (₹) (In US $) |
- |
3221.22 48.40 (7.34) |
22602.50 339.58 (11.73) |
3936.16 59.14 (8.14) |
C. Financial Capita
|
Average (₹) (In US $) |
263.48 3.96 |
6411.66 96.33 |
23183.34 348.31 |
5149.00 77.36 |
|
(1.52) |
(14.61) |
(12.02) |
(10.64) |
Total Investment
|
Average (₹) (In US $) |
17337.60 |
43882.11 |
192739.50 |
48368.65 |
|
260.48 |
659.29 |
2895.73 |
726.69 |
|
|
(100.00) |
(100.00) |
(100.00) |
(100.00) |
Sources of finance
1. Savings
|
Average (₹) fin 1 IQ |
- |
17596.73 264.36 |
94673.64 1422.38 |
17762.56 266.87 |
|
(In US $) |
(40.10) |
(49.12) |
(36.73) |
2. Current Income
|
Average (₹) (In US $) |
16434.32 |
25785.13 |
95791.53 |
29649.51 |
|
246.91 |
387.40 |
1439.18 |
445.46 |
|
|
(94.79) |
(58.76) |
(49.70) |
(61.30) |
3. Borrowing
|
Average (₹) (In US $) |
903.28 13.57 (5.21) |
500.26 7.52 (1.14) |
2274.33 34.17 (1.18) |
956.58 14.37 (1.97) |
(US $ as on April 14, 2016; 1 US $ = 66.56 ₹)
Conclusion
As per findingsof the investigation, it is concluded that large farm holders were able to save higher income in comparison to small farmers while lowest income group have negative savings. In respect of investment, it was found that amongst different fixed assets, investment on irrigation was given first priority, followed by purchase of milch animals, farms buildings and investment in land and its improvement. Investment onworking capital amongst different cash inputs, hired human labourer accounted highest share
-
• References
-
1. Osondu C.K., Obike K.C., and Ogbonna S.I. Savings, Income and Investment patterns and its determinants among small holder arable crop farmers in Umuahia Capital Territory, Abia State Nigeria. European Journal of Business and Innovation Research. 2015;3(1):51-70.
-
2. Radha Priya C., Gayathri, R. Demographics Persuade the Savings and Investment Pattern of Farmers - An Empirical Study. International Journal of Current Research and Modern Education. 2018;3(1):111-125.
-
3. Saini R., Kumar R. Determining the Factors Affecting Investment in Punjab Agriculture. Economic Affairs. 2020;65(4):511-520.
-
4. Ruedas M. Y.A.D.R., Guico M.J. Saving Pattern of Small-Scale Women Rice Farmers in San Jose, Occidental Mindoro. Journal of Asian Rural Studies. 2021;5(1):48-55.
-
-
5. Nwibo S.U., Mbam B.N. Determinants of Savings and Investment
Capacities of Farming Households in Udi Local Government Area of Enugu State, Nigeria. Research Journal of Finance and Accounting. 2013;4(15):59-65.
-
6. Kavitha B. Study on Investment Pattern in Farm Firms. Acta Scientific Agriculture. 2019;3(4):287-293.
-
7. Gasti A.K. Savings and Investment Behaviour of Rural Household: an analytical Study of Households of Dharwad District of Karnataka State. Imperial Journal of Interdisciplinary Research. 2017;3(4):548-553.
-
8. Iheoma C.C., Chidiebere A.C. Savings Level and Investment Behaviour of Cooperative Farmers (Analysis and Prospects) in Jos East Local Gove rnme nt Area; Plateau State . Asian Journal of Economics, Business and Accounting. 2020;17(3):20-26. https://jour-nalajeba.com/index.php/AJEBA/article/view/30262
-
9. Od oeme ne m I.U., Ezihe J.A .C., Ake rele S.O. Saving and Investment Pattern of Small-Scale Farmers of Benue State, Nigeria. Global Journal of Human Social Science Sociology and Culture. 2013;13(1):7-11.
References Study of saving and investment pattern on sample farms households
- Osondu C.K., Obike K.C., and Ogbonna S.I. Savings, Income and Investment patterns and its determinants among small holder arable crop farmers in Umuahia Capital Territory, Abia State Nigeria. European Journal of Business and Innovation Research. 2015;3(1):51-70.
- Radha Priya C., Gayathri, R. Demographics Persuade the Savings and Investment Pattern of Farmers - An Empirical Study. International Journal of Current Research and Modern Education. 2018;3(1):111-125.
- Saini R., Kumar R. Determining the Factors Affecting Investment in Punjab Agriculture. Economic Affairs. 2020;65(4):511-520.
- Ruedas M. Y.A.D.R., Guico M.J. Saving Pattern of Small-Scale Women Rice Farmers in San Jose, Occidental Mindoro. Journal of Asian Rural Studies. 2021;5(1):48-55. http://pasca.unhas.ac.id/ojs/index.php/jars/article/view/2707
- Nwibo S.U., Mbam B.N. Determinants of Savings and Investment Capacities of Farming Households in Udi Local Government Area of Enugu State, Nigeria. Research Journal of Finance and Accounting. 2013;4(15):59-65.
- Kavitha B. Study on Investment Pattern in Farm Firms. Acta Scientific Agriculture. 2019;3(4):287-293.
- Gasti A.K. Savings and Investment Behaviour of Rural Household: an analytical Study of Households of Dharwad District of Karnataka State. Imperial Journal of Interdisciplinary Research. 2017;3(4):548-553.
- Iheoma C.C., Chidiebere A.C. Savings Level and Investment Behaviour of Cooperative Farmers (Analysis and Prospects) in Jos East Local Government Area; Plateau State. Asian Journal of Economics, Business and Accounting. 2020;17(3):20-26. https://jour-nalajeba.com/index.php/AJEBA/article/view/30262
- Odoemenem I.U., Ezihe J.A.C., Akerele S.O. Saving and Investment Pattern of Small-Scale Farmers of Benue State, Nigeria. Global Journal of Human Social Science Sociology and Culture. 2013;13(1):7-11.
