
Study of Some Physiological Parameters of Field-Grown Chickpea and Lentil Samples
Journal: Bulletin of Science and Practice @bulletennauki
Section: Сельскохозяйственные науки
Article in issue: 9 т.12, 2026.
Free access
Chickpea (Cicer arietinum L.) and lentil (Lens culinaris M.) are major legume crops grown worldwide, providing people with balanced nutrition of proteins, minerals, fibers, vitamins, and carbohydrates. In this research, chickpea and lentil samples were characterized according to gas exchange parameters, leaf specific mass (LSM) dynamics, and grain yield. The net photosynthesis rate (Pn) of chickpea samples varied in the range of 11.5–17.0 μmol CO2 m−2 s−1, while the Pn of lentil samples varied in the range of 4.0–6.8 μmol CO2 m−2 s−1. Chickpea samples Sanford, Sultan-2, Sultan, and Nazrin, and lentil samples F-2014-006, F-86-16, and F-2012-8 had higher gas exchange parameters. The Pn positively and significantly correlated with mesophyll conductance (0.847**) and water use efficiency (0.768**), and negatively and significantly correlated with intercellular CO2 concentrations (-0.888**). An increase in LSM continued until the pod formation–early ripening stages in chickpea samples. However, an increase in LSM of lentil samples continued until the pod formation stage. A higher leaf specific mass at the early ripening stage was detected in chickpea genotypes F-08-116, Sultan-2, Sultan, and Narmin, and in lentil samples F-2013-18, F-2012-1L, and F-2014-009. Grain yield of chickpea samples varied in the range of 1310–2030 kg/ha, and grain yield of lentil samples varied in the range of 900–1450 kg/ha. The highest grain yield was formed by chickpea samples Sultan, Narmin, and Sechme L, and by lentil samples F-2012-1L, F-2013-29, F-2012-18, and F-2014-009.
Short address: https://sciup.org/14139046
IDS: 14139046 | UDC: 633.11; 581.19 | DOI: 10.33619/2414-2948/130/50
Изучение некоторых физиологических показателей нута и чечевицы, выращенных в полевых условиях
Нут (Cicer arietinum L.) и чечевица (Lens culinaris M.) — важные зернобобовые культуры, выращиваемые во всем мире и обеспечивающие полноценное питание за счет содержания белков, минеральных веществ, клетчатки, витаминов и углеводов. В данном исследовании образцы нута и чечевицы оценивались по показателям газообмена, динамике удельной массы листа (УМЛ) и урожайности зерна. Интенсивность чистого фотосинтеза (Pn) у образцов нута варьировала в пределах 11,5–17,0 мкмоль CO₂·м⁻²·с⁻¹, тогда как у образцов чечевицы этот показатель составлял 4,0–6,8 мкмоль CO₂·м⁻²·с⁻¹. Более высокие показатели газообмена были отмечены у образцов нута Sanford, Sultan-2, Sultan и Nazrin, а также у образцов чечевицы F-2014-006, F-86-16 и F-2012-8. Показатель Pn демонстрировал значимую положительную корреляцию с проводимостью мезофилла (0,847**) и эффективностью использования воды (0,768**), а также значимую отрицательную корреляцию с концентрацией межклеточного CO₂ (-0,888**). Увеличение УМЛ у образцов нута продолжалось вплоть до стадии формирования бобов и начала созревания, тогда как у образцов чечевицы рост УМЛ наблюдался до стадии формирования бобов. Более высокая удельная масса листа на этапе начала созревания была выявлена у генотипов нута F-08-116, Sultan-2, Sultan и Narmin, а также у образцов чечевицы F-2013-18, F-2012-1L и F-2014-009. Урожайность зерна варьировала в пределах 1310–2030 кг/га для нута и 900–1450 кг/га для чечевицы. Наиболее высокая урожайность зерна была получена у сортов нута «Султан», «Нармин» и «Сечме L», а также у образцов чечевицы F-2012-1L, F-2013-29, F-2012-18 и F-2014-009.
Text of the scientific article Study of Some Physiological Parameters of Field-Grown Chickpea and Lentil Samples
Бюллетень науки и практики / Bulletin of Science and Practice
UDC 633. 11; 581.19
Chickpea ( Cicer arietinum L.) and lentil ( Lens culinaris M.) are vital food and feed crops of the family Fabaceae, mainly grown in semiarid and temperate regions of the world [11].
Chickpea and lentil are good sources of protein, carbohydrates, and fiber, and important sources of essential minerals and vitamins [5].
Chickpea and lentil have higher levels of protein (21%), leucine (7.2g/100g), phenylalanine (5.7g/100g), and lysine (7.26g/100g) [3]. A total of 70% of the world's chickpea production comes from Turkey, Iran, Pakistan, and India. Rapid growth of the world population, low economic development in some countries, and wars increase people's demand for vegetable protein, carbohydrates, vitamins, and mineral elements. Lentil and chickpea are valuable grain legumes that reduce dependency on synthetic fertilizers, enhance soil health, and diversify crop rotations, improving resilience to climate variability [18].
As legumes can efficiently capture atmospheric nitrogen and fix it into the soil, they are nature’s nitrogen fertilizer factories, to the great benefit of the following cereal crop. Chickpea is adapted to environmental stresses, such as drought, high temperatures, and poor soils, and may thus be an important food security crop for smallholder farmers in the semi-arid tropics. Environmental abiotic stresses (high temperatures, drought, cold, salinity) are becoming major constraints to crop yield, adversely affecting plant growth and ultimately resulting in significant yield losses in various crops, including chickpea and lentil. The adoption of good management practices, such as appropriate sowing dates and tolerant genotypes, can enhance the seed yield of chickpea under the current scenario of climate change [14].
Selection of genetically diverse varieties according to their morpho-physiological and agronomical traits under favorable or stress conditions is a suitable approach for determining yield potential and identifying tolerant genotypes. A structural analysis of 223 chickpea world collection genotypes for bush structure, plant height, height of the lower pods, number of lateral branches, number of productive nodes, number of pods per plant, seed weight per plant, and 1000-seed weight was conducted in the dry-steppe and foothill zones of Southeast Kazakhstan [13].
The study identified 42 favorable chickpea cultivars based on growth (early maturing, droughtresistant genotypes) and yield traits. High chlorophyll content, photosystem II function, and stomatal conductance are important traits for selecting photosynthetically efficient genotypes under heat stress [9].
Ten of 39 chickpea genotypes exhibited high heat tolerance, evidenced by small reductions in pollen viability, pollen germination, and pod set percentage; high seed yield per plant; and less damage to membranes, photosynthetic ability, leaf water status, and oxidative processes [10].
Photosynthesis is fundamental for plant growth, development, and productivity. Currently, photosynthesis studies in various plants include measurement of leaf gas exchange, study of physicochemical and catalytic properties, and gene expression of enzymes involved in C3 and C4 photosynthesis. For decades, gas exchange techniques using infrared gas analysers (IRGA) have been widely used to measure fluxes of CO 2 and H 2 O into and out of leaves. Gas exchange measurements inform us about diverse aspects of carbon and water relations, ranging from processes associated with the light-dependent and light-independent reactions to CO 2 /H 2 O diffusion and the sink capacity of a leaf [8].
The availability of photoassimilates, mobilization of sucrose, and conversion into carbohydrates in the grain are compromised under drought stress in chickpea, resulting in reduced starch deposition [4].
The ICARDA (International Center for Agricultural Research in the Dry Areas) chickpea and lentil nurseries are vital global hubs that distribute genetically diverse, climate-resilient germplasm to agricultural partners worldwide. They empower local researchers to test and select elite, diseaseresistant varieties tailored to their specific agro-ecological conditions, significantly boosting global food security, farmers' incomes, and soil health. The Research Institute of Crop Husbandry collaborates with ICARDA by receiving chickpea and lentil nurseries and testing them in different agro-ecological zones of the Azerbaijan Republic. The studied germplasm served as starting breeding material for the creation of local chickpea and lentil varieties.
We aimed to study gas exchange parameters and dynamics of leaf specific mass (LSM) of field-grown chickpea and lentil samples.
Materials and Methods
The experiment was conducted during the 2022-2023 growing season at the Research Institute of Crop Husbandry, located on the Absheron Peninsula, Baku, Azerbaijan (40° 27' 49.20" N, 49° 57' 27.29" E). Ten chickpea and 10 lentil samples grown under field conditions were used as the material for the gas exchange study. An additional 2 chickpea samples and 5 lentil samples were used for LSM dynamics and grain yield. Each line was grown in 4 m x 4 m plots (9 rows, inter-row spacing 0.50 m). Fertilizer was applied at the rate of N 30 P 90 K 30 .
Gas exchange parameters, including photosynthesis rate (Pn), stomatal conductance (gs), intercellular CO2 concentrations (Ci), and transpiration rate (Tr), were measured using the Li-6400XT Portable Photosynthesis System (Li-COR Biosciences, Lincoln, NE, USA). Measurements were conducted on young, fully expanded leaves on upper branches between 10:00 h and 12:30 h. Light intensity was measured using a Li-250A light meter (Li-COR Biosciences, Lincoln, NE, USA). Leaf area was measured using a Li-3100C Area Meter (Li-COR Biosciences, Lincoln, NE, USA). Mesophyll conductance was calculated from the ratio Pn/Ci, and water use efficiency was calculated from the ratio Pn/Tr. Dry mass of leaves was determined after oven drying at 100°C for 24 h. LSM was calculated from the ratio of dry mass to leaf area.Statistical analysis: The arithmetic mean and standard deviation were determined by Microsoft Excel 2010. Correlations between gas exchange parameters determined by using SPSS 16 software.
Results and Discussion
The Pn of chickpea leaves varied in the range of 11.5–17.0 μmol CO 2 m-2 s-1 (Table 1). The highest rates of photosynthesis were detected in chickpea genotypes Sanford, Sultan-2, Sultan, and Nazrin. The lowest rates of photosynthesis were detected in chickpea genotypes F-08-89 and Jamila. The stomatal conductance of chickpea leaves varied in the range of 0.041–0.103 mol H 2 O m-2 s-1. This gas exchange parameter was the highest in genotypes Narmin and F-08-196, while it was the lowest in genotypes F-07-274 and Sultan-2. The intercellular CO 2 concentrations varied in the range of 70.8–180 µmol CO 2 mol-1. The transpiration rate varied in the range of 1.81–2.70 mmol H 2 O m-2 s-1. The highest transpiration rate was detected in genotypes Nazrin and Sultan-2. Reported high leaf photosynthesis rates (19.1–23.1 μmol m-2 s-1), stomatal conductance (0.30–0.54 mol m-2 s-1), and intercellular CO 2 concentrations (214–351 μmol mol-1) for Cicer accessions . Compared with seven domesticated C. arietinum accessions, 54 wild C. reticulatum accessions and 15 C. echinospermum accessions had lower stomatal conductance and higher leaf mass per area and nitrogen concentrations, associated with lower intercellular CO 2 concentrations and higher water-use efficiency [16].
Table 1
GAS EXCHANGE PARAMETERS OF CHİCKPEA SAMPLES
|
Genotypes |
Photosynthesis rate (Pn) μmol CO 2 m-2 s-1 |
Stomatal conductance (gs) mol H2O m-2s-1 |
Intracellular CO 2 concentration (Ci) μmol CO2 mol-1 |
Transpiration (Tr) mmol H 2 O m-2 s-1 |
Mesophyll conductance (gm) Pn/Ci mol CO 2 m-2 s-1 |
Water use efficiency (WUE) Pn/Tr μmol CO 2 mmol H 2 O-1 |
|
Sanford |
17.0±1.13 |
0.071±0.07 |
88.3±7 |
2.40±0.03 |
0.192 |
7.08 |
|
Sultan-2 |
16.6±0.93 |
0.064±0.01 |
93.0±5 |
2.54±0.02 |
0.178 |
6.54 |
|
Sultan |
16.5±0.91 |
0.088±0.02 |
70.8±4 |
2.41±0.01 |
0.233 |
6.85 |
|
Nazrin |
16.4±0.55 |
0.070±0.01 |
114.0±4 |
2.70±0.02 |
0.144 |
6.07 |
|
F-07-274 |
13.9±0.15 |
0.041±0.01 |
143.8±5 |
2.44±0.52 |
0.097 |
5.69 |
|
F-08-116 |
13.4±0.63 |
0.099±0.02 |
162.8±3 |
2.55±0.43 |
0.082 |
5.26 |
|
Narmin |
13.1±0.98 |
0.103±0.01 |
161.0±8 |
2.19±0.26 |
0.081 |
5.98 |
|
F-08-196 |
12.5±0.45 |
0.094±0.03 |
168.0±7 |
2.34±0.31 |
0.074 |
5.33 |
|
F-08-89 |
11.9±0.26 |
0.080±0.01 |
175.2±6 |
2.52±0.11 |
0.068 |
4.72 |
|
Jamila |
11.5±0.17 |
0.076±0.02 |
180.0±8 |
1.81±0.09 |
0.064 |
6.35 |
Terminal drought markedly reduces leaf photosynthesis of chickpea during seed filling. The rate of net photosynthesis of subtending leaves of 10-d-old pods was 24 and 6 μmol CO 2 m-2 s-1 in the well-watered and water-stressed plants, respectively [15].
The mesophyll conductance varied in the range 0.064–0.233 mol CO 2 m⁻² s⁻¹, and water use efficiency varied in the range 4.72–7.08 μmol CO 2 mmol H2O⁻¹. The highest mesophyll conductance and water use efficiency were detected in chickpea genotypes Sanford, Sultan, and Sultan-2. The Pn positively and significantly correlated with mesophyll conductance and water use efficiency, and negatively and significantly correlated with intercellular CO 2 concentrations (Table 2).
Similar correlations between Pn, gs, and gm were detected in our previous research with wheat plants [2].
The Pn of lentil leaves varied in the range of 4.0–6.8 μmol CO 2 m⁻² s⁻¹, which is lower than the Pn of chickpea leaves (Table 3).
Table 2
PEARSON CORRELATİON COEFFİCİENTS BETWEEN GAS EXCHANGE PARAMETERS İN CHİCKPEA SAMPLES
|
Pn |
gs |
Ci |
Tr |
gm |
WUE |
|
|
Pn |
1 |
|||||
|
gs |
-0.223 |
1 |
||||
|
Ci |
-0.888** |
0.231 |
1 |
|||
|
Tr |
0.403 |
-0.172 |
-0.155 |
1 |
||
|
gm |
0.847** |
-0.177 |
-0.958** |
0.086 |
1 |
|
|
WUE |
0.768** |
-0.172 |
-0.864** |
-0.256 |
0.878** |
1 |
|
**-correlation is significant at the 0.01 level. |
||||||
|
GAS EXCHANGE PARAMETERS İN LENTİL SAMPLES |
Table 3 |
|||||
|
Genotypes |
Photosynt hesis rate (Pn) μmol CO 2 m-2 s- 1 |
Stomatal conductance (gs) mol H 2 O m-2 s-1 |
Intracellular CO 2 concentratio n (Ci) μmol CO 2 mol-1 |
Transpirati on rate (Tr) mmol H 2 O m-2 s-1 |
Mesophyll conductance (gm) Pn/Ci mol CO 2 m-2 s-1 |
Water use efficiency (WUE) Pn/Tr μmol CO 2 mmol H 2 O-1 |
|
F-2014-006 |
6.8±0.13 |
0.085±0.03 |
241.2±8 |
2.25±0.02 |
0.028 |
3.02 |
|
F-86-16 |
6.5±0.13 |
0.071±0.01 |
239.0±7 |
2.27±0.03 |
0.027 |
2.86 |
|
F-2012-8 |
6.0±0.12 |
0.077±0.03 |
224.5±8 |
2.03±0.04 |
0.026 |
2.96 |
|
Arzu |
6.0±0.12 |
0.083±0.02 |
261.0±6 |
2.30±0.03 |
0.023 |
2.61 |
|
F-2013-22 |
5.6±0.11 |
0.082±0.01 |
255.7±7 |
2.22±0.03 |
0.022 |
2.52 |
|
F-2012-1L |
5.5±0.11 |
0.110±0.03 |
247.3±6 |
2.61±0.02 |
0.022 |
2.71 |
|
F-2014-009 |
5.3±0.12 |
0.083±0.01 |
264.3±7 |
2.11±0.02 |
0.020 |
2.52 |
|
Surian local L. |
5.0±0.10 |
0.089±0.01 |
282.0±8 |
2.49±0.01 |
0.017 |
2.01 |
|
F- 2012-18 |
4.1±0.10 |
0.026±0.01 |
322.8±5 |
3.04±0.03 |
0.013 |
1.35 |
|
F-2013-4 |
4.0±0.09 |
0.090±0.02 |
311.2±5 |
2.19±0.02 |
0.013 |
1.82 |
A relatively high rate of photosynthesis was revealed in leaves of F-2014-006 and F-86-16 lines. The stomatal conductance varied in the range of 0.026–0.110 mol H 2 O m⁻² s⁻¹. The highest gs was detected in leaves of lentil lines F-2012-1L, F-2013-4, and Surian local L. The lowest gs was detected in leaves of the F-2012-18 line. The Ci of lentil lines varied in the range of 239–322.8 μmol CO 2 mol⁻¹. Lentil lines with higher Pn (F-2014-006, F-86-16, F-2012-8) exhibited lower Ci. The transpiration rate of lentil lines varied in the range 2.03–3.04 mmol H2O m⁻² s⁻¹. The highest Tr was revealed in lentil lines F-2012-18, F-2012-1L, and Surian local L. The Pn and Ci constituted 7.87 μmol CO 2 m⁻² s⁻¹ and 344.7 µmol CO 2 mol⁻¹, 7.38 μmol CO 2 m⁻² s⁻¹ and 338.0 µmol CO 2 mol⁻¹, and 4.75 μmol CO 2 m⁻² s⁻¹ and 304.2 µmol CO 2 mol⁻¹ in leaves of well-watered, moderate water-limited, and severe water-limited lentil plants [1].
Salt stress (75 mM NaCl) significantly decreased all photosynthetic parameters of lentil plants: Pn reduced from 13.56 μmol CO 2 m⁻² s⁻¹ to 5.48 μmol CO 2 m⁻² s⁻¹, gs reduced from 0.18 mol H 2 O m⁻² s⁻¹ to 0.03 mol H 2 O m⁻² s⁻¹, Tr reduced from 2.11 mmol H 2 O m⁻² s⁻¹ to 0.46 mmol H 2 O m⁻² s⁻¹, and Ci reduced from 371 µmol CO 2 mol⁻¹ to 137 µmol CO 2 mol⁻¹ [7].
Treatment of seeds with 0.1 mM salicylic acid or with 0.1 mM H 2 O 2 increased photosynthetic parameters of salt-stressed plants. The photosynthetic activity of lentil genotypes was negatively affected by drought stress. However, the interactions between drought stress and silicon (Si) treatment showed an increase in Pn, gs, Tr, and Ci values when compared with the control [6].
The enhancing effect of Si on the photosynthetic rate could be attributed to the increase in chlorophyll pigments under Si supplementation. The mesophyll conductance of lentil samples varied in the range 0.013–0.028 mol CO 2 m⁻² s⁻¹. Lentil lines F-2014-006, F-86-16, and F-2012-8 had higher gm. The water use efficiency varied in the range of 1.35–3.02 μmol CO 2 mmol⁻¹ H 2 O. The highest water use efficiency was observed in lines F-2014-006, F-86-16, and F-2012-8, while the lowest was in lines F-2012-18 and F-2013-4. Table 4 shows correlation coefficients between gas exchange parameters of lentil lines. Pn was positively and significantly correlated with water use efficiency, and positively but non-significantly correlated with mesophyll conductance.
Table 4 PEARSON CORRELATİON COEFFİCİENTS BETWEEN GAS
EXCHANGE PARAMETERS İN LENTİL SAMPLES
|
Pn |
gs |
Ci |
Tr |
gm |
WUE |
|
|
Pn |
1 |
|||||
|
gs |
-0.030 |
1 |
||||
|
Ci |
-0.874** |
0.244 |
1 |
|||
|
Tr |
0.508 |
0.717** |
-0.161 |
1 |
||
|
gm |
0.249 |
-0.140 |
-0.127 |
0.102 |
1 |
|
|
WUE |
0.841** |
-0.396 |
-0.929 |
0.43 |
0.195 |
1 |
**-correlation is significant at the 0.01 level
The correlation between Pn and Ci was negative and significant. Tr was positively and significantly correlated with gs. Tables 5 and 6 show leaf specific mass dynamics of chickpea and lentil samples during the vegetation period. In chickpea samples, the dry mass of the leaf per unit area is lower in the branching phase, increases during budding, flowering, pod formation, and early ripening, and decreases during full ripening.
Table 5
CHANGES İN LEAF SPECİFİC MASS
OF CHİCKPEA SAMPLES LEAF DURİNG VEGETATİON PERİOD (mg/mm2)
|
Genotypes |
04.04.25 |
13.04.25 |
28.04.25 |
08.05.25 |
17.05.25 |
30.05.25 |
08.06.25 |
|
F-07-289 |
0.04 |
0.05 |
0.06 |
0.06 |
0.07 |
0.08 |
0.07 |
|
Sanford |
0.03 |
0.04 |
0.05 |
0.05 |
0.07 |
0.08 |
0.07 |
|
F-07- 274 |
0.03 |
0.06 |
0.07 |
0.08 |
0.09 |
0.09 |
0.08 |
|
Jamila |
0.04 |
0.05 |
0.07 |
0.08 |
0.08 |
0.09 |
0.08 |
|
F-08-89 |
0.04 |
0.05 |
0.07 |
0.08 |
0.09 |
0.09 |
0.08 |
|
F-08-196 |
0.04 |
0.06 |
0.07 |
0.07 |
0.09 |
0.09 |
0.08 |
|
F-08-116 |
0.04 |
0.06 |
0.07 |
0.08 |
0.09 |
0.10 |
0.09 |
|
Nəzrin |
0.05 |
0.06 |
0.07 |
0.08 |
0.08 |
0.09 |
0.08 |
|
Sultan-2 |
0.05 |
0.07 |
0.07 |
0.09 |
0.09 |
0.10 |
0.09 |
|
Sultan |
0.05 |
0.07 |
0.07 |
0.07 |
0.09 |
0.10 |
0.09 |
|
Narmin |
0.05 |
0.07 |
0.08 |
0.08 |
0.09 |
0.10 |
0.09 |
|
Sechme L |
0.05 |
0.07 |
0.08 |
0.09 |
0.09 |
0.09 |
0.08 |
|
Mean |
0.043 |
0.060 |
0.070 |
0.076 |
0.085 |
0.092 |
0.082 |
At the early ripening stage (30.05.), higher leaf specific mass was detected in chickpea genotypes F-08-116, Sultan-2, Sultan, and Narmin. A similar trend was observed in lentil samples; however, the increase in leaf specific mass in lentil samples continued until the pod formation stage. Higher leaf specific mass was detected in lentil samples F-2013-18, F-2012-1L, and F-2014-009.
Early in the vegetative growth stages, chickpea samples have larger, thinner leaves (higher leaf specific area, lower leaf specific mass). As the plants mature toward flowering and grain filling, leaf specific mass increases due to the thickening of the leaf lamina and the accumulation of structural carbohydrates [12].
Table 6
CHANGES İN LEAF SPECİFİC MASS OF LENTİL LEAVES DURİNG VEGETATİON PERİOD (mg/mm2)
|
Genotypes |
04.04.25 |
13.04.25 |
28.04.25 |
08.05.25 |
17.05.25 |
30.05.25 |
|
F-86-16 |
0.04 |
0.04 |
0.04 |
0.05 |
0.06 |
0.05 |
|
LC 006000296 |
0.02 |
0.03 |
0.04 |
0.05 |
0.06 |
0.05 |
|
F-2013-22 |
0.03 |
0.04 |
0.05 |
0.06 |
0.06 |
0.05 |
|
F-2014-026 |
0.02 |
0.04 |
0.04 |
0.05 |
0.06 |
0.05 |
|
F-2013-18 |
0.04 |
0.05 |
0.06 |
0.06 |
0.08 |
0.07 |
|
F-2013-4 |
0.03 |
0.04 |
0.05 |
0.06 |
0.06 |
0.05 |
|
F- 2012-8 |
0.03 |
0.04 |
0.06 |
0.07 |
0.07 |
0.06 |
|
F-2013-26 |
0. 03 |
0.03 |
0.04 |
0.05 |
0.06 |
0.05 |
|
Surian local L. |
0.02 |
0.04 |
0.05 |
0.06 |
0.07 |
0.06 |
|
Arzu |
0.03 |
0.04 |
0.05 |
0.06 |
0.07 |
0.06 |
|
F-2014-006 |
0.05 |
0.05 |
0.05 |
0.06 |
0.07 |
0.06 |
|
F-2012-1L |
0.05 |
0.05 |
0.07 |
0.07 |
0.08 |
0.07 |
|
F-2013-29 |
0.02 |
0.04 |
0.05 |
0.06 |
0.07 |
0.05 |
|
F-2012-18 |
0.02 |
0.03 |
0.04 |
0.05 |
0.07 |
0.06 |
|
F-2014-009 |
0.05 |
0.06 |
0.07 |
0.08 |
0.08 |
0.07 |
|
Mean |
0.032 |
0.042 |
0.051 |
0.060 |
0.064 |
0.058 |
At lower nutrient or moisture availabilities or at higher light irradiances, leaves tended to be smaller, with higher leaf specific mass, density and thickness [19].
Higher leaf mass area is often associated with resilience to drought by reducing wilting risk [20].
M
Illlllllllll
/
A^
SO
^ ®^ ^
^
^
^ ^
0,0
^ ^ c^
Figure 1. Grain yield of chickpea samples
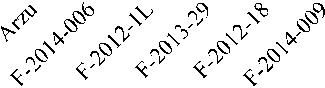
Grain yield of chickpea samples varied in the range of 1310-2030 kg/ha (Figure 1). The highest grain yield was formed by chickpea samples Sultan, Narmin, and Sechme L, while the lowest grain yield was formed by F-07-289 and Sanford samples. Grain yield of lentil samples varied in the range of 900-1450 kg/ha (Figure 2). The highest grain yield was formed by lentil samples F-2012-1L, F-2013-29, F-2012-18, and F-2014-009, while the lowest grain yield was formed by samples F-86-16,
LC006000296, and F-2013-22. According to Thangwana and Ogola (2012), grain yield of 3 Kabuli type (ICCV97314, ICCV92337, ICCV97306) chickpea samples varied in the range of 2110-2435 kg/ha and 2583-3914 kg/ha, and 4 Desi type (ICCV88202, ICCV97031, ICCV201, ICCV37) chickpea samples varied in the range of 950-1259 kg/ha and 3051-3812 kg/ha in summer and winter sowings [17].
• rH 600
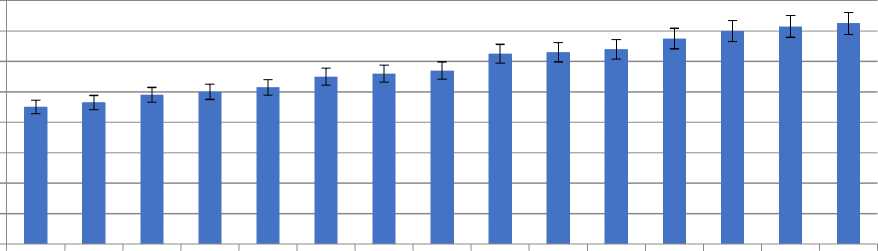

Figure 2. Grain yield of lentil samples
Kumar et al. (2023) reported that a favorable sowing period (15th November) for chickpea resulted in higher leaf parameters (leaf specific mass, leaf area index, net assimilation rate, pigment content) and seed yield [14].
Conclusion
Gas exchange parameters of chickpea and lentil samples were investigated. Chickpea samples Sanford, Sultan-2, Sultan, and Nazrin, and lentil samples F-2014-006, F-86-16, and F-2012-8 had higher gas exchange parameters. Pn was positively and significantly correlated with mesophyll conductance and water use efficiency, and negatively and significantly correlated with intercellular CO2 concentrations. An increase in leaf specific mass continued until pod formation-early ripening in chickpea samples. However, an increase in leaf specific mass of lentil samples continued until the pod formation stage. Grain yield was higher in chickpea samples Sultan, Narmin, and Sechme L, and in lentil samples F-2012-1L, F-2013-29, F-2012-18, and F-2014-009.
The authors declare that they have no conflicts of interest
