The boundaries of economic feasibility of tax incentives for innovative businesses

Author: Molodchik A.V., Sevastyanov V.P.
Journal: Вестник Пермского университета. Серия: Экономика @economics-psu
Section: Экономика и управление предприятием
Article in issue: 3 (22), 2014.
Free access
Innovative development of Russia and the region is impossible without well-developed innovation infrastructure, and, in particular without those elements of it that provide financial support to innovative businesses. A special role is played by the public institutions aimed at promoting the innovation activity. The provision of tax incentives for innovative businesses should be considered as the most recent form of the government support. This does not require the State to divert the existing financial resources but just not to take out the funds earned by the businesses. The article shows that there are objectively determined boundaries of the economic feasibility of tax privilege for income tax for innovative businesses, whereby a balance of state interests and needs of businesses that implement innovative development programs is provided. The authors have developed a method of rapid analysis of innovative programs of businesses, focused on practical application, that enables finding economic parameters under which the government expenditure for financial support of businesses is compensated by the increase in payments to the income tax budget from those businesses. This method allows for formation of a normative structure that defines the border lines for Tax Incentives Economic Feasibility for supporting the innovation activities of businesses. These normative values are advisable to lay in the local normative acts that govern activities of government agencies for financial support of businesses implementing the innovative programs. They are easy to use for conducting all sorts of competitions of the innovative businesses as well as for making decisions on the government support of modernization programs of production of industrial corporations.
Innovation, industry, innovation infrastructure, modernization, tax incentives, economic feasibility
Short address: https://sciup.org/147201428
IDR: 147201428 | UDC: 338.(470-4)
Text of the scientific article The boundaries of economic feasibility of tax incentives for innovative businesses
Nowadays innovation-based development is becoming more and more opportune for the Russian economy. The raw material orientation, wliich is traditional for the country, is going to be dominant for a rather long time, however there are problems and clianges arising in tliis sphere. The cost of raw materials extraction is continuously rising. Exploration and development of new deposits are reducing due to their high capital intensity. Raw material buyers both in Russia and abroad find new sources of raw materials and energy, develop innovative teclmologies tliat allow them to reduce the resource consumption, find alternative energy sources.
In tliis situation, it is important to understand under what conditions investments in innovative development are appropriate today and wliat economic gain they can offer. A search for conditions and parameters tliat determine the economic feasibility of investment in innovations is necessary.
A number of legislative acts steering the govermnent and business towards innovative development have been adopted in Russia [14, 17]. Legislative support for innovative activities of businesses is also pro- 13 Molodchik AJj, Sevastyanov V.P., 2014
''The work was executed with financial support from the Russian Foundation for Humanities (14-12-59013 Project).
vided at the regional level (e.g., in the Perm Territory) [3, 4, 9, 10, 16, 17]. ’
Innovative development is impossible without well-developed innovation infrastructure. Its role in the hierarchy of social and economic systems is well demonstrated in several research works [2, 6, 7].
A special role is played in innovation infrastructure by those elements tliat provide financial support for innovative activities of businesses - venture capital funds, private equity funds, various investment funds, private investors, as well as public institutions wliich provide financial support for innovative activities of businesses [1]. Most production managers believe tliat it state that plays the crucial role in increase in iimovative activity of industrial enterprises. And it refers not only to direct budgetary subsidies, but also to such forms of financial support as tax incentives for innovative businesses. It should be noted that, for example, in the Perm Territory, such support lias been provided for several years in the form of income tax incentives, wliich is considered to be quite a successful experience. Relevant legislative acts were adopted at the regional level [5]. Nevertheless, the present situa- tion in the innovation sector cannot be considered as successful.
We shall consider some statistical data on the present situation of innovation activity by the example of the Perm Territory, which is one of industrially developed regions of Russia [8, 12, 13].
The total amount of innovative products, works and services produced and performed in the region in 2010 is 59,551,200,000 rubles, which corresponds to 8.14% of the total amount of shipped products of businesses and organizations belonging to extractive and manufacturing industries, producing and distributing electric energy, gas and water. In 2012 this rate was slightly higher - 8.9%.
Among the organizations that have rendered accounts of their innovative activities, every fourth organization states that it has technological, procedural and product innovations. Among the businesses belonging to manufacturing industry, 26% of businesses implement technological innovations, 17% - procedural innovations and 19% - product innovations [18].
Adoption of innovative technologies is a long process, which sometimes lasts for many years. Statistics on duration of their adoption is given below [11]. Enterprises of the Perm Territory use about 5,300 of advanced manufacturing technologies. It took most of them (45.7% of the total number) six or more years to be adopted. 20.3% were adopted within 4-5 years, 22% - within 1-3 years, and only 12% of technologies, which makes one in ten, were adopted within one year [18].
It takes the least time to get advanced technologies adopted in communication and management (45.4% are implemented within the period that does not exceed three years) as well as in integrated management and control sphere (46%).
The degree of innovativeness of products manufactured by enterprises is reflected in an incremental price and profitability of sold products. Table 1 presents the data on profitability of Russian enterprises, which is calculated as a ratio of balance profit to amount of shipped products in percentage terms.
Table 1
Profitability (on shipment) of the Russian industry sectors (calculated by the “Development Center of the N a- tional Research University Higher School of Economics”)
|
2006 |
2007 |
2008 |
2009 |
2010 |
2011 |
2012 |
|
|
Total production |
14,8 |
14,4 |
11,6 |
9,9 |
12,6 |
12,1 |
11,3 |
|
Extraction of fuel and energy resources |
18,7 |
19,7 |
15,8 |
18,5 |
21,8 |
23,8 |
19,5 |
|
Chemical production |
11,0 |
13,7 |
18,6 |
6,3 |
12,2 |
15,7 |
15,6 |
|
Metallurgical production and production of ready-made metal products |
22,0 |
21,7 |
17,4 |
9,8 |
13,7 |
9,5 |
9,0 |
|
Production and distribution of electricity, gas and water |
4,9 |
5,7 |
3,9 |
7,6 |
11,0 |
3,2 |
5,1 |
|
Machinery and equipment manufacturing |
5,6 |
5,5 |
5,1 |
5,1 |
4,8 |
4,4 |
4,8 |
|
Production of transport facilities and equipment |
3,8 |
4,6 |
-1,5 |
-8,2 |
0,9 |
4,0 |
3,6 |
|
Wood processing and wood product manufacturing |
1,8 |
4,2 |
-3,2 |
-4,8 |
0,2 |
-0,4 |
2,5 |
|
Textile and clothing manufacturing |
1,6 |
1,4 |
0,7 |
0,4 |
0,5 |
2,3 |
3,4 |
|
Leather and leather goods manufacture, shoe making |
2,7 |
4,7 |
3,4 |
1,2 |
2,0 |
2,2 |
2,6 |
|
Food production |
5,4 |
4,9 |
4,8 |
5,9 |
5,7 |
4,2 |
5,3 |
High profitability is demonstrated mainly by enterprises of base material sector: mining operations, metal industry, petrochemical industry. Businesses of non-base material sector have much lower profitability. In Russia there is also a high percentage of unprofitable businesses whose profitability is below zero. According to the data from the Russian Federal State Statistics Service, in the first quarter of 2013 it amounted 36.5%. Moreover, it had increased by 1.5% compared with the same period of 2012.
Increase in price and profitability of products is possible by means of production modernization and improvement of its consumer properties. In its ton, it requires significant investments including the government support for innovative programs of businesses and corporations.
Statistical data of enterprises of the Perm Territory indicate that financial sources of expenditures on technological innovations are almost exclusively internal funds of businesses and organizations. The share of the federal budget is only 3.2%. The share of local budgets is less than 1%.
The data stated above give some idea of actually existing relations among parameters that characterize innovative activities of businesses. Using those relations as guidelines, we will study the most typical schemes of the government support for innovative businesses. The following shall be considered as such schemes:
-
- Income tax incentives for innovative businesses;
-
- Direct non-repayable government or public-private grants for implementation of innovative programs of businesses;
-
- Investments by buying blocks of stock of innovative businesses;
-
- Various combinations of ways of government and public-private support for innovative businesses.
It is obvious that today the most appropriate way of government support for innovative companies is provision of tax incentives for businesses that implement innovative programs. In this case, there is no need to divert financial resources of the state budget to support for innovative businesses; the only thing necessary is just not to take out a part of funds earned by companies that are to be transferred to the budget.
This article analyzes the above scheme. Research results for other schemes are given in other articles of the series of publications on economic feasibility of investment in innovations.
According to the given line of the research, tliis article is aimed at finding methods for determining boundaries of economic feasibility of income tax incentives for innovative businesses. It is necessary to find relatively simple-to-use methods of rapid analysis which will allow public authorities to make quick decisions on feasibility of providing tax incentives for businesses implementing innovative programs with no need for detailed study of those programs. These simple-to-use methods of expert assessments can be implemented into local regulations (for example at the regional level) governing a procedure of provision of financial support for innovative businesses. They are practical when conducting all sorts of tenders for innovative businesses seeking to get tax incentives [15], when distributing grants.
Analyzing the issue of provision of income tax incentives, it is necessary to consider the following: a scale of incentives sliall be such one that would allow for compensation for loss of current tax revenues (from businesses enjoying tax incentives) due to the future increase in their amount. In other words, it is necessary to find boundary economic parameters under which the amount of tax incentives provided will be covered by the amount of additional tax revenues from the recipient of incentives to the budget.
Instead of a statutory income tax rate (S) businesses are offered an incentive rate, which is lower tlian the current rate (Si
Innovative projects are implemented by businesses with different scales of production (large, medium and small). In order to obtain conclusions wliich are fair for businesses with different scales of production and sales activity, mainly relative values will be used. In tliis case, a universal rating of boundaries of economic feasibility of incentivization of businesses could be obtained.
Important parameters cliaracterizing an innovative project are the period of its development and implementation (in years) - (T), as well as the period of sales of new (modernized) products, i.e. a period for obtaining additional profit after the project is implemented. Essentially, it is a life cycle of a modernized (new) product created as a result of implementation of an innovative project. The number of years during wliich tliis new product is in demand and is sold at a relevant market is denoted by (Ti).
We shall consider a correlation between the cost of creation of innovations and possible profits from their implementation.
Let us assume tliat a business produces (and sells) V production units per year at a price of Z currency units a piece, at a self-cost of products of C currency units. In tliis case, profitability of the manufac-tmed products (r) defined as a ratio of profit to the self-cost of the product in unit fraction is equal to: Z-C r = —.
c
By implementing innovative programs, businesses acliieve reduction of self-cost of products, im- provement of their quality and other consumer properties. It is done for opportunity to sell better products at a liigher price (Zi> Z) over the next few years (Ti). Due to the increase in price of the new (modernized) products, the profit per unit will increase by the difference in prices Zi - Z.
Improvement in quality of products requires use of new materials, new teclmologies and methods of production, wliich, in its turn, requires additional costs. Therefore, improvement in quality, wliile simultaneously reducing the self-cost, is rather a difficult goal. If costs remain at the same level, profitability will in-
Z-C _ Zl-C crease from r = ~~ to q — ~ . We suggest tliat ratio of products profitability before and after implementation of innovations should be called ratio of in-rl crease in profitability of products (k =).
’r
If after implementation of innovations the selfcost of products also changes significantly (up to the level Cl), the profit margin will be equal to Г]
Zl-Cl~
Cl '
Change of the self-cost must be considered wliile calculating profit margin of the upgraded product. It is necessary to introduce a parameter (q = C i / rl
-
C) tliat takes tliis factor into account: к = Q.
r
When using these ratios, profit per unit (before implementation of innovations) is defined as multiplication (rC) while profit after implementation is (rkC).
In case there is lack of internal funds, a question of state support comes up, particularly of the support in the form of tax benefits, wliich partially cover needs of an enterprise for implementation of an innovative project.
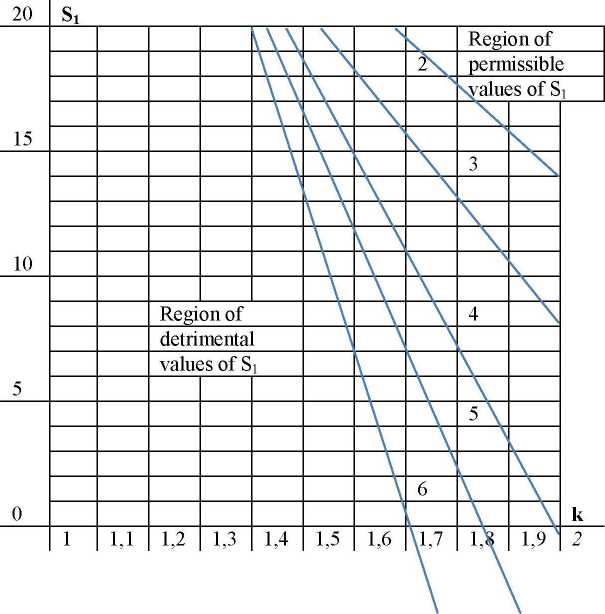
Let us consider a case when a company is provided with such a tax incentive. Instead of the cm-rent rate of income tax of 20% (S = 0,2), the company will pay it at the rate of Si The relief is granted for the period of innovations implementation. During tliis period (T) and the following years of sales of new products (Ti) the company will pay income tax at the rate of Ni = rCVTSi + rkCVTiS. The next step is to compare tliis amount of tax payments to that company would liave paid to the budget for the same period without introducing any innovative programs: N = rCV (T + Tlj S. If the amount of income tax payments to the budget in the case of innovations implementation is more than in the baseline case (without innovations implementation), the provision of tax relief is profitable for the state. To acliieve it, a relation Ni> N or rCVTSi + rkCVTiS > rCV(T+Ti)S must hold tme. After converting tliis expression we will obtain a formula for calculating boundary values of a preferential income tax rate for innovative companies: S^sjw yfl-ki] (1) If volume of production and sales of the upgraded product grows as a result of an innovative pro- gram implementation, it is necessary to provide the last formula with a coefficient f = Vi / V, wliich takes into account that Si > S 1+ Y(i-fk) If income tax is calculated using the above formula, the amount of tax revenue to the budget is the same for the baseline case and the case of an innovative program implementation. It is the limit by wliich income tax rate can be reduced without any loss for the state budget. The above formula is valid at constant prices and does not take an inflation factor into account. In actual practice, prices increase every year. The periods of development and implementation of innovations and subsequent sales of the new (upgraded) products often last many years. According to statistics, for most innovative projects the period of implementation is up to 6 years, the following period of sales is also up to 6 years. So we consider a period of total duration of up to 12 years. In case of such a long period, impact of inflation processes is significant. So it is necessary to take annual prices increase into account. Therefore, the following calculations are carried out basing on current prices increasing in line with the average aimual inflation rate. In Russia actual inflation rate amounted 6.45% in 2012 and 6.55% in 2013, so inflation is stuck at the level of 6.5%. To reflect the dynamics of inflationary price increase we will apply the factor of average amiual inflation rate: e = (1 + i /100). If inflation i = 6.5% per year, e = 1+ 6.5 / 100 = 1.065. The values of the multiplier wliich characterizes the price increase by year are presented in Table 2. Table 2 The price increase rate by year at the inflation level of 6.5% per year Years 1st 2nd 3rd 4th 5th 6th 7th 8th 9th 10th 11th 12th e = 1,0651 L0652 l,065J l,0654 1,065" 1,065° 1,065' 1,065s l,0659 l,06510 l,065n 1,06512 e = 1,0650 1,1342 1,2079 1,2865 1,3701 1,4591 1,5540 1,6550 1,7626 1,8771 1,9992 2,1291 The first line of the table is the number of the year from the start of an innovative program implementation. The second and tliird lines are for the quantity tliat characterizes increase in prices in the current year compared to the baseline (zero) year (before introduction of the innovation project). As the table shows, at the given level of inflation prices double every 11 years. Using the factor of average annual inflation rate e = (1 + i / 100) we write down an expression for calculating the amount of income tax (N) for the years of innovations implementation (T): N = rCVSie^ + rCVSieA2 +....+ rCVSjeAT = rCVSj (ел1+ел2+.. ,+елТ) Here 1,2... T is the exponent showing to wliich power inflation rate (e) is raised to determine the level of increase in prices in the first, second, ..., T-th years of implementation of an innovation program. Let us denote the cliain of coefficients reflecting annual inflationary price increases by E = ел1+ел2+.. ,+елТ. Then N = rCVSjE. The amount of payments of corporate income tax to the budget (NO for the years of sales of upgraded products (TO when profitability of the products increased by (k) times makes: Nj = rkCVSeA>1 + rCVSeA^ +....+ rCVSeAT+T1 = rCVS(eAT+1+eAT+2+...+eAT+T1). Let us denote the expression in brackets by Eb Then Nj = rkCVSEj In the baseline case (without introduction of any innovations) the expression for calculating amount of income tax (No) for the entire period under review (T + T1 years) is defined by correlation: No = rCVSeA1 + rCVSeA2 + ....+ rCVSeAT“ = rCVS(eA1+eA2+...+eAT+T1). Let us denote the sequence of summands in brackets by Eo. In tliis case the formula for calculating income tax in the baseline case will be as follows: No = rCVSEo. In order to prevent reduction of tax revenues to the budget, amount of income tax (in case of introduction of innovations) should not be lower than tax payments in the baseline case (without innovations). Tliis correlation is written as N + Nl> No, or: rCVSiE + rkCVSE, > rCVSEo. After converting tliis expression we will get a formula for calculating preferential income tax rate at wliich the condition of the break-even budget is fulfilled wliile participants of innovative activities are Г Eo-kEl provided with tax concessions: Si > S z Considering that Eo = E + E1 or El =Eo - E we obtain a more convenient expression (with fewer coefficients): Si > S Eo(l-kj E Tliis formula is valid for the cases when production volume of new (upgraded) products remains at the same level. We believe that the market for products manufactured by an enterprise is mainly divided among rival companies and sales gain is unlikely. If production volumes change significantly (after introduction of an innovative project), it is necessary to introduce a coefficient tliat takes tliis condition into account and is equal to the ratio between production volumes before and after the introduction of an innovative program: f = VI / V. In tliis case the expression for the calculating Si will be as follows: Si > S Eo (1—kf) E Economically viable rates of incentivization, wliile all other conditions being equal, depend on the ratio of increase in profitability of production tlirough introduction of an innovative program (k). Fig. 1 depicts a dependency diagram showing how irreducible preferential income tax rate (in %) depends on the value of increase in profitability of production in case of innovations introduction (k). к Si at T1=6 Si at Ti=5 Si at Tj=4 Si at T1=3 Si at Tj=2 1 20.0 20.0 20.0 20.0 20.0 1.05 17.3 17.9 18.3 18.8 19.2 1.1 14.7 15.7 16.7 17.6 18.4 1.15 12.0 13.6 15.0 16.4 17.7 1.2 9,3 11.4 13,3 15.2 16.9 1.25 6,7 9,3 11,7 14.0 16.1 1.3 4.0 7,1 10.0 12.8 15.3 1.35 1,3 5.0 8,4 11.5 14.5 1.4 0.0 2.8 6,7 10.3 13.8 1.45 0,0 0.7 5.0 9,1 13.0 1.5 0,0 0.0 3,4 7.9 12.2 1.55 0,0 0,0 1,7 6,7 11.4 1.6 0,0 0,0 0.0 5,5 10.6 1.65 0,0 0,0 0,0 4,3 9.9 1.7 0,0 0,0 0,0 3,1 9.1 1,75 0,0 0,0 0,0 1,9 8.3 1.8 0,0 0,0 0,0 0,7 7.5 1.85 0,0 0,0 0,0 0.0 6.7 1.9 0,0 0,0 0,0 0,0 6.0 1.95 0,0 0,0 0,0 0,0 5.2 2 0.0 0.0 0.0 0.0 4.4 Fig. 1. Area of admissible and unprofitable values of a rate of income tax Each line displays values of the maximum allowable quantities of preferential income tax rate depending on the ratio of profitability of production (k) considering the period of introduction of an innovative program T = 3 years and values of the period of sales of revised products - Tj - given in the table. The uppermost line (2) displays the case when the period of sales of upgraded products is 2 years. Below tliis line,, there are parameters for cases when tliis period is 3, 4, 5 and 6 years. Above the corresponding straight line, there is a range of acceptable values of preferential income tax rate. At these values the amount of revenue short-received by the budget due to provision of tax benefits is recovered. Below there is a region of unprofitable values Si. at wliich provision of benefits is not profitable for the state or a region. The resulting method of determining preferential income tax rate allows for performing a strategic rapid analysis of innovative projects presented by enterprises that expect to receive tax reliefs in order to implement their innovative programs. Tliis method is convenient since minimum information is enough for express-evaluation of any innovative project - it is only necessary to know tliree figures: increase in profitability of products manufactured by an enterprise wliich is acliieved during implementation of the project (k); the terms of development and implementation of the project (T); period of sales of the updated production (Ti), wliich characterizes its life cycle. Parameters that reflect rate of inflation, at its today’s level of 6.5% per year, are presented in a reference table 3, from wliich we can take coefficients necessary for calculating Eo and E depending on the combinations of the terms of implementation of innovative projects (T) and upgraded product sales period (T )• ’ ’ Table 3 Coefficients E and Eo at the annual inflation rate of 6,5 % Years of implementation (T) E Years of upgraded products sales (Td 1 2 3 4 5 6 1 1.0650 2.1992 3.4072 4.6936 6.0637 7.5229 9.0769 2 2.1992 3.4072 4.6936 6.0637 7.5229 9.0769 10.7319 3 3.4072 4.6936 6.0637 7.5229 9.0769 10.7319 12.4944 4 4.6936 6.0637 7.5229 9.0769 10.7319 12.4944 14.3716 5 6.0637 7.5229 9.0769 10.7319 12.4944 14.3716 16.3707 6 7.5229 9.0769 10.7319 12.4944 14.3716 16.3707 18.4998 As mentioned above, the values used in the calculations (ratio of increase in profitability, preferential income tax rate) are relative. Therefore, the re ceived findings and methods of calculation are simple-to-use and universal. They are suitable for any scale of investment and valid for businesses with different scale of production: small, medium and large. In essence, the relations received are standards tliat determine boundaries of economic feasibility of incentivization for innovative activities. It is advisable to include these regulatory values in local normative acts governing activities of govermnent agencies in financial support for innovative development of enterprises. For example, table 4 shows boundary values of preferential income tax rate for all possible combinations of a project implementation periods (T up to 6 years) and an updated product sales periods (Ti up to 6 years) at the given value of the parameter k, which characterizes the increase in profitability of updated products sales. Table 4 Boundary values of preferential income tax rate (Si) acceptable at the ratio of increase in profitability of upgraded products к = 1,3 (in percentage terms) Years of implementation Years of sales the updated products 1 2 3 4 5 6 1 13.6% 6.8% 0.0% 0.0% 0.0% 0.0% 2 16.7% 13.2% 9.5% 5.5% 1.2% 0.0% 3 17.7% 15.3% 12.8% 10.0% 7.1% 4.0% 4 18.2% 16.4% 14.4% 12.3% 10.0% 7.6% 5 18.6% 17.0% 15.4% 13.6% 11.8% 9.8% 6 18.8% 17.4% 16.0% 14.5% 12.9% 11.2% The above methods allow us to find boundaries of break-even incentivization provided for enterprises implementing innovative programs by the state. However, taking a decision on granting tax exemptions the state can expect a liigher level of profitability rather than just recoupment of a project. For example, it can aim at getting an additional ruble of tax revenues in the future per each mble tliat wasn’t received by the budget during the years of granting tax benefits. In this case, it is necessary to introduce an index of required level of profitability (d) into the formula for calculating preferential income tax rate (Si). It is к Si at Ti=6 Si at Ti=5 Si at Tj=4 Si at Tj=3 Si at Tj=2 1.4 20.0 20.0 20.0 20.0 20.0 1.45 18.0 19.6 20.0 20.0 20.0 1.5 15.3 17.4 19.3 20.0 20.0 1.55 12.7 15.3 17.7 20.0 20.0 1.6 10.0 13.1 16.0 18.8 20.0 1.65 7.3 11.0 14.4 17.5 20.0 1.7 4.7 8.8 12.7 16.3 19.8 1.75 2.0 6.7 11.0 15.1 19.0 1.8 0.0 4.5 9.4 13.9 18.2 1.85 0.0 2.4 7.7 12.7 17.4 1.9 0.0 0.2 6.0 11.5 16.6 1.95 0.0 0.0 4.4 10.3 15.9 2 0.0 0.0 2.7 91 15.1 Fig. 2. Area of admissible values of a preferential rate of income tax which the necessary level of profitability is reached Thus, the range of permissible values of preferential income tax rate (Si), which provide a yield of set as a certain number of monetary units making up the budget revenue (in the form of income tax) per each monetary unit received by an innovative company in the form of tax benefit. ' Eo (d-k) s, >s к + —-— (5) E J Fig. 2 shows a finitary spread of straight lines, each of which cuts the range of permissible values of preferential income tax rate (Si), at which the required level of profitability (d) is achieved, which is equal in tliis example to 1.3 ruble of tax revenues per every ruble of provided tax benefits. 1.3 monetary units per one unit of investment, at the duration of revised production sales of 6 years is locat- As a result of studying the issue the following conclusions can be drawn: - Providing tax incentives should be considered as the most appropriate form of government support for innovative companies under current conditions. It does not require diversion of the state’s existing financial resources, as businesses keep a part of earned resources which previously had to be transferred to the budget. - There are objectively determined boundaries of economic feasibility of income tax incentives for innovative businesses, which provide a balance between public interests and needs of businesses implementing innovative development programs. - Preferential income tax rate should be determined with the proviso that government expenditures on financial support for enterprises are compensated by an increase in payments of income tax from those enterprises to the budget. This is the bottom boundary to which income tax rate can be reduced without any losses for the state budget. - The above principle is implemented in the method for rapid analysis of innovative programs of enterprises offered in this paper. It is focused on practical application and can be recommended for use at the level of regional public institutions and structures aimed at innovative activity stimulating. - The ratios we get using this method are standards that determine boundaries of economic feasibility of investment to innovations. It is reasonable to include these normative values in local regulations governing activities of government agencies in financial support for innovative activity of enterprises. They are practical when conducting all sorts of competitions among innovative businesses, when distributing budgetary funds on a competitive basis, when taking decisions on giving grants to innovative enterprises. - In case of providing tax incentives, it is only necessary for the state to ensure verification of the compliance of business activities with the obligations, which can be done through periodical monitoring of the level of actual profitability presented in official accounting and statistical reports of the businesses.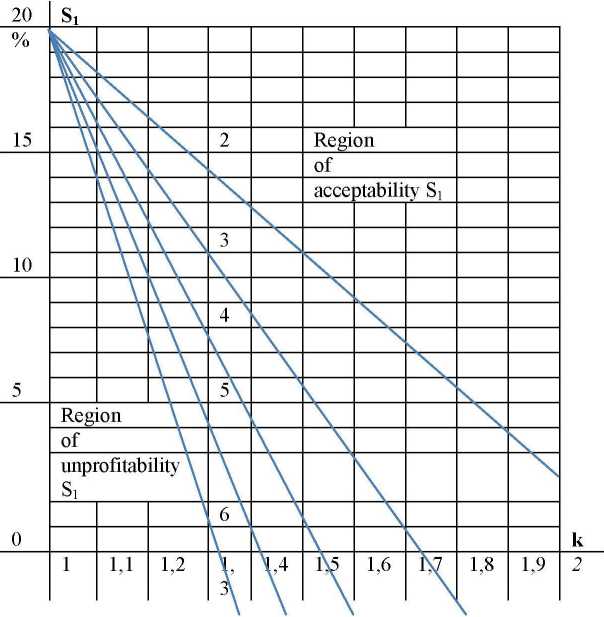
References The boundaries of economic feasibility of tax incentives for innovative businesses
- Akhmetova M.I., Persky Yu.K. Finansovaya sostavlyayuschaya infrastrukturnogo obespecheniya innovatsionnogo protsessa [The financial component of the infrastructure to ensure the innovation process]. Materialy 2-oi Mezhdunarodnoi nauchno-prakticheskoi konferentsii "Shumpeterovskie chteniya" [Proceedings of the 2nd International Scientific and Practical Conference "Schumpeter's readings"]. Perm: Izd-vo Perm. nats. issled. politechn. un-ta, 2012. 382 p. [247-253]
- Zhulanov Ye.E., Persky Yu.K. Vzai-modeistvie gosudarstva i promyshlennogo komplexa regiona: modeli ierarkhicheskogo analiza i upravleniya. [Interaction between the state and industry of the region: models of hierarchical analysis and management]. Ekaterinburg, Institut ekonomiki UrO RAN, 2011.
- Zakon Permskogo kraya ot 02.04.2008 № 220-PK "O nauke i nauchno-tekhnicheskoi politike v Permskom kraye". [The Law of the Perm Krai dd. 02.04.2008 No. 220-PK "About Science and Science and Technology Policy in the Perm Krai"].
- Zakon Permskogo kraya ot 11.06.2008 № 238-PK "Ob innovatsionnoi deyatelnosti v Permskom kraye". [The Law of the Perm Krai dd. 11.06.2008 No 238-PK "About innovative activity in the Perm Krai"].
- Zakon Permskogo kraya ot 30.08.2011 № 1685-296 "O nalogooblozhenii v Permskom kraye". [The Law of the Perm Krai dd. 30.08.2001 No. 1685296 "On taxation in the Perm Krai"].
- Ierarkhicheskiy analiz socialno-economicheskikh sistem: podhody, modeli, prilozheniya. [Hierarchical analysis of socio-economic systems: approaches, models, applications]. A multi-author monograph under the general editorship of Doctor of Economics, prof. Yu.K. Persky in 2 parts. Perm: Izd-vo Perm. nats. issled. politechn. un-ta, 2012.
- Persky Yu.K., Dubrovskaya Yu.V. Garmonizatsia interesov ekonomicheskikh subjektov v sisteme ierarkhicheskikh vzaimosvyazei ekonomiki. [Harmonization of the interests of economic entities in the hierarchical relationships of the economy]. Zhurnal economicheskoi teorii. [Journal on Economic Theory]. Ekaterinburg, Institut ekonomiki UrO RAN, No.1 2011.
- Promyshlennoe proizvodstvo Permskogo kraya. [Industrial production of the Perm Krai]. Local agency of the Federal State Statistics Service of the Perm Krai. Perm, 2013.
- Postanovlenie Zakonodatelnogo sobrani-ya Permskogo kraya ot 17.06.2010 № 2169 "O sozdanii postoyanno deystvuyuschey rabochei gruppy po modernizatsii I innovatsiyam v ekonomike Permskogo kraya" [Resolution of the Legislative Assembly of the Perm Krai dd. 17.06.2010 No. 2169 "On creation of a permanent working group on modernization and innovation in the economy of the Perm Krai"].
- Postanovlenie Pravitel'stva Permskogo kraja ot 10.08.2011 N 549-p «Ob utverzhdenii Polozhenija o predostavlenii subsidij iz bjudzheta Permskogo kraja v celjah vozmeshhenija chasti zatrat na vypolnenie nauchno-issledovatel'skih i opytno-konstruktorskih rabot [Resolution of the Government of the Perm Krai dd. 10.08.2011 No. 549-p "About Approval of the Regulations on provision of grants from the Perm Territory budget in order to recover a part of expenditures on carrying out research, development and experimental work"].
- Sevastyanov V.P. Dinamika innovatsion-nogo razvitiya predpriyatiy Permskogo kraya. [Dynamics of innovative development of the Perm Krai enterprises]. Vestnik Permskogo natsionalnogo issledovatelskogo politekhnicheskogo universiteta. Sotsi-alno-ekonomicheskie nauki. [Bulletin of the National Research Polytechnic University. Socio-economic sciences]. Perm: Izd-vo PNIPU, No. 16 (41), 2012. P. 174-194.
- Sotsialno-ekonomicheskoe polozhenie Permskogo kraya. Yanvar'-dekabr' 2013 goda. Ofitsi-alnoe izdanie. [The socio-economic situation of the Perm Krai. January-December 2013. Official publication]. Local agency of the Federal State Statistics Service of the Perm Krai. Perm, 2013.
- Statisticheskiy ezhegodnik Permskogo kraya. [Statistical Yearbook of the Perm Krai]. Local agency of the Federal State Statistics Service of the Perm Krai. Perm, 2013.
- Strategia innovatsionnogo razvitiya Ros-siyskoy Federatsii na period do 2020 goda. Utverzhde-na rasporyazheniem Pravitelstva Rossiyskoy Federatsii ot 08.12.2011 № 2227-p. [The strategy of innovative development of the Russian Federation for the period until 2020. Approved by Government Executive Order of the Russian Federation dd. 08.12.2011 No. 2227-p].
- Ukaz gubernatora Permskogo kraya ot 22.10.2010 № 81 "O provedenii kraevogo konkursa "Promyshlennyi lider Prikamya" [Decree of the Governor of the Perm Krai dd. 22.10.2010 No. 81 "On holding a regional competition "Industrial Leader of the Kama region"].
- Ukaz gubernatora Permskogo kraya ot 01.11.2010 № 83 "Ob osnovnykh napravleniyakh nauchnoi I nauchno-tekhnicheskoi politiki Permskogo kraya". [Decree of the Governor of the Perm Krai dd. 01.11.2010 No. 83 "On main directions of scientific and technical policy in the Perm Krai"].
- Ukaz Prezidenta Rossiyskoy Federatsii № 878 ot 18.06.2012 "O sovete pri prezidente Ros-siyskoy Federatsii po modernizatsii ekonomiki I mod-ernizatsionnom razvitii Rossii" [Decree of the President of the Russian Federation "On the presidential council of the Russian Federation on economic modernization and innovative development of Russia» No. 878 dd. 18.06.2012].
- Elektronny resurs http://permstat.gks.ru/ sayt Territorialnogo organa Federalnoy sluzhby gosu-darstvennoy statistiki po Permskomu krayu. Local Agency of Federal State Statistics Service of the Perm Territory. Perm 2013. Availably at: http://permstat. gks.ru/ (Accessed: 04.06.2014).
- Territorial'nyj organ gosudarstvennoj statistiki po Permskomu kraju [Territorial authority of the state statistics on Perm Krai]. Availably at: http://permstat.gks.ru/(Accessed: 04.06.2014).
