The effect of frequency and volume of leisure-time physical activity on body fatness of employed females

Author: Rakic S., Kuki F., Cherepov E.A., Dopsaj M., Schelgacheva K.B., Cuk I.
Journal: Человек. Спорт. Медицина @hsm-susu
Section: Спортивная тренировка
Article in issue: 2 т.22, 2022.
Free access
Aim. The aim of this study was to investigate the association between the selected body composition variables and frequency and volume of LTPA (Leisure time physical activity - F-LTPA and V-LTPA) in employed females; and which indicator of LTPA relates better to body composition. Moreover, it aimed to determine the differences between employed females who report different levels of LTPA. Materials and Methods. The sample of 535 employed females (19.8-45.3 years) were collected. Body height, body mass, body mass index, body fat mass, percent body fat, and body fat index were assessed via bioelectric impedance analyzer. International physical activity questionnaire (IPAQ) was used to assess F-LTPA and V-LTPA. Sample was divided in four groups relative to F-LTPA and V-LTPA: sedentary, seldom active, moderately active, and very active. Correlation analysis and analysis of variance were used to analyze the associations and differences between LTPA groups. Results. Small to moderate correlation occurred between body fatness measures and both LTPA modalities, with higher correlations being with V-LTPA. Females who reported higher F-LTPA and V-LTPA had lower amounts of BM, BFM, PBF, and BFMI than those who reported to lower values of LTPA. The biggest differences occurred in BFMI and PBF. Conclusion. Frequency of four to five LTPA sessions or 150-300 minutes per week may be needed for acceptable level of body fatness, while to attain fitness level of body fatness that is higher than just acceptable, females may need to be active even more frequently or more than 300 minutes per week.
Physical activity, body composition, women’s health, index variables
Short address: https://sciup.org/147238184
IDR: 147238184 | UDC: 612.01 | DOI: 10.14529/hsm220209
Влияние частоты и объема физической активности в свободное время на уровень жира у работающих женщин
Цель. Целью данного исследования было изучить связь между выбранными переменными состава тела и частотой и объемом физической активности (F-LTPA и V-LTPA) в свободное время у работающих женщин, а также определить, какой показатель физической активности лучше коррелирует с составом тела. Кроме того, целью исследования было установить различия между работающими женщинами, которые сообщают о разных уровнях физической активности. Материалы и методы. В исследовании приняли участие 535 работающих женщин (возраст 19,8-45,3 лет). С помощью анализатора биоимпеданса у женщин определяли рост, массу тела (BM), индекс массы тела, массу (BFM) и процент (PBF) жира, а также индекс жира в организме (BFMI). Для оценки частоты и объема физической активности использовали международный опросник физической активности (IPAQ). Участниц исследования поделили на четыре группы в зависимости от частоты и объема физической активности: малоподвижные, редко активные, умеренно активные и очень активные. Для оценки сходств и различий между показателями групп использовали корреляционный и дисперсионный анализы. Результаты. Небольшую и умеренную корреляции обнаружили между содержанием жира в организме и объемом/частотой физической активности, при этом более высокая корреляция обнаружена с объемом физической активности. Женщины, которые в ходе опроса сообщили о более высоких значениях частоты и объема физической активности, имели более низкие значения переменных BM, BFM, PBF и BFMI, чем те, у кого частота и объем физической активности были ниже. Самые большие различия установлены для переменных BFMI и PBF. Вывод. Физическая активность от 4 до 5 раз в неделю или 150-300 минут в неделю необходима для поддержания приемлемого уровня жира в организме, при этом для достижения спортивной формы частота и объем физической активности должны быть еще выше (более 300 минут в неделю).
Text of the scientific article The effect of frequency and volume of leisure-time physical activity on body fatness of employed females
С. Ракич1, , Ф. Кукич2, , Е.А. Черепов3, , М. Допсай3,4, , К.Б. Щелгачева3, , И. Чук5, , 1Физио Груп, Белград, Сербия 2Полиция Абу Даби, АбуДаби, Объединенные Арабские Эмираты 3Южно-Уральский государственный университет, Челябинск, Россия 4Белградский университет, Белград, Сербия 5Университет Сингидунум, Белград, Сербия
Leisure time physical activity (LTPA) is fundamental to people’s health, their proper functioning and quality of life, as it affects nearly every organ system of the body [17]. It has been shown that increased LTPA is associated with lower body mass index (BMI), percentage of body fat (PBF), and reduced waist circumference (WC) [9]. Lower levels of physical activity coupled with, or, more probably, followed by an increased level of abdominal body fatness give rise to the proclivity to cardiovascular diseases, obesity, and the metabolic syndrome [7].
Body composition consists of multiple ele- ments and it has been considered a sensitive indicators of health and physical fitness [5]. Skeletal muscle mass (SMM) is the main movement potential, while fat mass (FM) is the biggest ballast tissue. Both, SMM and FM quickly adapt to the amount physical activity and nutrition, which reflects in an increase or decrease in their volume [18]. In that regard, the monitoring of body composition is important for determining a trend of changes in these components regardless of whether the phenomenon is observed globally as a trend (WHO 2000), or each individual separately [12]. However, using the BM and absolute measures of SMM and FM in tracking the changes in body composition can often be misleading. |For example, taller people are normally heavier and may possess higher amounts of SMM and FM than shorter people may merely based on the difference in body sizes. Therefore, SMM and FM need to be relativized to either BM (i. e., percent of body fat [PBF] and percent of skeletal muscle mass [PSMM]) or BH (skeletal muscle mass index [SMMI] and body fat mass index [BFMI). This would provide a body volume independent and body size independent measures of body composition that would allow tracking the adaptations in body composition over time and comparison across the age, sexes, profession and socio-economic status [8, 18].
Physical activity level can be easily misinterpreted as it contains several domains, such as occupational, domestic or recreational [19]. For example, research has shown that the LTPA of craftsmen and factory workers was lower, although not significantly, than in professionals, administrators, executives and scientists [19]. At the same time, the occupational activity was higher, suggesting that people with lower-status occupations were less likely to participate in the LTPA [15].
There are numerous other factors, such as gender, race, marital status, geographical location and culture, that can affect the levels of LTPA, body fat and its distribution, and, ultimately, the nutritional status [6]. In Serbia in 2013, 56.3% adults aged 20 years and above were overweight and 21.2% were obese [2]. Despite the fact that the socioeconomic status has been associated with nutritional status, most authors suggested that an investigation should include the examination of the individual aspects such as sex, education, occupation and income [8].
Adequate physical exercise is particularly important aspect of life for the working-age population of females [12, 15]. Besides professional engagement, the majority of females are traditionally burdened by responsibilities related to family care and household chores and have less and less free time [11]. Although, a smaller number of studies examined the influence of the frequency and volume of LTPA body composition of females, it remains inconclusive if frequency and volume of LTPA are significant moderators of body composition in working females. Moreover, it remains unclear whether frequency or volume are more significant, and what is their relationship with various indicators of body composition. Therefore, the aim of this study was to investigate the association between the selected body composition variables and indicators of LTPA in employed females; and which indicator of LTPA relates better to body composition. Moreover, it aimed to determine the differences between employed females who report different levels of LTPA.
Methods
Participants
The study included a sample 535 adult females with the full time employment status. The main characteristics of the sample were: Age = 33.9 ± 6.3 years, BH = 168.4 ± 6.3 cm, BM = 67.6 ± 13.1 kg, and BMI = 23.88 ± 4.63 kg/m2. All participants were healthy, with no acute and chronic illness, as well as without injuries of the locomotor apparatus that could affect the LTPA and assessment. Prior to testing, both topic and purpose of the research were presented in detail to all participants and participants were assessed after they consented to participate. The research was carried out in accordance with the conditions of Declaration of Helsinki. The Ethics Committee of the Faculty of Sport and Physical Education, University of Belgrade approved the study (484-2).
Leisure-time Physical Activity
Body composition assessment
Body composition assessment was realized in the Research Laboratory of the Faculty of Sport and Physical Education, University of Belgrade, using standardized method of the multichannel bioelectrical impedance analysis In Body 720 (Biospace, Co., Ltd, Korea), which had previously proved very reliable (ICC = 0.97) [1]. The assessment was conducted in accordance with previously reported procedures [14, 18]. Participants were instructed to fast the night before the measurements and not to conducted strenuous physical activity during the last two days before the measurement. On the day of the assessment they had to stand still for a minimum of five minutes prior to the measurements to maintain proper distribution of body fluids. The resulting sheet was printed out for each participant, providing body composition measures, BM, BFM, and SMM. These basic variables were used to calculate the variables of interest for the purposes of this study. Four variables were calculated to indicate either the relative quantity (%) of a certain body tissue or the quantity of the tissue relative to body size (i. e., kg/m2), indicating tissue quality. Overall, nutritional status (body voluminosity) was assessed by BMI, tissue quantity was examined through PBF, while tissue quality was examined through BFMI. The rationale for using measures of relative tissue quantity (volume independent) and quality (size independent) was based on the fact that total body mass and absolute amounts of body fat and muscle mass highly depend on body size [9, 18].
Statistical data analysis
The data was analyzed using the following statistical package for social sciences (IBM,
SPSS, version 20.). The Kolmogorov-Smirnov test was used to assess the normality of the data distribution. The association between examined variables and the modalities of LTPA was calculated by the Pearson’s correlation coefficients. According to Cohen, the correlation values range from r = 0.10–0.29 (small), r = 0.30–0.49 (medium) and r = 0.50–1.0 (large) (Sullivan & Feinn, 2012). To test differences between significant correlation coefficients regarding the F-LTPA and V-LTPA, correlations were converted into a z -score using Fisher's r -to- z transformation. The differences between groups regarding each indicator of LTPA were determined by one-way analysis of variance (ANOVA). In case of significant main effects, an additional LSD post-hoc test was performed. Eta squared ( η 2 ) was also calculated together with ANOVA’s, where the values of the effect sizes 0.01, 0.06, and above 0.14 were considered small, medium, and large, respectively. The level of significance for all analyses was set at p < 0.05. The magnitude of the between-group differences was calculated as the ratio of the difference in mean scores to standard deviation, following the formula: ES = = (M 2 – M 1) / SD, where M 1 and M 2 were the means of the groups investigated and the SD was a pooled standard deviation of compared groups. The magnitude of the effects was defined as follows: small = 0.2, moderate = 0.6, large = 1.2 and very large = 2.0 [16].
Results
Descriptive statistical indicators of body composition of the total sample tested are shown in Table 1.
Table 2 shows the correlation between the body composition parameters and indicators of LTPA along with the differences between correlation coefficients of F-LTPA and V-LTPA within each variable of body composition. Higher correlation coefficients occurred in BFM, PBF, BMI, and BFMI in V-LTPA compared to F-LTPA.
Regarding the differences between the body composition parameters in relation to the F-LTPA, significant differences occurred in BM ( F (3,531) = 13.77, η 2 = 0.07, p < 0.01), BMI ( F (3,531) = 16.48, η 2 = 0.09, p < 0.01), BFM ( F (3,531) = 23.43, η 2 = 0.12, p < 0.01), BFMI ( F (3,531) = 22.63, η 2 = 0.11, p < 0.01), and PBF ( F (3,531) = 28.11, η 2 = 0.14, p < 0.01). Specifically, for these variables, sedentary females had significantly higher values than all other groups (Table 3). Furthermore, seldom active females had lower BFM and BFMI than very active, and lower PBF than moderately and
Table 1
|
Variables |
BM (kg) |
BMI (kg/m2) |
BFM (kg) |
SMM (kg) |
PBF (%) |
BFMI (kg/m2) |
|
|
LTPA |
Mean ± SD |
Mean ± SD |
Mean ± SD |
Mean ± SD |
Mean ± SD |
Mean ± SD |
|
|
< Ph H Ph |
Sedentary |
71.93 ± 15.71 |
25.55 ± 5.48 |
24.24 ± 11.33 |
26.19 ± 3.89 |
32.02 ± 8.66 |
8.65 ± 4.13 |
|
Seldom active |
66.1 ± 10.4 |
23.28 ± 3.71 |
18.9 ± 7.61 |
26.02 ± 3.36 |
27.74 ± 7.2 |
6.7 ± 2.87 |
|
|
Moderately active |
64.08 ± 11.3 |
22.42 ± 4.06 |
16.57 ± 8.84 |
26.54 ± 4.33 |
24.46 ± 8.32 |
5.84 ± 3.28 |
|
|
Very active |
62.69 ± 8.59 |
22.09 ± 3.06 |
15.22 ± 7.19 |
25.74 ± 3.17 |
23.37 ± 7.67 |
5.41 ± 2.7 |
|
|
< Ph H > |
Sedentary |
71.99 ± 16.00 |
25.52 ± 5.59 |
24.19 ± 11.50 |
26.26 ± 3.93 |
31.86 ± 8.75 |
8.62 ± 4.19 |
|
Seldom active |
69.06 ± 12.11 |
24.78 ± 4.41 |
22.44 ± 9.08 |
26.03 ± 4.61 |
31.38 ± 7.42 |
8.10 ± 3.47 |
|
|
Moderately active |
64.93 ± 9.57 |
22.78 ± 3.48 |
17.45 ± 7.29 |
26.10 ± 2.91 |
26.12 ± 7.17 |
6.17 ± 2.74 |
|
|
Very active |
61.20 ± 7.99 |
21.26 ± 2.13 |
13.73 ± 5.15 |
25.85 ± 3.38 |
21.64 ± 6.34 |
4.78 ± 1.72 |
|
|
Whole sample |
67.62 ± 13.05 |
23.88 ± 4.63 |
20.17 ± 9.85 |
26.12 ± 3.68 |
28.41 ± 8.56 |
7.17 ± 3.63 |
|
Table 2
|
Variable |
F-LTPA |
V-LTPA |
Z-score |
p – 2 tail |
|
BM (kg) |
–0.251** |
–0.302** |
1.796 |
0.073 |
|
BMI (kg/m2) |
–0.270** |
–0.337** |
2.383 |
0.017* |
|
BFM (kg) |
–0.324** |
–0.389** |
2.365 |
0.018* |
|
SMM (kg) |
–0.016 |
–0.032 |
0.539 |
0.590 |
|
PBF (%) |
–0.361** |
–0.422** |
2.258 |
0.024* |
|
BFMI (kg/m2) |
–0.318** |
–0.388** |
2.543 |
0.011* |
Table 3
|
Between-group comparison |
BM (kg) |
BMI (kg/m2) |
BFM (kg) |
PBF (%) |
BFMI (kg/m2) |
|
|
Sedentary |
Seldom active |
5.84* |
2.27* |
5.34* |
4.28* |
1.95* |
|
3.4–8.3 |
1.4–3.1 |
3.5–7.2 |
2.7–5.8 |
1.3–2.6 |
||
|
Moderately active |
7.85* |
3.12* |
7.68* |
7.57* |
2.82* |
|
|
4.4–11.3 |
1.9–4.3 |
5.2–10.2 |
5.4–9.7 |
1.9–3.7 |
||
|
Very active |
9.24* |
3.45* |
9.03* |
8.65* |
3.25* |
|
|
5.6–12.9 |
2.2–4.7 |
6.4–11.7 |
6.4–10.9 |
2.3–4.2 |
||
|
Seldom active |
Moderately active |
2.02 |
0.85 |
2.34 |
3.29* |
0.87 |
|
–1.4–5.4 |
–0.4–2.1 |
–0.18–4.9 |
1.1–5.4 |
–0.1–1.8 |
||
|
Very active |
3.41 |
1.18 |
3.69* |
4.38* |
1.30* |
|
|
–0.2–7.0 |
–0.1–2.5 |
1.0–6.4 |
2.1–6.7 |
0.3–2.3 |
||
|
Moderately active |
Very active |
1.39 |
0.33 |
1.35 |
1.09 |
0.43 |
|
–2.9–5.7 |
–1.2–1.9 |
–1.8–4.5 |
–1.6–3.8 |
–0.7–1.6 |
||
Descriptive statistics relative to indicators of LTPA
Correlation analysis and Fishers’ r-to-z transformation
Results of the ANOVA and LSD post-hock analysis for F-LTPA
very active groups of females. The SMM and SMMI were the same across the LTPA groups.
Considering F-LTPA, relative differences and effect sizes revealed the largest difference between sedentary and very active females in BFMI, which was followed by the differences between the same groups in BFM, and PBF
(Fig. 1). The difference in BFMI and BFM was about three times larger than the difference in BM, while the difference in PBF was about two times larger than in BM.
Considering the V-LTPA (Table 4), sedentary females had lower BM (F(3,531) = 17.68, η2 = 0.09, p < 0.01), BMI (F(3,531) = 23.14, η2 = 0.12, p < 0.01), BFM (F(3,531) =32.64, η2 = 0.16, p < 0.01), BFMI (F(3,531) = 32.82, η2 = 0.16, p < 0.01), and PBF (F(3,531) = 42.60, η2 = 0.19, p < 0.01). Specifically, sedentary and seldom active females had higher BM, BMI, BFM, BFMI, and PBF than moderately and very active females, while moderately active had higher values than very active females.
The largest relative differences occurred between sedentary and very active in BFMI, BFM and PBF, with the largest being in BFMI (Fig. 2). Similarly as in F-LTPA, differences in BFMI and BFM were three times larger and in PBF two time larger than those obtained in BM.
Discussion
The first aim of this study was to investigate the relationship between body composition and indicators of LTPA in working females. To that end, small to medium statistically significant negative correlations occurred between frequency and volume of -LTPA and BMI, BFM, PBF, and BFMI, whereby correlations with V-LTPA were significantly stronger. The second aim was to determine whether females who are physically more active had lower levels of body fatness. In that regard, BM and BMI as well as absolute and relative measures of body fatness were higher
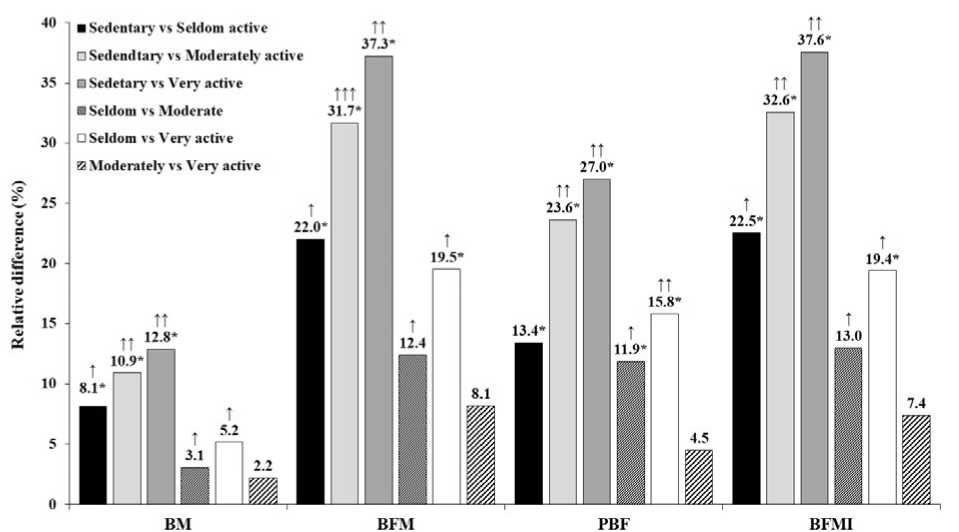
Fig. 1. Relative differences (%) and belonging effect sizes in body fatness between F-LTPA groups
Table 4
Results of the ANOVA and LSD post-hock analysis for V-LTPA
|
Between-group comparison |
BM (kg) |
BMI (kg/m2) |
BFM (kg) |
PBF (%) |
BFMI (kg/m2) |
|
|
Sedentary |
Seldom active |
2.93 |
0.74 |
1.75 |
0.48 |
0.51 |
|
–0.2–6.1 |
–0.4–1.8 |
–0.5–4.0 |
–1.5–2.4 |
–0.3–1.4 |
||
|
Moderately active |
7.07* |
2.74* |
6.74* |
5.74* |
2.45* |
|
|
4.5–9.6 |
1.8–3.6 |
4.9–8.6 |
4.2–7.3 |
1.8–3.1 |
||
|
Very active |
10.79* |
4.26* |
10.46* |
10.22* |
3.84* |
|
|
7.5–14.1 |
3.1–5.4 |
8.1–12.9 |
8.2–12.3 |
3.0–4.7 |
||
|
Seldom active |
Moderately active |
4.14* |
1.20* |
4.98* |
5.26* |
1.94* |
|
1.0–7.3 |
0.9–3.1 |
2.7–7.3 |
3.3–7.2 |
1.1–2.8 |
||
|
Very active |
7.86* |
3.52* |
8.70* |
9.74* |
3.33* |
|
|
4.1–11.7 |
2.2–4.8 |
5.9–11.5 |
7.4–12.1 |
2.3–4.3 |
||
|
Moderately active |
Very active |
3.73* |
1.52* |
3.72* |
4.48* |
1.39* |
|
0.4–7.1 |
0.4–2.7 |
1.2–6.1 |
2.4–6.5 |
0.5–2.3 |
||
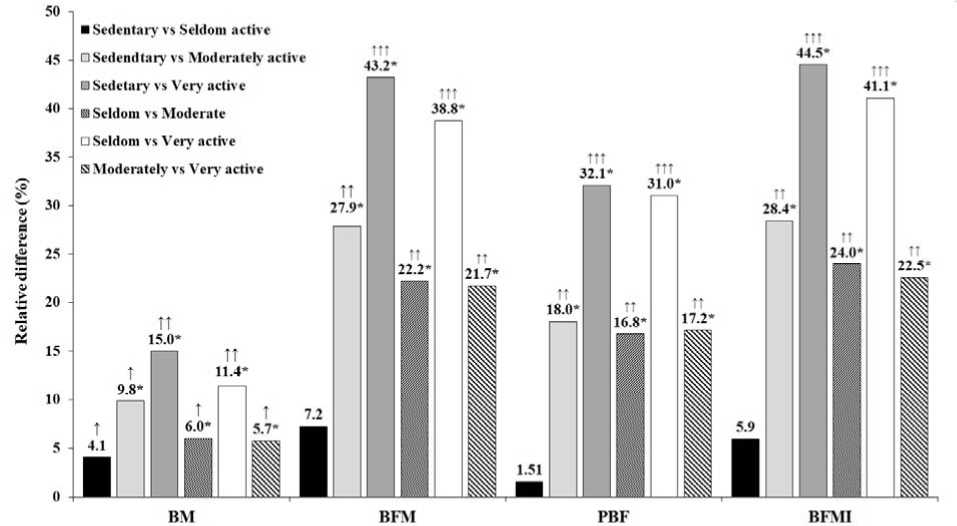
Fig. 2. Relative differences (%) and belonging effect sizes in body fatness relative to V-LTPA
as the frequency and volume of LTPA were lower. Females who reported to be seldom active had lower BFM, PBF, and BFMI than those who reported to be sedentary. Moreover, those who reported to be moderately active and very active had lower body fat values than those who reported to be seldom active. Finally, considering the V-LTPA, those who reported to be very active had lower BM, BMI, BFM, PBF and BFMI than moderately active females. Therefore, the results provide a clear evidence the frequency of four to five training sessions or volume of 150– 300 minutes per week may be sufficient for the maintenance of the optimal quantity of body fatness.
Considering the descriptive data for seldom active females, their mean BMI and PBF (see Table 1) belong to acceptable levels (i.e., normal range for BMI = 18.0–25.0 and for PBF = 25.0– 31.0%) (REF). This suggests that frequency of two to three physical activities in leisure time per week could be in general sufficient for acceptable level of body fatness. However, translated into volume (i. e., duration of these one to two sessions), this seems less likely to be true in larger number of cases as mean BMI and PBF of seldom active females relative to V-LTPA were at the upper limit of acceptable. This indicates that one or two training sessions or 150 minutes per week could be considered as minimal necessary amount of LTPA for body fatness not to be overly increased, which is preferable to sedentary [13].
However, for maintaining body fatness about the middle of the range of acceptable or lower, frequency and volume of LTPA may need to be increased to four to five sessions or 150–300 minutes per week [8, 18]. For further improvements or for having PBF with the fitness range (i. e., PBF = 21–14%), frequency and volume of LTPA may need to increase over five times or over 300 minutes per week, which is in accordance with Powell et al. [13].
Beside the effects of LTPA modalities on body composition, different amounts of LTPA have had multiple health benefits as well as increased work productivity and life expectancy [10]. Liu et al. [10] conducted the meta-analysis including 126 studies and found recommended physical activity by WHO contributed about 7% reduction in cancer risk, mainly attributed to protection against breast cancer and colorectal cancer. It is of note however, that increased body fatness negatively affect health as well [5]. This means that LTPA may have double role in health prevention and improvement by reducing health risks related to sedentary behavior and by reducing body fatness related to lack of LTPA.
Conclusion
Our results agree in accordance with the quote “some is good, more is better”. Frequency and volume of LTPA of even two sessions per week or up to 150 minutes per week seem to be sufficient for working females to have lower amounts of body fats than those who are sedentary. How- ever, to obtain the acceptable level of body fatness, frequency of four to five LTPA sessions or 150–300 minutes per week may be needed, while to attain fitness level of body fatness higher than just acceptable, females may need to be active even more frequently or more than 300 minutes per week. Therefore, employed females who are moderately or very active are more likely to meet body fat levels that correspond to good health and good or improved physical fitness.
References The effect of frequency and volume of leisure-time physical activity on body fatness of employed females
- Aandstad A., Holtberget K., Hageberg R. et al. Validity and Reliability of Bioelectrical Impedance Analysis and Skinfold Thickness in Predicting Body Fat in Military Personnel. Military Medicine, 2014, vol. 179 (2), pp. 208-217. DOI: 10.7205/MILMED-D-12-00545
- Boricic K., Vasic M., Grozdanov J. et al. Results of the National Health Survey of the Republic of Serbia, 2013. The Institute of Public Health Of Serbia "Dr Milan Jovanovic Batut", 2014, pp. 978-986.
- Carrick-Ranson G., Hastings J.L., Bhella P.S. et al. The Effect of Lifelong Exercise Dose on Cardiovascular Function During Exercise. Journal of Applied Physiology, 2014, vol. 116 (7), pp. 736-745. DOI: 10.1152/japplphysiol.00342.2013
- Craig C.L., Marshall A.L., Sjöström M. et al. International Physical Activity Questionnaire: 12-Country Reliability and Validity. Medicine and Science in Sports and Exercise, 2003, vol. 35 (8), pp. 1381-1395. DOI: 10.1249/01.MSS.0000078924.61453.FB
- Després J.P. Body Fat Distribution and Risk of Cardiovascular Disease: An Update. Circulation, 2012, vol. 126 (10), pp. 1301-1313. DOI: 10.1161/CIRCULATI0NAHA.111.067264
- Dyck D.V., Cerin E., De Bourdeaudhuij I. et al. International Study of Objectively Measured Physical Activity and Sedentary Time with Body Mass Index and Obesity: IPEN Adult Study. International Journal of Obesity, 2015, vol. 39 (2), pp. 199-207. DOI: 10.1038/ijo.2014.115
- Gleeson M., Bishop N.C., Stensel D.J. et al. The Anti-Inflammatory Effects of Exercise: Mechanisms and Implications for the Prevention and Treatment of Disease. Nature Reviews. Immunology, 2011, vol. 11(9), pp. 607-615. DOI: 10.1038/nri3041
- Kukic F., Dopsaj M., Nikic M.B. et al. Educational Status, Leisure-Time Physical Activity and Body Bomposition in Serbian Adult Population. Iranian Journal of Public Health, 2020, vol. 49 (3), pp. 606-608. DOI: 10.18502/ijph.v49i3.3163
- Kukic F., Koropanovski N., Jankovic R. et al. Association of Sex-Related Differences in Body Composition to Change of Direction Speed in Police Officers While Carrying Load. International Journal of Morphology, 2020, vol. 38 (3), pp. 731-736. DOI: 10.4067/S0717-95022020000300731
- Liu L., Shi Y., Li T. et al. Leisure Time Physical Activity and Cancer Risk: Evaluation of the WHO's Recommendation Based on 126 High-Quality Epidemiological Studies. British Journal of Sports Medicine, 2016, vol. 50 (6), pp. 372-378. DOI: 10.1136/bjsports-2015-094728
- Loginov S.I. Daily Physical Activity and Sedentary (Inactive) Behaviour of Adults from Surgut. Human. Sport. Medicine, 2019, vol. 19, no. 4, pp. 70-77. DOI: 10.14529/hsm190409
- Perevalina E.A., Shestakov M.M., Laggao S.A. Effect of Different Fitness Programs on the Morphological Parameters of Women Aged 30-40 Years. Human. Sport. Medicine, 2019, vol. 19, no. S1, pp. 18-23. DOI: 10.14529/hsm19s102
- Powell K.E., Paluch A.E., Blair S.N. Physical Activity for Health: What Kind? How Much? How Intense? On Top of What? Annual Review of Public Health, 2011, vol. 32 (1), pp. 349-365. DOI: 10.1146/annurev-publhealth-031210-101151
- Rakic S., Dopsaj M., Djordjevic-Nikic M. et al. Profile and Reference Values for Body Fat and Skeletal Muscle Mass Percent at Females, Aged From 18.0 to 69.9, Measured by Multichannel Segmental Bioimpedance Method: Serbian Population Study. International Journal of Morphology, 2019, vol. 37 (4), pp. 1286-1293. DOI: 10.4067/S0717-95022019000401286
- Salmon J., Owen N., Bauman A. et al. Leisure-Time, Occupational, and Household Physical Activity Among Professional, Skilled, and Less-Skilled Workers and Homemakers. Preventive Medicine, 2000, vol. 30 (3), pp. 191-199. DOI: 10.1006/pmed.1999.0619
- Sullivan G.M., Feinn R. Using Effect Size - Or why the P Value is Not Enough. Journal of Graduate Medical Education, 2012, vol. 4 (3), pp. 279-282. DOI: 10.4300/JGME-D-12-00156.1
- Vega R.B., Konhilas J.P., Kelly D.P., Leinwand L.A. Molecular Mechanisms Underlying Cardiac Adaptation to Exercise. Cell Metabolism, 2017, vol. 25 (5), pp. 1012-1026. DOI: 10.1016/ j.cmet.2017.04.025
- Vukovic M., Kukic F., Cvorovic A. et al. Relations Between Frequency and Volume of Leisure-Time Physical Activity and Body Composition in Police Officers. Research Quarterly for Exercise and Sport, 2020, vol. 91 (1), pp. 47-54. DOI: 10.1080/02701367.2019.1646391
- Zogg S., Dürr S., Maier S. et al. Relationship Between Domain-Specific Physical Activity and Different Body Composition Measures in a Working Population. Journal of Occupational and Environmental Medicine, 2014, vol. 56 (10), pp. 1074-1081. DOI: 10.1097/J0M.0000000000000224
