The electrical conductivity evaluation of nanocoating on intelligent building structure elements

Author: Lisyenkova L.N., Nosova L.S., Budnikova O.A., Titova J.O.
Journal: Nanotechnologies in Construction: A Scientific Internet-Journal @nanobuild-en
Section: The study of the properties of nanomaterials
Article in issue: 4 Vol.17, 2025.
Free access
Introduction. Flexible elements made from various materials such as films, papers and geotextiles, coated with an electrically conductive coating containing carbon nanoparticles, have the potential for creating intelligent structures. To rationally choose, design, and apply electrically conducting components, it is necessary to objectively assess their behavior throughout the life cycle of these objects. Currently, there are no objective methods for evaluating such components. Methods and tools are needed that can not only evaluate initial electrical conductivity values of components but also predict dynamics of changes over time. Methods and Materials. The samples were tested under cyclic multi-axial stretching conditions. After each stretch, the strain, thickness, and electrical resistance of the samples were measured. Different materials were selected for the study, including films, nonwoven fabrics, and fabrics which differ in composition, structure, and properties. A composition with carbon nanoparticles was applied to the materials using screen printing. Results and discussion. The tests showed that the irreversible part of deformation of the sample ranged from 8% to 75%, while thickness varied from 6% to 100% depending on the structure of materials. Electrical resistance ranged from 25 Ohms to 5 KOhms, depending on test parameters and composition of coating-substrate composite. Correlation analysis confirmed strong correlation between electrical resistivity and sample deformation with correlation coefficient ranging between 0.6 and 0.78. An approximation was used to derive empirical equations that can be used to predict the reliability of flexible, electrically conductive elements under cyclic stretching conditions, which simulate operating conditions. Conclusion. A comparative analysis of test results under these conditions allowed us to recommend nonwoven fabrics and fabrics with a thickness of 0.5–0.7 mm for use as flexible electrically conducting elements. This method is recommended for objective assessment of changes in the properties of these components in intelligent building structures.
Building structure, electrically conductive composition, carbon nanoparticle, electrical resistance, deformation, cyclic stretching
Short address: https://sciup.org/142245494
IDR: 142245494 | DOI: 10.15828/2075-8545-2025-17-4-401-414
Text of the scientific article The electrical conductivity evaluation of nanocoating on intelligent building structure elements
Original article
Лисиенкова Л.Н., Носова Л.С., Будникова О.А., Титова Ж.О. Оценка электропроводности нанопокрытий интеллектуальных элементов строительных конструкций. Нанотехнологии в строительстве. 2025;17(4):401–414. – EDN: FBNRZK.
Currently, there is an increasing interest in the creation, production and application of intelligent materials (or smart) in many industries, including the construction industry. Intelligent materials are becoming more in demand by architects and builders in the design and construction of modern buildings and structures [1–2].
The term “intelligent building materials” is currently not specified and is not interpreted unambiguously in various sources [3–4]. However, it is possible to iden-
tify the main aspects that determine the essence of these materials:
– firstly, these are materials obtained during the physical or chemical modification of a micro- or macrostructure;
– secondly, these are materials that have the ability to change their initial properties according to a given algorithm when exposed to external factors.
The scientific and information search revealed several directions in the intelligent building materials development; they can be briefly grouped into several groups:
THE STUDY OF THE PROPERTIES OF NANOMATERIALS
– traditional materials modification with nanoscale particles to obtain functional materials with predefined properties (for example: nanodisperse plasticizers for self-sealing concretes, mineral nano-additives for corrosion resistance and crack resistance of concrete mixtures [5–7];
– the introduction of electro-, piezo- and other conductive nanoparticles into the morphological structure of materials, ensuring the ability of materials to respond to external signals and adapt to various factors due to changes in geometric, mechanical, and physical properties (for example: layered multifunctional materials, which include electro-, thermally conductive, thermochromic, and photochromic cladding materials; self-healing concretes, smart glass, self-cleaning fibrous materials, etc.) [8];
– gradient structure materials creation, which, unlike traditional monolithic building materials, will be as close as possible to natural materials (for example: nano-wood, nano-plaster, etc.) [9–10];
Flexible elements made of various sheet materials (films, organic glass, paper, trapezoidal sheet, etc.), on which electrically conductive layers or coatings are applied, are of interest for obtaining intelligent structures. Nano-colors use electrically conductive nanoparticles of various compositions and structures: powdered or flake-like silver, carbon nanotubes, or polymer-containing nanoscale particles [11]. Various printing technologies are used for nanocoating, which make it possible to create various electronic microcircuits on structural elements [12].
Efficient production and use of intelligent materials requires an objective assessment of their properties and quality prediction at the stages of the life cycle of objects. This need is primarily due to the new properties of materials, the lack of standardized methods and means for an objective assessment of their behavior in production and operation.
The problem of the lack of a methodology for predicting patterns of changes in the properties of smart materials requires in-depth research to obtain a new knowledge base. The development of objective research methods will ensure a rational choice of nanoparticle formulations or functional components for material modification and will allow predicting their behavior under given conditions. Therefore, the research topic is relevant and has scientific and practical interest in the field of building materials science. The object of research is the properties of flexible electrically conductive elements for intelligent structures. The subject of the study is a method for evaluating the electrical conductivity of flexible structural elements.
A scientific information search revealed the lack of objective methods and tools for researching and predicting the flexible printed elements properties under the influence of factors of production and operation. Well-known standardized and original test methods make it possible
to evaluate mainly the limiting semi-cyclic characteristics of flexible elements upon their destruction (for example: tensile strength to rupture, hardness during deformation, etc.) [13–14]. To evaluate the deformation properties, single-cycle characteristics are determined under tension, compression, bending, and torsion [15–17].
However, the results of such studies are not informative enough and do not allow us to evaluate the objects behavior in real conditions at various stages of the life cycle. It is obvious that during production and operation, the objects under study experience not only single-cycle force effects (for example, when applying a nanocoating by printing, the substrate material is subjected to a single compression to create contact with electrically conductive nanoparticles). The longer stage of operation is associated with the effects on the small elements but cyclically repeated external mechanical, physical, chemical or combined factors (force, heat, atmospheric effects, moisture, temperature, solutions, melts, etc.).
It should be noted that cyclic stretching and compression lead to a change in the initial materials structure at the micro and macro levels without breaking chemical bonds. The structural organization changes of nanoparticles and the accumulation of residual deformation in the elements will affect the geometric parameters (thickness, density, etc.) of the electrically conductive layers and, as a result, a change in the set electrical conductivity of the element [18–19].
Methods and tools are needed that will provide not only an assessment of the initial values of the specified properties of nanomaterials, but also allow predicting patterns of changes in properties during operation. This approach will ensure the optimal selection of nanoparticle formulations, taking into account the operating conditions. A number of studies have substantiated the methodology for studying the deformation properties of flexible materials and layered polymers of various compositions and structures under conditions of multiaxial cyclic stretching and compression [20–21]. The methodology is based on an integrated approach to the study of the deformation characteristics of flexible materials and polymers. The reversible and irreversible parts of the total deformation are assumed as characteristics [22].
The purpose of the research is to study the patterns of changes in the electrical conductivity of printed elements for intelligent building structures under conditions of cyclic multiaxial stretching.
To achieve this goal, the following tasks were solved: – to test electrically conductive elements samples for cyclic stretching;
– process the results of measuring the electrical resistivity of the samples;
– to analyze the patterns of changes in the electrical conductivity of printed elements under cyclic stretching conditions.
THE STUDY OF THE PROPERTIES OF NANOMATERIALS
METHODS AND MATERIALS
Characteristics of research objects
Polymer materials of various structures and production methods (film, fibrous, and woven) were used as sealable substrate materials for applying semiconductor nanocompositions. Polymer film is made of polyethylene terephthalate (PET-E) with a thickness of 140±15.0 microns, manufactured according to GOST 24234-80 «Poly-ethylene terephthalate film. Technical specifications».
Fibrous nonwoven fabrics obtained by adhesive and mechanical bonding methods, manufactured in accordance with GOST 25441-90 “Glued cushioning cloths. General technical conditions”, GOST R 53225-2008 “Geotextile materials. Terms and definitions”. Nonwoven fabrics are used in various construction fields to increase the load-bearing capacity and form stability of various structures, and retain their properties at high and low temperatures and in aggressive environments [23, 24].
Reinforced fabric for protection from fire and elevated temperatures with an oil- and water-repellent finish (OWRF) by impregnating fibers with fluorocarbon compounds according to GOST 11209-2014 “Fabrics for special clothing. General technical requirements. Test methods”. The characteristics of the materials are shown in Table 1.
Nanocoating was applied by flexographic printing as an electrical conductor for samples of materials (Table 1). For this purpose, conductive ink series 26-8203 Conductive Carbon BF02 (trademark Sun Chemical Circuits Touchkey Conductive Ink, USA) with carbon nanoparticles was used. (manufacturer “Sun Chemical Corporation” USA). The main characteristics of the ink are: volume density 1.2 g/cm 3 ; resistivity – 53 mOhm× cm; viscosity at a temperature of 25°C – 10-12 Pa×c [11, 25].
Methods of studying structural and geometric characteristics
In the research we used standard methods to prepare samples for testing and evaluate the parameters and geometric properties of the objects, as shown in Table 2. Before testing, the samples were kept for 12 hours in normal atmospheric conditions (temperature 20±3 °C and relative humidity 65±5% according to the psychrometer) in accordance with GOST 10681-75. Tests were conducted under the same conditions.
Methods of applying an electrically conductive coating to materials
Various methods of applying electrically conductive compositions are known: deep, offset, stencil, flexo-
graphic, and inkjet [26, 27]. The method of screen printing for coating is used in the work. The ink is applied to the surface of the sealed materials (Table 1) through printing plates (impressions). The forms were printed on a manual ARGON type carousel screen printing machine [28]. The thickness of the conductive coating after drying is 0.1 + 0.05 mm.
Assessing electrical conductivity methods
Electrical resistance was measured with a digital multimeter RESANTA LT-181 in accordance with the GOST 3345-76 methodology «Cables, wires and cords. A method for determining the electrical insulation resis-tance» The technical characteristics of the multimeter are shown in Table 3. A scheme for measuring the resistance of the studied objects is presented in [29].
Methods for studying the elements deformation under cyclic multiaxial tension
The tests were performed on an automated device [37].
The main characteristics of the device:
-
– the maximum load per sample is up to 4.0 kg;
-
– the maximum number of cycles per test period is 255 cycles;
-
– the maximum loading (rest) time in a cycle is 255 seconds;
-
– the maximum number of test periods is not limited;
-
– absolute measurement error: ± 10 microns;
-
– the accuracy of measuring the amount of sample sagging is 2%;
-
– type of sensor for measuring the movement and thickness of the sample: differential photoelectric;
-
– motor type: stepper motor, 220 V;
-
– linear movement speed: 2...5 mm/s;
– dimensions of the device: 350×250×400 mm, weight is not more than 5 kg.
– clamping rings for fixing the sample D = 25, 40, 60 mm. (Fig. 1, a).
– removable indenter tips d = 15, 20, 25, 35, 55 mm (Fig. 1, b).
– sample size of at least 10×10 cm, thickness 0.01...5.0 mm; (Fig. 1, a);
– loads weighing from 0.2...4.0 kg.
The theoretical analysis of deformation and calculated formulas of stresses under multiaxial tension of flexible shells are presented in [29]. Based on experimental data, empirical curves of changes in the amount of sample sagging during loading and resting h ( t ) are constructed. The proportion of reversible and irreversible deformations was calculated using the formulas:
– the proportion of conditional irreversible (residual) deformation:
THE STUDY OF THE PROPERTIES OF NANOMATERIALS
ε irr = h i / h max , i ≥ 30, (1)
where h i is the average value of the last 10 measurements of the sample sagging after rest, mm; hmax is the value of the sample sagging under load, mm;
– the proportion of conditional rapidly reversible deformation:
ε re = ( h max – h 1 ) / h max , (2)
where h 1 is the value of the first measurement of the sample sagging value after removing the load, mm.
Methods of processing test results
The experimental results were processed in accordance with GOST R 8.736-2011 «The State system for ensuring
the uniformity of measurements. The direct and multiple measurements. Methods of processing measurement results. Basic provisions», GOST R ISO 16269-4-2017 «Statistical methods. Statistical representation of data. Part 4. Detection and treatment of emissions». Based on the results of the experimental data, the main statistical characteristics were determined using the well-known formulas presented in Table 4.
To check the uniformity of the dispersion and reproducibility of the experiment with the same repetition of experiments, the value of the Kochren criterion G k was calculated. The model adequacy of the process under study was checked by the Fischer criterion F p . If the calculated value of the Fischer criterion F p is less than the tabular value F m , then the hypothesis of adequacy was not rejected.
According to the criteria for evaluating accuracy according to the theory of mathematical statistics, the reli-
Table 1. Characteristics of nanocoating materials (series 26-8203 Conductive Carbon BF02)
|
No. |
Indicator |
Sample 1 |
Sample 2 |
Sample 3 |
Sample 4 |
Sample 5 |
|
PET-E film, GOST 24234 |
Nonwoven fabric art. 45519 GOST 25441 |
Geotextile GP200 art. 02003 GOST R 53225 |
Geotextile GP300 art. 02005 GOST R 53225 |
Fabric art. 15406a-B GOST 11209 |
||
|
1 |
Composition |
Polyethylene Terephthalate (PET) |
80% polyester fiber, 20% bicomponent fiber% |
Polyester fiber – 100% |
Polyester fiber – 100 |
95% cotton fiber, 5% polyamide + antistatic thread; |
|
2 |
Manufacturing method |
Melt extrusion with subsequent orientation, thermal fixation and cooling |
Adhesive with subsequent thermal calendering |
Needle-punched method followed by thermal fixation (thermal calendering) |
Woven – twill weave, OWRF finishing |
|
|
3 |
Thickness, mm / (microns) |
0.14 ±0.015 / (140 ±15,0) |
0.36±0.05 |
0.67±0.10 |
2.23±0.3 |
0.47±0.07 |
|
4 |
Surface / (Bulk) density, g/m2 / (kg/m3) |
196 / (1390-1400) |
50±10 |
200±40 |
300±45 |
265±0,52 |
|
5 |
Modulus of elasticity, not less than, MPa |
137–147 |
1.0–2.0 |
4.5–7.5 |
10–12 |
0.5 • 10–3 |
|
6 |
Tensile strength, MPa (N/5cm) |
157–172 MPa |
40–50 N/5 cm |
300±36 N/5 cm |
450±54 N/5 cm |
650±32.5 N/5 cm |
|
7 |
Elongation at break, not less than, % |
70–100 |
20–30 |
50–60 |
120–160 |
20–30 |
|
8 |
Specific volumetric electrical resistance, Ohms • cm, not less |
1x10¹⁴ |
– |
– |
– |
– |
|
9 |
Operating temperature, °C |
–70…+150 |
–65…+80 |
–65…+80 |
–65…+80 |
+250* (ignition temperature) |
|
10 |
Shrinkage, % (at 155°C) no more |
3 |
2 |
2 |
2 |
3 |
THE STUDY OF THE PROPERTIES OF NANOMATERIALS
Table 2. Standards used for research methods
|
No. |
Performed research |
GOST number |
Document name |
|
1 |
Sampling of nonwoven fabric |
GOST 13587-77 |
Nonwoven fabrics and nonwoven piece products acceptance rules and sampling method |
|
2 |
Sampling of film material |
GOST 24234-80 |
The film is polyethylene terephthalate. Technical conditions |
|
3 |
Sampling fabric |
GOST 20566-75 |
Textile fabrics and pieces. Acceptance rules and sampling method |
|
4 |
GOST 29104.0-91 |
Technical fabrics. Acceptance rules and sampling method. |
|
|
5 |
Sample preparation for testing |
GOST 10681-75 |
Textile materials. Climatic conditions for conditioning and testing of samples and methods of their determination |
|
6 |
Determination of thickness, mm |
GOST 12023-2003 |
Textile materials and products made from them. Thickness determination method |
|
7 |
Assessment of structural characteristics: surface density g/m2; length, mm; width, mm |
GOST 3811-72 |
Textile materials. fabrics, nonwovens, canvases, and pieces. Methods for determining linear dimensions, linear and surface densities |
|
8 |
GOST 15902.2-2003 (ISO 9073-2:1995) |
Nonwoven fabrics. Methods for determining structural characteristics |
|
|
9 |
Humidity determination, % |
GOST 3816-81 |
Textile fabrics. Methods for determining hygroscopic and water-repellent properties |
Table 3. Main characteristics of the RESANTA DT-181 multimeter
|
No. |
The measured parameter |
Units of measurement |
Measuring range |
Error rate, % |
|
1 |
Alternating voltage |
Volt |
200–750 |
1.5 |
|
2 |
Constant voltage |
Volt |
2–1000 |
0.8 |
|
3 |
DC power |
Ampere |
up to 10 |
1.2 |
|
4 |
Resistance |
MOm |
up to 2 |
1.0 |
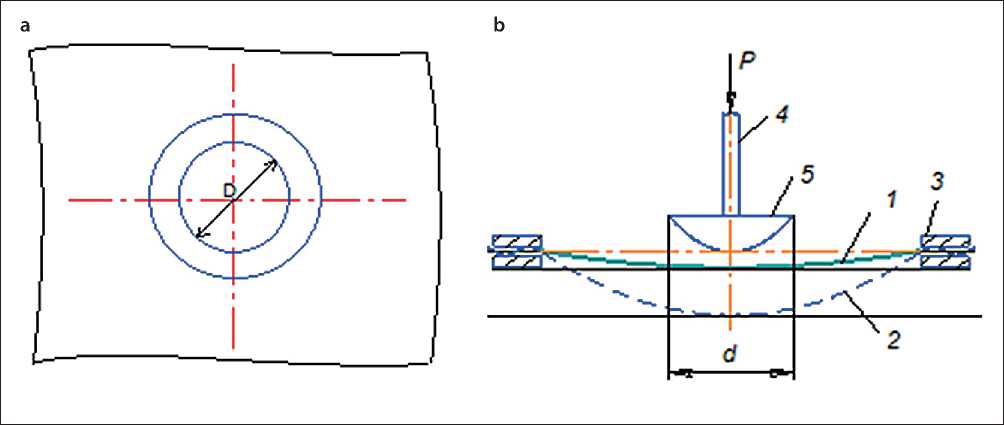
Fig. 1. The shape of the sample material (a) and the test scheme (b): the position of the sample: D – the sample working size, mm; 1 – before stretching, 2 – under load, 3 – clamping device, 4 – indenter, 5 – removable tip [29, 30]
THE STUDY OF THE PROPERTIES OF NANOMATERIALS
Table 4. Processing of experimental results
|
No. |
Statistical characteristics |
Calculation formulas |
|
1 |
Arithmetic mean |
х = --Ух |
|
2 |
Variance |
л n 2 s2—^-^) |
|
3 |
Standard deviation |
V 77-1 |
|
4 |
Coefficient of variation |
C = y-100% |
|
5 |
An absolute mistake |
m = — |
|
6 |
Relative error |
^ = ^•100% |
|
7 |
The Kochren Criterion |
max 5>2 |
|
8 |
The Fisher Criterion |
77 _ ^ad ~ 2 |
ability of experimental results was assumed provided that the relative standard deviation did not exceed 10% (with a confidence of 0.95), and the coefficient of variation did not exceed 10%.
RESULTS
The prepared samples were tested for multiaxial cyclic stretching with the following parameters in the experimental part:
– diameter of the working area of the test sample D = 40 mm;
– diameter of the indenter base, d = 25 mm;
– tensile force Rc , = 10 N;
– the stretching time of the sample theat = 5 s.
– the rest time of the sample in each stretching cycle t relax = 5 s;
– the total loading period of the sample n = 50–300 cycles, measurements were carried out after 50, 100, 150, 200, 250, 300 loading cycles.
The essence of the test consisted in cyclic multiax-ial stretching of the sample fixed in a contour template
(Fig. 1, b), and measuring the amount of sagging of the sample during loading and rest. After each stretching period, the thickness and electrical resistance of the samples were measured.
Based on the primary results of measuring the amount of sample sagging after stretching cycles, the total deformation was automatically calculated in the software built into the device, the calculation method is presented in [29, 30]. The strain components were calculated using formulas (1) and (2). The results are shown in Table 5. The thickness measurement results are shown in Table 6. The standard deviation of the results was 0.2–3.0%; the variance was 0.05–0.20; the coefficient of variation was 10–12%. In some cases, the coefficient of variation has reached 16–20%, which is acceptable for nonwovens due to the greater unevenness of their structure compared to films and fabrics.
The resistance of the conductive coating was measured after every 50 load cycles without removing the sample from the template. The measurement results are presented in Table 7.
DISCUSSION
Analysis of the test results of Samples 1–5 (Tables 1, 5–7) showed that the greatest amount of residual deformation is observed after 50 cycles of stretching. Diagrams of changes in the components of deformation and resistance of samples are clearly shown in the diagrams in Figure 2.
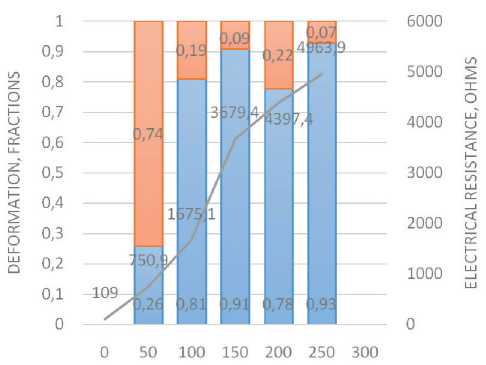
The maximum residual deformation value of 0.74 (fractions) after 50 cycles is a nonwoven fabric with an initial thickness of 0.36 mm with an electrically conductive layer. Further loading from 250 to 300 cycles led to the destruction of the sample (Table 5). Maximum increase in electrical resistance (8-10 times) in Sample 2, it was observed after the first 50 stretching cycles (Table 7, Fig. 2, b).
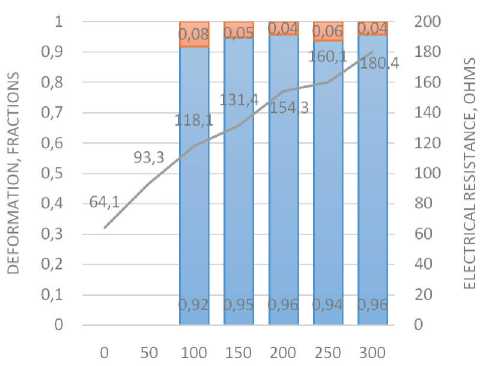
After 100 cycles, Sample 3 (initial substrate thickness 0.67 mm) exhibited an insignificant increase in residual deformation of 8–10% (Table 1, rows 5–7). Further stretching cycles did not lead to an increase in residual deformation, which is explained by the sample’s relaxation and elastic recovery. The electrical resistance of Sample 3 increased by 35-40% after 50 cycles, and by almost 2 times after 300 cycles of stretching (Table 7). It should be noted that Sample 3 has a relatively uniform increase in resistance in the range of 15-20% after each stretching period (Fig. 2, c).
After 50 stretching cycles of Sample 4, made on a 2.23 mm thick nonwoven cloth (Table 1), the residual deformation was 0.35 (fractions), further stretching practically did not lead to an increase in the residual deformation of this sample (Table 5). The electrical resistance of Sample 4 increased from 25 Ohms to 41 Ohms, respec-
THE STUDY OF THE PROPERTIES OF NANOMATERIALS
Table 5. The results of the evaluation of the samples deformation with an electrically conductive layer during cyclic stretching
|
No. |
Sample |
Cycle |
Deformation, fractions |
Variance of the sample mean, S b 2, mm2 |
Coefficient of variation, Cv, % |
Error of experience, m x , % |
|
|
reversible |
irreversible |
||||||
|
1 |
PET-E film, GOST 24234 |
50 |
0.89 |
0.11 |
0.03 |
6.66 |
0.23 |
|
100 |
0.93 |
0.07 |
0.04 |
17.39 |
0.31 |
||
|
150 |
0.89 |
0.11 |
0.05 |
11.65 |
0.42 |
||
|
200 |
0.88 |
0.12 |
0.06 |
13.12 |
0.53 |
||
|
250 |
0.91 |
0.09 |
0.05 |
15.52 |
0.5 |
||
|
300 |
0.92 |
0.058 |
0.04 |
13.79 |
0.36 |
||
|
2 |
Nonwoven fabric art. 45519 GOST 25441 |
50 |
0.26 |
0.74 |
0.13 |
1.83 |
2.04 |
|
100 |
0.81 |
0.19 |
0.12 |
7.1 |
2.12 |
||
|
150 |
0.91 |
0.09 |
0.11 |
5.2 |
2.01 |
||
|
200 |
0.78 |
0.22 |
0.09 |
4.3 |
1.67 |
||
|
250 |
0.93 |
0.07 |
0.11 |
16.1 |
2.12 |
||
|
300 |
-* |
* at 300 cycles, sample destruction |
|||||
|
3 |
Geotextile GP200 art. 02003 GOST R 53225 |
100 |
0.92 |
0.08 |
0.04 |
8.80 |
0.46 |
|
150 |
0.95 |
0.05 |
0.05 |
16.00 |
0.60 |
||
|
200 |
0.96 |
0.04 |
0.03 |
9.11 |
0.36 |
||
|
250 |
0.94 |
0.06 |
0.04 |
8.80 |
0.49 |
||
|
300 |
0.96 |
0.04 |
0.05 |
12.40 |
0.63 |
||
|
4 |
Geotextile GP300 art. 02005 GOST R 53225 |
50 |
0.65 |
0.35 |
0.06 |
3.42 |
0.62 |
|
100 |
0.89 |
0.11 |
0.05 |
9.50 |
0.52 |
||
|
150 |
0.90 |
0.10 |
0.05 |
10.46 |
0.55 |
||
|
200 |
0.96 |
0.04 |
0.05 |
20.50 |
0.55 |
||
|
250 |
0.95 |
0.05 |
0.04 |
17.09 |
0.45 |
||
|
300 |
0.94 |
0.06 |
0.04 |
11.97 |
0.45 |
||
|
5 |
Fabric art. 15406a-B GOST 11209 |
50 |
0.59 |
0.41 |
0.07 |
2.24 |
0.92 |
|
100 |
0.91 |
0.09 |
0.05 |
8.47 |
0.67 |
||
|
150 |
0.49 |
0.51 |
0.05 |
1.26 |
0.66 |
||
|
200 |
0.91 |
0.08 |
0.05 |
8.62 |
0.69 |
||
|
250 |
0.92 |
0.08 |
0.05 |
10.7 |
0.69 |
||
|
300 |
0.94 |
0.06 |
0.05 |
12.19 |
0.69 |
||
Table 6. The results of estimating the samples thickness (mm) with an electrically conductive layer after stretching cycles
|
Cycle |
Sample thickness, mm |
||||
|
PET-E film, GOST 24234 |
Nonwoven fabric art. 45519 GOST 25441 |
Geotextile GP200 art. 02003 GOST R 53225 |
Geotextile GP300 art. 02005 GOST R 53225 |
Fabric art. 15406a-B GOST 11209 |
|
|
0 |
0.17 |
0.40 |
0.96 |
2.47 |
0.57 |
|
50 |
0.17 |
0.36 |
0.95 |
2.41 |
0.56 |
|
100 |
0.17 |
0.32 |
0.93 |
2.36 |
0.56 |
|
150 |
0.17 |
0.31 |
0.91 |
2.31 |
0.55 |
|
200 |
0.17 |
0.26 |
0.90 |
2.27 |
0.55 |
|
250 |
0.17 |
0.21 |
0.88 |
2.24 |
0.55 |
|
300 |
0.16 |
-* |
0.87 |
2.21 |
0.54 |
THE STUDY OF THE PROPERTIES OF NANOMATERIALS
Table 7. The results of measuring the resistance of the electrically conductive coating of the tested samples
|
Cycle |
Electrical resistance, Ohms |
||||
|
PET-E film (Sample 1) |
Nonwoven fabric (Sample 2) |
Geotextile GP200 (Sample 3) |
Geotextile GP300 (Sample 4) |
Fabric art. 15406a-B (Sample 5) |
|
|
0 |
53.8 |
109.0 |
64.1 |
25.2 |
47.3 |
|
50 |
130.2 |
750.9 |
93.3 |
25.3 |
85.5 |
|
100 |
95.6 |
1675.1 |
118.1 |
27.4 |
93.3 |
|
150 |
96.3 |
3679.4 |
131.4 |
28.5 |
100.8 |
|
200 |
100.4 |
4397.4 |
154.3 |
30.2 |
130.0 |
|
250 |
105.9 |
4963.9 |
160.1 |
36.3 |
131.1 |
|
300 |
162.7 |
-* |
180.4 |
41.4 |
132.8 |
* When testing Sample 2 (Tables 1, 5–7), irreversible deformation occurred with the destruction of the entire system of the electrically conductive layer and the material, therefore, it was not possible to measure the resistance after 300 stretching cycles.
tively, after 50 and 300 stretching cycles, which is generally 50-60% (Table 7, Fig. 2, d).
The residual deformation of Sample 5 (Table 1, 5) increased by 40% after the first 50 cycles. Then, for up to 100 cycles, Sample 5 “works” as an elastic system. After 150 cycles, the residual deformation increases (45–50%) and during subsequent cycles, Sample 5 works “elastically” (Table 5). This is explained by the peculiarities of the relaxation processes of the substrate tissue of the sample 5. Cyclic loads cause two or more relaxation periods of woven fabrics – due to the deformation of the threads in the weave and the deformation of the fibers in the threads of the fabric.
The electrical resistance of Sample 5 increased uniformly by 10–20% after every 50 stretching cycles. In general, the resistance of this sample increased by 45% during the periods of 50–300 cycles (Fig. 2, e).
Cyclic stretching of Sample 1 made on a 0.14 mm thick PET-E film (Table. 1) did not change the reversible part of the deformation. Monolithic film structure The elastic behavior of the sample after 300 cycles of stretching is explained by the monolithic film structure (Table 5). However, the electrical resistance of Sample 1 varied ambiguously: after 200 cycles, it decreased from 130 Ohms to 100 Ohms. After 200 cycles, there was an increase in resistance to 162.7 Ohms (Table 7). Unstable dynamics of changes in the resistance of the electrically conductive coating on the film is possible (possibly due to the sealing of the coating under indenter pressure, which can lead to an increase in resistance). On the other hand, sealing the coating increases its rigidity, reduces the area and strength of adhesion to the surface of the film, which ultimately leads to peeling and/or destruction of the electrically conductive coating and an increase in resistance. Such instability of the behavior of this sample under cyclic loads can significantly reduce the quality of finished structural elements during operation (Fig. 2, a).
Thus, the deformation of the samples varies from 8% to 75% in general and depends on the structure of the starting materials and the coating-substrate system. Obviously, the structure of the electrically conductive layer depends on the raw materials. To establish the relationship between deformation and electrical resistance, correlation and regression analyses of independent quantities were performed: X is the deformation after stretching cycles, fractions; Y is the electrical resistance, Ohms. The analysis of the correlation coefficients (Table 8) suggests that there is a strong relationship between electrical resistance and cyclic deformation of the objects under study, as the correlation coefficient r > 0.5.
Using approximation, the dependences of electrical resistance on deformation under cyclic stretching conditions are found for various materials: input factor X is the deformation after stretching cycles, fractions; output factor Y is the electrical resistance, Ohms. The empirical regression equations were approximated by a second– degree polynomial, the coefficients, equations, and the adequacy criterion are shown in Table 8.
Taking into account the physics of the processes under study analysis of regression equations coefficients (Table 8) can be assumed that in the equations the coefficient at x 2 determines the dynamics and magnitude of the change in resistance, and the coefficient at x is the moment in time (cycles of deformation of the sample) at which intense changes in the electrical resistance of the sample begin.
Thus, the analysis of the research results confirms the different mechanism of the structural organization of the bonds formed between the electrically conductive coating and the substrate material. The relationship between the layers in the coating–substrate composite system depends on the structure of the substrate (when applying the same coating). Three main types of layer interaction can be distinguished and, accordingly, the
THE STUDY OF THE PROPERTIES OF NANOMATERIALS
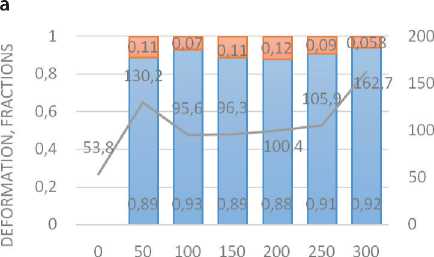
I I Reversible deformation, fractions l_j Irreversible deformation, fractions ------Electrical resistance, Ohms

b
c
d
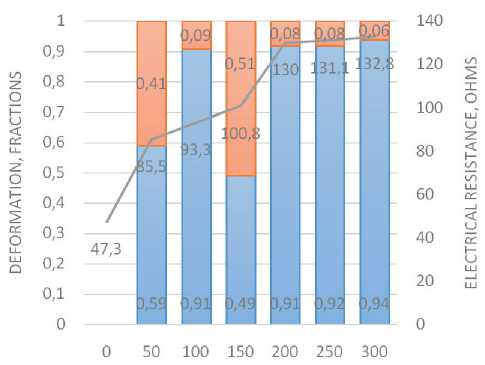
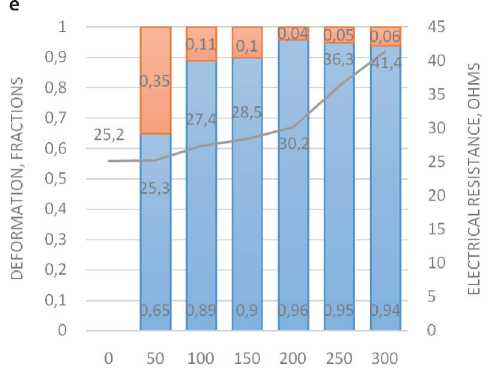
Fig. 2. Diagrams of changes in deformation and resistance after cycles of multiaxial stretching of samples: a – PET-E film; b – nonwoven fabric art. 45519; c – geotextile GP200; d – geotextile GP300;
e – fabric art. 15406a-B
THE STUDY OF THE PROPERTIES OF NANOMATERIALS behavior of flexible structural elements in operation can be predicted.
Coating on relatively rigid monolithic films (which are traditionally used for flexible resistors), the coating forms on the surface of the film without diffusing into the substrate structure. In this case, there is a high probability of peeling of the coating from the substrate during cyclic external force action, which can lead to distortion or complete loss of the electrical signal by the structural element in operation.
On thin nonwovens (Sample 2), due to the diffusion of particles of an electrically conductive composition through the thickness, complete impregnation of the substrate is possible. In this case, during the operation of such an element, contact with third-party electrically conductive elements is possible, which may cause an electrical signal or leakage of electric current. Leakage of electric current is the most dangerous option when operating such a structural element. It can be argued that the tested 0.37 mm thick cloth (Sample 2) is not suitable for creating flexible electrically conductive elements.
Nonwoven fabrics and fabrics with a thickness of more than 0.47 mm (Samples 3, 4, 5) are of the greatest interest for the manufacture of flexible elements. This is confirmed by satisfactory test results. In this case, an electrically conductive layer forms on the surface of the substrate and partially diffuses through its thickness. This mechanism of interaction of layers in the coating–substrate composite ensures relative stability of resistance values.
However, when coating canvases with a thickness of more than 2 mm (Sample 4), economic and technological difficulties are possible: 2–3 runs are required to obtain a solid impression, which increases the consumption of an electrically conductive composition; the finished element is obtained with other electrical and mechanical properties. Therefore, the optimal choice for flexible electrically conductive elements will be 0.5–0.7 mm thick canvases (Samples 3, 5).
CONCLUSION
The study made it possible to obtain an objective assessment of changes in the electrical conductivity of coatings of intelligent elements of building structures under cyclic stretching conditions. Based on scientific information search and preliminary research, a method of applying an electrically conductive coating was selected – screen printing and an electrically conductive polymer composition with carbon nanoparticles. The flexible materials samples in the coating-substrate system differed in composition and structure – films, nonwoven fabrics, fabrics 0.14–2.23 mm thick. The parameters of testing samples under conditions of cyclic multiaxial stretching were determined: 50–300 cycles, cyclic load of 10 N, load and rest time of 5 seconds each, thickness, deformation and resistance measurements were carried out every 50 cycles.
The results showed that the deformation and its components vary ambiguously. The irreversible part of the deformation of the samples varied in general from 8% to 75% and depends on the structure of the materials on which the coating was applied. The thickness of the printed elements varied from 6% to 100% in general and also depends on the structure of the raw materials. The electrical resistance of the samples varied from 25 Ohms to 5 kOhms and depends on the test parameters and the structure of the coating–substrate composite. Correlation analysis confirmed a strong correlation between the magnitude of the electrical resistance and the deformation of the samples. The value of the correlation coefficient is 0.60–0.78. The approximation is used to find empirical equations that can be used to predict the reliability of flexible electrically conductive elements under cyclic stretching conditions that simulate operating conditions.
A comparative analysis of the results of testing objects under cyclic stretching conditions allowed us to recommend nonwoven fabrics and fabrics 0.5–0.7 mm thick for flexible electrically conductive elements
Table 8. Analysis of the resistance dependence on deformation of samples under conditions of cyclic multiaxial stretching
|
No. |
Sample |
Correlation coefficient |
The regression equation |
The criterion of adequacy R2 |
|
1 |
PET-E film |
0.51 |
y = 469.19x2–221.28x+123.52 |
0.628 |
|
2 |
Nonwoven fabric art. 45519 |
0.78 |
y = 59202x2–88366x+33638 |
0.943 |
|
3 |
Geotextile GP200 art. 02003 |
0.78 |
y = 65.394x2–400.73x+29.771 |
0.965 |
|
4 |
Geotextile GP300 art. 02005 |
0.65 |
y = 218.44x2–179.7x+62.073 |
0.953 |
|
5 |
Fabric art. 15406a-B |
0.66 |
y = 146.07x2–155.93x+128.07 |
0.883 |
THE STUDY OF THE PROPERTIES OF NANOMATERIALS
(Samples 3, 5). Thus, the results showed that the cyclic stretching technique can be recommended for the rational selection and prediction of the behavior of flexible
electrically conductive elements in the design, production and operation of intelligent building structures of buildings and structures.
