The high school students attitudes towards peers with blindness

Author: Daniela Dimitrova-Radojičić
Journal: International Journal of Cognitive Research in Science, Engineering and Education @ijcrsee
Section: Original research
Article in issue: 3 vol.10, 2022.
Free access
The purpose of this study was to investigate the attitudes of high school pupils toward peers with blindness. Using the CATCH-scale (Chedoke-McMaster Attitudes towards Children with Handicaps), 218 high school students’ attitudes were assessed. High school students generally had a positive attitude towards students with blindness. The total scores on the CATCH- scale was a little higher for female students, but with no statistically significant difference (p>.05). Generally, the implications of this research suggest that regular schools must implement coexistence programs that will lead to even better attitude in inclusive settings.
Attitude, peers with blindness, high school students, inclusive education, regular school
Short address: https://sciup.org/170198676
IDR: 170198676 | UDC: 316.644-057.87:376-056.262 | DOI: 10.23947/2334-8496-2022-10-3-109-115
Text of the scientific article The high school students attitudes towards peers with blindness
Worldwide inclusive education practices have started an intensive development in recent years ( Alnahdi, 2020 ). Moreover, in our country full inclusive education will start from the school year 2022/23. Namely, according to the Macedonian education policy all students with disabilities must be included in regular schools. There will not be any more special schools, only Research centers. In North Macedonia schools are compulsory, publicly funded, and free of charge to everyone from primary to higher education (from 5 till 18 years old).
Although inclusive education for children with disabilities is now widely accepted, it is still challenged by negative peer attitudes ( Godeau et al., 2010 ). But, many studies have shown that when children with typically development spend time and are educated with children with disabilities, they have more positive attitudes towards them ( Çiçek-Gümüş and Öncel, 2020 ). Also, when students have a positive attitude toward their friends with disabilities, it can help their inclusion, but a negative attitude might limit inclusive education ( Ketovuori et al., 2010 ).
Objective
Despite what has been discovered from cross-sectional research concerning low peer acceptance of students with disabilities in inclusive education, there is still a lack of evidence about students’ attitudes toward students with blindness. Most researches have examined attitudes towards disability in general, rather than attitudes toward a specific type of disabilities. However, no study has been conducted to measure the attitudes of Macedonian high school students towards their peers with blindness. Therefore, the goal of this study is to analyze their attitudes and to determine whether gender, school grade, and interaction with a person with blindness have a significant effect on these attitudes.
Materials and Methods
Participants
The study’s sample contained 218 high school students ranging between the ages of 15 to 18. 54,1% (118) female and 45,9% (100) male, which were randomly selected from seven North Macedonian high schools. The research was approved by the principals of these high schools.
Instrument
The CATCH scale was used to examine high school students’ attitudes towards peers with blindness.

© 2022 by the authors. This article is an open access article distributed under the terms and conditions of the Creative Commons Attribution (CC BY) license .
This scale is divided into three subscales: a) an affective subscale containing emotional remarks about student with disabilities (e.g. ‘I would be afraid of a disabled child’) b) a behavioral subscale providing examples of what students would do to help a student with disabilities (e.g. ‘In class I wouldn’t sit next to a disabled child’), and finally, c) a cognitive subscale comprising verbal statements of belief concerning children with disabilities (e.g. ‘Disabled children can make new friends’) ( King et al., 1989 ; Bossaert and Petry, 2013 ). It has 36 items in total, 12 in each component, with an equal amount of positively and negatively phrased statements ( De Laat, Freriksen and Vervloed, 2013 ). The items are randomly organized, with positive and negative statements alternating. A 5-point Likert scale is used to rate the CATCH-scale, with values ranging from 0 (strongly disagree) to 4 (strongly agree). Items with negative wording were scored in reverse. The points range from 0 to 40 since the final scores are calculated by adding together all the individual scores, dividing the total by the number of items, and multiplying by 10.
According to Rosenbaum et al. (1986) , “a higher score means a more positive attitude” (p. 521). CATCH uses a general term (e.g. ‘a disabled child’) as the attitude object. Unlike other scales, this scale does not differentiate between attitudes toward different types of disabilities. For this study, the word “child with disability” was changed to “student with blindness” because teens do not want to be classified as a “child”; moreover, in the questionnaire was specified that they should consider peers their age. In addition, demographic information of participants, as well as their ‘disability knowledge’, was collected.
Procedure
All students filled out the CATCH scale independently and anonymously. They were given careful instructions about how to complete the questionnaire.
Results
Table 1 provides an overview of the sample’s demographic characteristics. High school students were also asked to rate their general knowledge about peers with blindness - min 1 (absolute no knowledge), and max 5 (complete knowledge). From the results, it’s obvious that they have partial knowledge about students with blindness (M=3.12; SD=1.062). On the next question about how they got that knowledge: 39 (17,9%) of them answered from personal experience or contact with a person with blindness; 129 (59,2%) from reading; 22 (10,1%) school and 28 (12,8%) mention others.
Table 1
Demographic characteristics of students
|
Demographic Variables |
Groups |
n |
% |
|
Gender |
Male |
too |
45,9 |
|
Female |
118 |
54,1 |
|
|
Grade |
70 |
32,1 |
|
|
II |
38 |
17,4 |
|
|
III |
73 |
33,5 |
|
|
IV |
37 |
17 |
|
|
Knowledge of peers with blindness |
1 (absolute no) |
11 |
5 |
|
2 (no) |
52 |
23,9 |
|
|
3 (partially yes) |
81 |
37,2 |
|
|
4 (yes) |
48 |
22 |
|
|
5 (completely yes) |
26 |
11,9 |
|
|
How they got informed |
personal experience |
39 |
17,9 |
|
reading |
129 |
59,2 |
|
|
school |
22 |
10,1 |
|
|
other |
28 |
12,8 |
All responses to items on the CATCH scale were classified into three categories: disagree, neutral, and agree. Strongly agree, as well as strongly disagree, were included in agree and disagree categories respectively. The results of these 36 questions are shown in the next tables divided in 3 subscales (Affective subscale, Behavioral subscale and Cognitive subscale).
Table 2
Affective subscale
*Mean (Standard Deviation)
The most notable responses from the affective subscale (Table 2) were questions 18, 26, 1, and 6. Namely, results showed that 159 (73%) of students stated they disagree that they would be afraid of students with blindness. One hundred and forty (65.6%) of them stated they would not like a friend with blindness as much as their other friends. Student participants also agree that they feel sorry for students with blindness (n=156; 71,6%) and they wouldn’t worry if a student with blindness sat next to them (n=150; 68,8%).
Table 3
Behavioral subscale
|
Items |
Disagree |
Neutral |
Agree |
M (SD)* |
|
2.1 would not introduce a student with blindness to my friends |
156(71,5%) |
30(13,8%) |
32(14,7%) |
3.07(1.214) |
|
4.1 wouldn't know what to say to a student with blindness |
119(54,6%) |
51 (23,4%) |
48 (22%) |
2.53(1.141) |
|
7.1 would stick up for a student with blindness who was being teased |
4(1,8%) |
22(10,1%) |
192(88,1%) |
3.33(0.785) |
|
9.1 would invite a student with blindness to my birthday party |
11 (5%) |
25(11,5%) |
182(83,5) |
3 22(0.919) |
|
11.1 would talk to a student with blindness who 1 didn’t know |
68(31,2%) |
54(24,8%) |
96(44%) |
2.20(1.303) |
|
16.1 would try to stay away from a student with blindness |
180(82,6%) |
33(15,1%) |
5(2,3%) |
3.30(0.816) |
|
20 In class I wouldn't sit next to a student with blindness |
149(68,3%) |
39(17,9%) |
30(13,8%) |
3.02(1.197) |
|
22.1 try not to look at someone who is blind |
116(53,2%) |
61 (28%) |
41 (18,8%) |
2 53(1 082) |
|
25.1 would invite a student with blindness to sleep over at my house |
34(15,6%) |
56(25,7%) |
128(58,7%) |
2.58(1.201) |
|
29.1 would tell my secrets to a student with blindness |
62 (28,4%) |
42(19,3%) |
114(52,3%) |
2 29(1328) |
|
32.1 would not go to a student with blindness house to Play |
143(65,6%) |
42(19,3%) |
33(13,1%) |
2 82(1.212) |
|
35.1 would miss recess to keep a student with blindness company |
124(56,9%) |
52(23,8%) |
42(19,3%) |
1 30(1.202) |
*Mean (Standard Deviation)
The frequency of responses to the behavioral subscale (Table 3) indicated that most of the participants disagree with the statement: “I would try to stay away from a student with blindness.” (82,6%) and “I would not introduce a student with blindness to my friends.” (71,5%). At the same time, they agree that they would stick up for a student with blindness who was being teased (88,1%) and will invite peers with blindness to their birthday party (83,5%).
Table 4
Cognitive subscale
*Mean (Standard Deviation)
When considering the answers on the cognitive subscale (Table 4), 78% of the students agree that students with blindness want lots of attention from adults, and 82,1% claimed that they did not agree with the statement that students with blindness do not want to make friends.
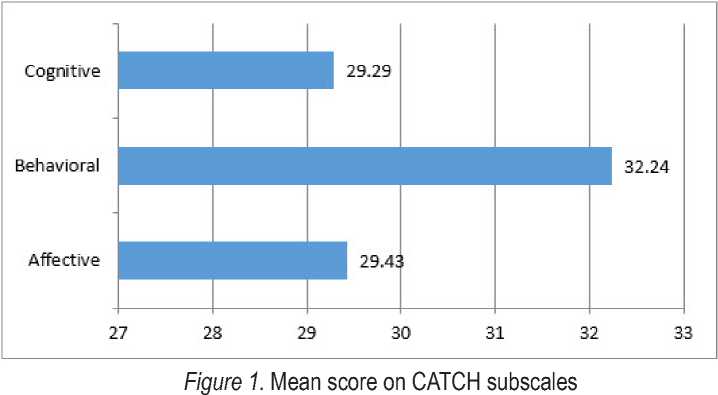
Higher school students’ attitudes towards students with blindness were generally positive (M=30.32, SD=4.689). The mean score on the behavioral subscale (M=32.24, SD=5.508) was the highest while the one on cognitive was the lowest (M=29.29.32, SD=2.856), which shows they do not necessarily understand a child with blindness (Figure 1).
|
Table 5 Gender |
||||
|
Subscale |
Female M(SD) |
Male M (SD) |
T |
P |
|
Affective |
29.91 (5.776) |
28.95 (5.643) |
-1.234 |
.219 |
|
Behavioral |
31.90 (5.347) |
32.59 (5.669) |
.910 |
.364 |
|
Cognitive |
29.98 (3.211) |
28.61 (2.502) |
-3.475 |
.001 |
|
Total CATCH |
30.59 (4.778) |
30.05 (4.601) |
.845 |
.398 |
CATCH scores on subscales are shown in Table 5 for both groups, for female (n=118) and male participants (n=100). The Student’s t-test was used to compare data between groups. Between the male students and the female students, there were no significant differences in the mean scores on affective, behavioral, and total CATCH scores. But, mean scores on the cognitive subscale as a whole were significantly different (29.98 vs 28.61; p=0.001). Namely, female students have more positive beliefs about children with blindness.
Table 6
Interaction with person with blindness
|
Dimensions |
No (n=179) M(SD) |
Yes (n=39) |
||
|
M(SD) |
T |
P |
||
|
Affective |
25.58 (3.125) |
30.29 (5.813) |
4.843 |
.000 |
|
Behavioral |
29.34 (3.920) |
32.83 (5.595) |
4.584 |
.000 |
|
Cognitive |
27.11 (2.874) |
29.83 (2.768) |
5.344 |
.000 |
|
Total CATCH |
27.34 (3.306) |
30.98 (4.725) |
4.517 |
.000 |
Findings suggest that students who reported having contact or interaction with person with disability (n=38) recorded higher scores on CATCH than those who reported that they did not have contact or interaction with person with disability (n=179). An independent samples t-test suggests a significant difference between the scores on the whole CATCH scale, as well as the three subscales (Table 6).
Table 7
One-way ANOVA for significant difference between subscales and schools grade
|
Subscale |
Sum of Squares |
df |
Mean Square |
F |
Sig. |
|
|
Between Groups |
178.834 |
3 |
59.611 |
|||
|
Affective |
Within Groups |
22021.221 |
214 |
.579 |
.629 |
|
|
Total |
22200.055 |
217 |
102903 |
|||
|
Between Groups |
311.536 |
3 |
103 845 |
|||
|
Behavioral |
Within Groups |
18630.538 |
214 |
1.193 |
.313 |
|
|
Total |
18942.073 |
217 |
87.059 |
|||
|
Between Groups |
603.517 |
3 |
201.172 |
|||
|
Cognitive |
Within Groups |
18679.515 |
214 |
2.305 |
.078 |
|
|
Total |
19283.032 |
217 |
87.287 |
Table 7, the ANOVA test shows that students from different school grade have no significantly differently score on CATCH subscales: affective (F= .579, p= .629); behavioral (F=1.193, p= .313) and cognitive (F=2.305, p = .078).
Discussions
In studies conducted on students from different countries, their attitudes towards peers with disabilities have proved to be positive. Unfortunately, there aren’t many studies that examine attitudes toward a particular disability, such as blindness ( Nikolaraizi and De Reybekiel, 2001 ; De Laat, Freriksen and Vervloed, 2013 ). In line with most of those studies, this study also shows that high school students have positive attitudes towards peers with blindness.
The attitudes of individuals toward people with disabilities are frequently impacted by a variety of factors. Since an attitude may be thought of as a multidimensional construct comprising of affection, behavior, and cognition, also it is a subject to change and modification ( De Laat, Freriksen and Vervloed, 2013 ). Age, culture, gender, religion, self-esteem, and whether or not one knows a disabled person are the most researched factors that might affect attitude. Several studies have shown that when attitudes are compared based on gender, girls’ attitudes are more positive than boys’. In this research gender seems to affect only the positive cognitive components of attitudes toward peers with blindness, specifically female students have statistically a more positive attitude than male students on the cognitive subscale. Interestingly, male students have a more positive attitude on the behavioral subscale.
There are studies that show that having a friend with a disability and interacting with a person with a disability or a family member with a disability has a positive effect on children’s attitudes ( Armstrong et al., 2016 ). Also, in this CATCH study, the scores were significantly higher in students who had contact or interaction with a blind person than in those who did not.
The last question was whether school grades have a significant effect on the attitudes toward students with blindness. The results showed no age effect on the attitudes of high school students towards peers with blindness.
Conclusions
Acknowledgements
The author states that no commercial or financial connections existed that may be considered as a possible conflict of interest when conducting the research. Thanks to the graduating students of the Institute of Special Education and Rehabilitation for their participation in conducting the research.
Conflict of interests
The author declares no conflict of interest.
References The high school students attitudes towards peers with blindness
- Alnahdi, G. H. (2020). Rasch validation of the Arabic version of the Chedoke–McMaster attitudes toward children with handicaps (CATCH-AR) Scale. Frontiers in psychology, 10, 2924. https://doi.org/10.3389/fpsyg.2019.02924
- Armstrong, M., Morris, C., Abraham, C., Ukoumunne, O. C., & Tarrant, M. (2016). Children’s contact with people with disabilities and their attitudes towards disability: a cross-sectional study. Disability and rehabilitation, 38(9), 879-888. https://doi.or g/10.3109/09638288.2015.1074727
- Bossaert, G., & Petry, K. (2013). Factorial validity of the Chedoke-McMaster attitudes towards children with handicaps scale (CATCH). Research in developmental disabilities, 34(4), 1336-1345. https://doi.org/10.1016/j.ridd.2013.01.007
- Çiçek-Gümüş, E., & Öncel, S. (2020). Validity and reliability of the Chedoke-McMaster Attitudes Towards Children with Handi-caps Scale in Turkey: A methodological study. Florence Nightingale Journal of Nursing, 28(1), 1-12. https://doi. org/10.5152/FNJN.2020.426719
- De Laat, S., Freriksen, E., & Vervloed, M. P. (2013). Attitudes of children and adolescents toward persons who are deaf, blind, paralyzed or intellectually disabled. Research in developmental disabilities, 34(2), 855-863. https://doi.org/10.1016/j. ridd.2012.11.004
- Dunn, D. S. (2015). The Oxford handbook of undergraduate psychology education. Oxford University Press.
- Godeau, E., Vignes, C., Sentenac, M., Ehlinger, V., Navarro, F., Grandjean, H., & Arnaud, C. (2010). Improving attitudes towards children with disabilities in a school context: A cluster randomized intervention study. Developmental Medicine & Child Neurology, 52(10), e236-e242. https://doi.org/10.1111/j.1469-8749.2010.03731.x
- Gümüş, E. Ç., & Öncel, S. (2020). Validity and reliability of the Chedoke-McMaster attitudes towards children with handicaps scale in Turkey: A methodological study. Florence Nightingale journal of nursing, 28(1), 1-12. https://doi.org/10.5152/ FNJN.2020.426719
- Hutzler, Y. (2003). Attitudes toward the participation of individuals with disabilities in physical activity: A review. Quest, 55(4), 347-373. https://doi.org/10.1080/00336297.2003.10491809
- Ketovuori, H., Hirvensalo, S., Pihlaja, P., & Laakkonen, E. (2020). Pupils’ Experience of Social Participation in Finnish Primary Schools. Nordic Studies in Education, 40(4), 323-342. https://doi.org/10.23865/nse.v40.2600
- King, S. M., Rosenbaum, P., Armstrong, R. W., & Milner, R. (1989). An epidemiological study of children’s attitudes toward disability. Developmental medicine & child neurology, 31(2), 237-245. https://doi.org/10.1111/j.1469-8749.1989. tb03984.x
- Mu, K., Siegel, E. B., & Allinder, R. M. (2000). Peer interactions and sociometric status of high school students with moderate or severe disabilities in general education classrooms. Journal of the association for persons with severe handicaps, 25(3), 142-152. https://doi.org/10.2511/rpsd.25.3.142
- Nikolaraizi, M., & De Reybekiel, N. (2001). A comparative study of children’s attitudes towards deaf children, children in wheelchairs and blind children in Greece and in the UK. European Journal of Special Needs Education, 16(2), 167-182. https://doi.org/10.1080/08856250110041090
- Rosenbaum, P. L., Armstrong, R. W., & King, S. M. (1986). Children’s attitudes toward disabled peers: A self-report measure. Journal of Pediatric Psychology, 11(4), 517-530. https://doi.org/10.1093/jpepsy/11.4.517
- Vasileiadis, I., & Doikou-Avlidou, M. (2018). Enhancing social interaction of pupils with intellectual disabilities with their general education peers: the outcomes of an intervention programme. Journal of Research in Special Educational Needs, 18(4), 267-277. https://doi.org/10.1111/1471-3802.12410
- Vasileiadis, I., Koutras, S., & Stagiopoulos, P. (2021). Changing the attitudes of high school students towards intellectual disabilities: the contribution of a social coexistence programme. Journal of Research in Special Educational Needs, 21(1), 49-62. https://doi.org/10.1111/1471-3802.12498
- Vignes, C., Godeau, E., Sentenac, M., Coley, N., Navarro, F., Grandjean, H., & Arnaud, C. (2009). Determinants of students’ attitudes towards peers with disabilities. Developmental Medicine & Child Neurology, 51(6), 473-479. https://doi. org/10.1111/j.1469-8749.2009.03283.x
