
The Impact of BPR on Increasing the Effects of Ad Valorem Taxes and the role of the Business Plan in maintaining monopoly equilibrium and market power
Journal: Ekonomski signali @esignali
Article in issue: 1 vol.21, 2026.
Free access
Business Process Reengineering (BPR) in monopolistic enterprises aims to increase efficiency and reduce costs by integrating processes in order to achieve optimal performance. The business plan in monopolistic companies relies, among other things, on cost optimization and price control in competitive conditions. Monopoly and perfect competition represent two extreme market structures. A perfectly competitive market is characterized by the presence of numerous firms producing a homogeneous product, with no barriers to entry for new firms into the industry. In a monopolistic market, there is only one producer offering a differentiated product with no close substitutes, and where barriers to entry are very high. Like firms in other market structures, a monopolistic firm seeks to maximize its total profit. The position of maximum profit is achieved at the level of output where marginal costs equal marginal revenue. This corresponds to a level at which price is higher than marginal cost, which is the source of its monopoly power. Economic theory has devoted considerable attention to the study of monopoly power and measures for its mitigation. The subject of this paper is the specific impact of BPR on increasing the effects of ad valorem taxation as one of the forms of regulating monopolistic firm behaviour, as well as the effects of its implementation, which ultimately result in equilibrium in the monopolistic market.
Short address: https://sciup.org/170213255
IDS: 170213255 | UDC: 519.22:005.591.6; 005.336.1 | DOI: 10.5937/ekonsig2601021M
Uticaj BPR na povećanje efekata ad valorem poreza kao i uloga biznis plana u održavanju monopolske ravnoteže i tržišne moći
Reinženjering poslovnih procesa (BPR) u monopolskim preduzećima ima za cilj povećanje efikasnosti i smanjenje troškova kroz povezivanje procesa radi ostvarivanja optimalnih učinaka. Biznis plan se, u monopolskim preduzećima oslanja, između ostalog, na optimizaciju troškova i kontrolu cena u uslovima konkurencije. Monopol i tržište savršene konkurencije su dva ekstremna tržišna stanja. Savršeno konkurentno tržište karakteriše prisustvo brojnih preduzeća koja proizvode homogeni proizvod i gde nema nikakvih barijera ulaska novih preduzeća u granu. Na monopolskom tržištu postoji samo jedan proizvođač, koji proizvodi diferencirani proizvod koji nema bliskih supstituta i gde su barijere ulaska u granu vrlo visoke. Kao i preduzeća u drugim tržišnim strukturama i monopolsko preduzeće želi da maksimizira svoj ukupan profit. Poziciju najvećeg profita ostvaruje pri obimu proizvodnje na kome se marginalni troškovi izjednačavaju sa marginalnim prihodom. Radi se o obimu pri kome je cena veća od marginalnih troškova, što i predstavlja izvorište njegove monopolske moći. Istraživanju monopolske moći i merama za njeno ublažavanje ekonomska teorija je posvetila dovoljno prostora. Predmet ovog rada je konkretni uticaj BPR na povećanje efekata ad valorem poreza kao jednog od oblika regulacije monopolskog ponašanja preduzeća i efekata njegove primene, sto kao rezultat ima ravnotežu na monopolskom tržištu.
Text of the scientific article The Impact of BPR on Increasing the Effects of Ad Valorem Taxes and the role of the Business Plan in maintaining monopoly equilibrium and market power
Business Process Reengineering (BPR) significantly impacts the behavior of a monopoly enterprise in the broadest context. Through the implementation of a Business Plan, a monopoly enterprise forecasts high and stable revenues via financial projections. How, then, should the behavior of a monopoly be understood under the conditions of introducing an ad valorem tax? In addition to certain standard assumptions upon which the understanding of monopoly behavior is based [Mihajlović et al., 2017], assessing the effects of introducing an ad valorem tax on equilibrium parameters and the position of the monopolist, the consumer, and the state also includes the following starting points:
-
• The monopolist faces a downwardsloping linear demand curve;
-
• The cost structure consists of fixed costs of an absolutely fixed nature and variable costs of a proportional nature;
-
• The monopoly enterprise seeks to achieve the highest possible profit.
Mutual interactions between the monopolist and buyers are manifested through the demand curve. The monopolist can increase or decrease the volume of production, but this inevitably leads to a decrease or increase in price. By increasing the volume of produc- tion, the monopolist's total revenue will increase, remain at the same level, or decrease, depending on the elasticity of demand. In the zone of elastic demand, increasing the volume of production causes total revenue to rise; in the zone of unit elastic demand, it reaches its maximum; while in the zone of inelastic demand, it declines. Viewed from the perspective of marginal revenue as a value indicating the change in total revenue caused by a one-unit increase in production and sales the conclusions are straightforward. In the zone of elastic demand, marginal revenue is positive, indicating that an increase in production leads to an increase in total revenue, while a decrease in production leads to a decrease in total revenue. In the zone of inelastic demand, marginal revenue is negative; thus, an increase in production volume reduces total revenue, while a decrease in volume increases total revenue. Since we have assumed that the total cost structure consists only of absolutely fixed costs and variable costs of a proportional nature, total costs will increase as production rises due to the growth of their variable component. The change in total costs caused by a one-unit change in production volume represents marginal costs, which remain constant across all levels of production.
An assumption that most economists do not call into question [Galbraith,
Unregulated market and monopoly equilibrium
To determine the volume of production and the price at which the monopolist achieves the maximum profit, it is necessary to know the total profit function. Total profit (TPF) is obtained by subtracting total costs (TC) from total revenue (TR). Given an inverse demand curve of the following form:
p = a - bx (1)
and the monopolist's total costs:
TC = TPF + xc total profit can be represented by the following function:
TPF = ( a - bx ) x - (TPF + xc )
where a denotes the intercept of the linear demand curve on the vertical axis (ordinate), b represents its slope, x is the level of production, TFC stands for total fixed costs, c represents variable costs per unit (i.e., marginal costs), and p is the price. By setting the derivative of the total profit function with respect to the argument x equal to zero, we obtain:
^=(a- 2bx)
- c = 0
that is:
(a - 2 bx) = c in which the left side represents marginal revenue, and the right side represents marginal costs. By solving it for x, we obtain the level of produc- tion at which the monopolist achieves the maximum total profit (x*):
X*
а с
2b 2b
The equilibriun price ( p *) sis obtained by substituting x * into equation (1) and is given by:
P * =а + С
Any change in the volume of production causes a change in both total revenue and total costs. By increasing the volume of production by one unit, total costs rise by the amount of the marginal costs. Simultaneously, marginal costs represent the increase in total variable costs caused by a one-unit increase in production, as our model assumes that fixed costs are of an absolutely fixed nature. Within the economically relevant range of total revenue specifically, the zone of elastic demand a one-unit increase in production increases total revenue, and vice versa. The value indicating the extent to which revenue will increase given a one-unit increase in production volume is called marginal revenue. As long as an increase in production results in a greater rise in total revenue relative to costs, it is rational to increase production; conversely, it is justified to reduce production if that reduction causes a greater decrease in costs compared to the decrease in total revenue. Marginal costs may be higher or lower, but they must be positive. This fact indicates that the equilibrium volume and equilibrium price must be located within the section of the demand curve where it is elastic that is, where marginal revenue is positive. In the zone of unit elastic demand, the equilibrium volume can only be found if marginal costs are zero. Given a specific demand curve and marginal costs, the monopolist will have no incentive to produce a quantity smaller or larger than the one determined by the point x* ; however, this does not imply that he would not do so if compelled. If state authorities mandate a price lower than the equilibrium price, the monopolist, guided by his own interests, will increase production.
With this increase, his total profit will be lower than what would be achieved in an unregulated market, but it would certainly be the highest possible under the new circumstances. In order to weaken the monopoly power of the enterprise, the state may also introduce a sales tax on the product. Regardless of the type of tax mandated by state authorities, the monopolist will react by reducing production and increasing the price. Even under these new circumstances, he will behave rationally, as he seeks to maximize his welfare within the context of given constraints, measured by the magnitude of his surplus and the level of his total profit.
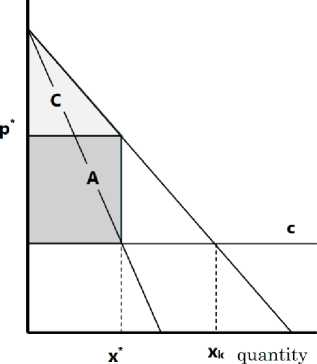
are willing to pay to purchase a specific quantity. In the graph, the consumer surplus (CS) at the equilibrium quantity x * is represented by the area of triangle Cand amounts to [Mankiw, 2005]:
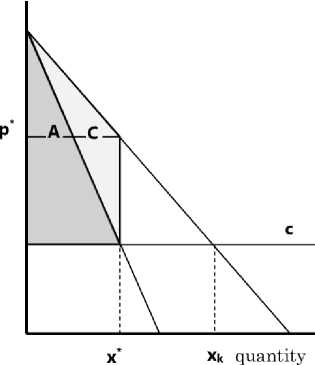
Figure 1: Equilibrium Output of a Monopoly Enterprise
The signigicance of the inverse demand and supply curve
Buyers purchase a product only if the magnitude of satisfaction they derive from owning it is greater than the amount of sacrifice they endure. If we express the satisfaction consumers gain through the maximum price they are willing to pay, and the sacrifice through the actual price they do pay, the difference between these two values represents the level of their surplus. This approach implies that we treat the demand curve as a reservation price curve, which shows the maximum price buyers
CS = — (a-с)2 (4)
8b
In an identical manner, we can treat the monopolist's supply curve. For a monopoly enterprise, only a price higher than the marginal costs is acceptable. The difference between the market price and the amount of marginal costs represents the magnitude of its surplus.
The monopolist's surplus (MS) at the equilibrium level *, defined as the di— fference between the price he receives (*) and his marginal costs, is represented in the graph by the area of triangle A in the left panel, and by
Meta, M., Dedović, N. The Impact of BPR on Increasing the Effects ofAd Valorem Taxes and the role ofthe Business Plan in maintaining monopoly equilibrium and market power the area of quadrilateral A in the right panel. The monopolist's surplus is equal to the sum of his profit and total fixed costs, and at the equilibrium level, it amounts to:
MS = —(a- c) 2 (5) 4b
The sum of areas A and C geometrically represents the magnitude of the total surplus that is, the combined surplus of both the consumer and the monopolist. At the equilibrium price * and equilibrium quantity * the total surplus (TS) amounts to:
TS=-(a- c) 2 8b
The impact of BPR on the market power of a monopolistic enterprise
In a perfectly competitive market, a firm achieves maximum profit at the output level where its marginal costs equal the price, whereas a monopolist maximizes profit at the output level where its marginal costs equal marginal revenue.
A monopolist possesses market power because he can set the price above marginal costs [Komazec, Ristić 2011]. A firm's market power is not determined by its size, but rather by its influence over price. How significant is a firm's market power, and how can it be quantitatively determined? At first glance, it might seem correct to measure a firm's market power by the magnitude of its surplus; however, in most cases, this is incorrect. We consider it far more justified to measure market power using a ratio that indicates the size of the monopolist's surplus for every unit of its total revenue achieved at the equilibrium level. At the equilibrium level, the monopolist's total revenue amounts to:
TR= — (a2 - c2) (6)
4b and its total variable costs (TVC)
TVC = (ac— 2 1 (7)
2b
The monopolist's surplus at the equilibrium level is given by expression (5), which was obtained by subtracting expression (7) from expression (6). Based on the provided values for TR, MS, and TVC, the index of monopoly power ( L ) will be:
L _ TR—TVC _ MS ~ TR ~ TR which, after substitution and simplification, yields:
a—c a+c
This index can also be obtained by using the coefficient of the price elasticity of demand, or the price flexibility coefficient as its reciprocal value. In our example, the inverse demand curve takes the form:
p = a — bx
The value of the price flexibility coefficient (1/.E J ) will be obtained using the following formula:
1 _ \dP’dxl |Ё1 = [ (Px) ]
of the inverse demand curve with respect to the argument x . For the demand curve given by expression (1) the absolute value of the price flexibility coefficient will be:
1 _ p-bx!
[E] La-bxJ
In which x denotes the production volume at the equilibrium level. By substituting the equilibrium output with expression (2) we obtain the price flexibility coefficient:
1 _ p—cl
[E] La+cJ
At the equilibrium output level specifically, at the price given by expression (3) the elasticity is equal to:
a+c a-c
The index of monopoly power and the elasticity of demand are inversely related; a higher elasticity coefficient results in lower monopoly power, and vice versa.
1=й (9)
The index of monopoly power at the equilibrium level is equal to the price flexibility coefficient, which is the reciprocal of the price elasticity of demand coefficient.
tax per unit = Pkup ■ к where k denotes the tax rate in decimal form and pkup the price paid by the buyer. If we subtract the tax from the price paid by the buyer, we obtain the amount the monopolist receives per unit of product (pmon):
P = Pkup(1 - k)
How an ad valorem tax will affect the equilibrium price, equilibrium quantity, monopolist's surplus, and consumer surplus will be illustrated starting from the inverse demand curve given by expression (1) and the assumption of the monopolist's constant marginal costs. The inverse demand function shows the price buyers are willing to pay if the sales volume of the monopoly firm is x.
When the state imposes an ad valorem tax in the amount of k , the price
paid by buyers (Р кщ ) will differ from the price received by the monopoly firm (Р тоП ). At every production level, the price received by the monopolist, compared to the price paid by the buyer, is lower by the amount of the tax and equals:
P mon = (a — bx)(1 - k) (10)
Based on the price function given by expression (10), the monopolist's total revenue function is:
TRmon = (ax — b x2)(1 — k) (11)
In determining the equilibrium volume and equilibrium price of the monopoly firm before the introduction of the tax, the following marginal revenue function was used:
MR=a — 2bx (12)
With the introduction of the ad valorem tax, the inverse demand curve given by expression (1) is no longer the average revenue curve, and the marginal revenue curve given by relation (12) ceases to be the monopolist's marginal revenue curve. The marginal revenue after the introduction of the tax is obtained by deriving the total revenue function from expression (11) with respect to the argument x. It amounts to:
MRmon(a — 2bx)(1 — k) (13)
Expression (13) indicates the change in the total revenue of the monopoly firm if, at a given amount of ad valorem tax (k) its volume of production and sales changes (increases or decreases) by one unit of quantity.
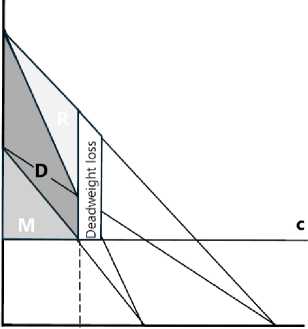
As can be observed from the graphic display below, the curve drawn based on relation (10), compared to the inverse demand curve (1), intersects
x* quantity
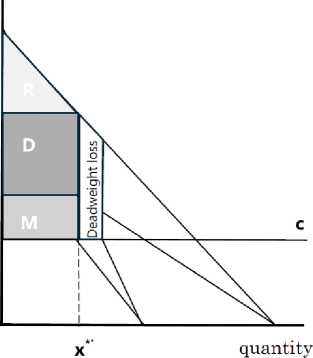
Figure 2: Ad valorem tax and monopoly equilibrium
the vertical axis closer to the origin, has a smaller slope, and intersects the abscissa at the same point as the inverse demand curve. The mon curve has an intercept on the vertical axis at price a(1-k) , its slope is b(1-k) and it intersects the abscissa at the same point, a/b . The MR mon curve must lie below the price function that the monopolist receives after the tax, have the same intercept on the ordinate axis, and have a slope twice as steep, thereby intersecting the horizontal axis at the point a/2b .
Equilibrium in a regulated monopoly market
We previously established that at the equilibrium output level, marginal revenue equals the marginal costs of the monopoly firm. In the context of the given constraints, at that level, the total profit of the monopoly firm is maximized.
After the introduction of the tax, the equilibrium production level of the monopoly firm is obtained by solving the relation below for the unknown variable x:
(a - 2bx)(1 - к) = c and we obtain:
x *
a c
2b 2b(1--)
By substituting X into the inverse demand function, we obtain the price paid by buyers:
Pkuv = —+—7---7 (15)
rКи к 2 2(1--)
and by substituting it into expression (10), we obtain the price that the monopolist receives:
Р топ = а^ + С (16)
By analyzing expressions (14), (15), and (16), we conclude that taxing a monopoly product will decrease the equilibrium quantity, Δ x : increase the price paid by buyers, and decrease the price received by the monopolist. The difference between p kup and p mon represents the amount of tax per unit of output at the equilibrium level:
unit tax = 4+2 ((--J (17)
Reflections of ad valorem tax on total welfare
With the introduction of this tax form, the price paid by buyers increases by the amount ∆
ЛР- ир = (P- up -p ) [ 2 + 21—5 ] - [ 2 + 2 ] specifically:
^-uP = C (£) (18)
and the price the monopolist receives decreases by Δ p mon :
ДРтоп = (Р* - Ркир) [~ + ~] — [^(1—^ + £] frcuft t^us that is:
АРтоп = ^ (19)
The introduction of an ad valorem tax shifts the equilibrium quantity to the left, specifically decreasing it by the amount Δ x :
Ах = (х’-х’)[^ + ^-|^ + -^-| L 2b 2b-1 22b 2b(1-k)i that is:
Ах = ^~ (А) (20)
2b 1--kJ
Total surplus before the tax is introduced [10] consists of consumer surplus and monopoly surplus, while after the tax is introduced, it consists of the surpluses of these actors plus the government's tax revenue. The introduction of the tax reduces consumer welfare due to the increase in the price they pay and the decrease in the equilibrium quantity, while the reduction in monopoly surplus is caused by the decrease in the price they receive and the decrease in the equilibrium quantity. This combined reduction in consumer and monopoly surpluses is greater than the total tax revenue, indicating that the sum of the welfare of all-participants together (including the state) is reduced. The reduction in total surplus is shown on the graph by the area of the deadweight loss quadrilateral. As relation (20) shows, the direct cause of the reduction in total welfare is the fall in the equilibrium volume of production from level X to level x*'. The welfare loss will be greater if the ad valorem tax rate is higher and vice versa; with a lower tax rate, the loss of total welfare is smaller.
Conclusion
Business Process Reengineering (BPR) and the practical application of a Business Plan enable a monopoly firm to produce the output at which the largest possible difference between revenue and costs is achieved. This refers to the quantity of output where its marginal costs equal marginal revenue. At this volume, the monopolist achieves maximum profit or minimum loss. The monopolist's surplus is the difference between total revenue and variable costs. If the surplus is greater than the total fixed costs, the company will realize a profit; otherwise, it will incur a loss and will not be able to fully cover its fixed costs.
In the short run, a position of minimum loss at the equilibrium level is better than the alternative of shutting down the company's production, as the loss will be smaller than the total fixed costs that the company would have to bear upon ceasing production. In other words, the
Meta, M., Dedović, N. The Impact of BPR on Increasing the Effects ofAd Valorem Taxes and the role ofthe Business Plan in maintaining monopoly equilibrium and market power alternative of shutting down production would mean operating with a loss equal to the fixed costs, while a production volume of x∗ represents the alternative of a smaller loss. If the total surplus is greater than total fixed costs x∗ represents the position of its greatest possible surplus and total profit.
The introduction of an ad valorem tax has direct reflections on the monopolist's equilibrium volume, the price level they receive, the level of their profit and surplus, as well as the price paid by the buyer, the consumer surplus level, the tax amount per unit of output, the total tax revenue accruing to the state, the total surplus amount, and the occurrence of "deadweight loss." The most significant consequence of introducing this tax is that the sum of consumer surplus and the monopolist's surplus (or profit) decreases by a greater extent than the amount of tax the state can collect on this basis. The loss of a portion of the total surplus, namely the occurrence of "deadweight loss," is a direct consequence of the reduction in equilibrium volume caused by the introduction of the ad valorem tax. The introduction of this tax, like the introduction of a specific (per-unit) tax, forces the firm to decrease production volume and increase the price, just as administra- tive price-setting compels it to increase production and decrease the price. These are profit-oriented reactions of the firm to measures taken by modern states with the aim of regulating monopoly positions and weakening the monopoly power of firms.
