The influence of oil prices on economic growth. The case of United Arab Emirates

Author: Maria Demidova
Journal: Экономика и социум @ekonomika-socium
Article in issue: 2 (33), 2017.
Free access
The relationship between oil prices and economic development has been studied for a long time, however, still there are several views on this problem. In my article I will examine the historical data of oil prices, and then I will use the data from the World Bank database in order to construct econometrical model, which will include variables connected with oil prices and economic growth in United Arab Emirates for a period from 1995 to 2015 in order to establish the relationship between them.
Crude oil, economic growth, econometrical model, t-statistic, probability of mistake
Short address: https://sciup.org/140122435
IDR: 140122435
Text of the scientific article The influence of oil prices on economic growth. The case of United Arab Emirates
Literature review of this problem and historical path of oil prices
Crude oil is the most important commodity for oil-exporting countries, among which is United Arab Emirates. This commodity provides the country with the greatest part of revenues and the currency inflows. According to the data, in 1995 the annual amount of oil production was 290 thousand barrels per day, 83% of which accounted for Abu-dabi, 15% for Dubai and 2% Shardzha. From 1967, the United Arab Emirates is a member of OPEC (Organization of petroleum exporting countries, which was established in 1960 and nowadays has 13 countries as members, among which are Algeria, Angola, Ecuador, Gabon, Iran, Iraq, Kuwait, Libya, Nigeria, Qatar, Saudi Arabia, United Arab Emirates and Venezuela). Because of this membership, oil produces in UAE have to follow the overall policy of this organization and consider some quotes, which were imposed on them. However, as we can see from the history, the country consider this quotes only as recommendations and did not follow them always (for example, we can take in consideration the fact, that during the invasion of Iraq in Kuwait, the amount of produced oil was twice bigger than the amount of quotes).
However, like every another commodity, oil prices were not always stable and some shocks occurred. For a better understanding of this situation, it is important to consider the following graph and understand the reasons behind significant changes in oil prices.
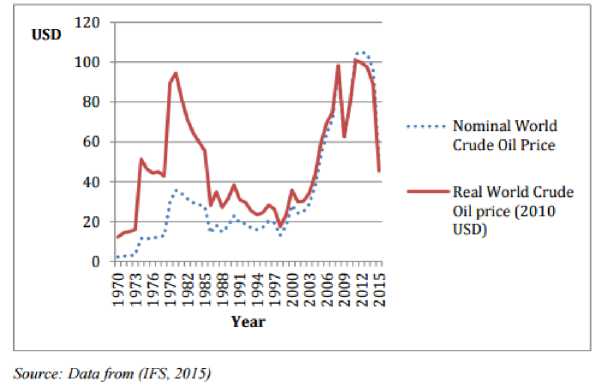
First significant change took place in 1973-1975, when the real world crude oil price skyrocketed from 18 dollars per barrel to more than 45 dollars per barrel. It happened because some Western European countries and the United States supported Israel during the Middle Eastern War and OPEC imposed oil embargo on them. The second change took place in 1978, when in Iran happened the Revolution. The third shock was connected with the Asian Financial Crisis (1997), causing the significant decrease in the demand for this commodity. The forth shock took place in 2008, when the global financial crisis hit each economies. And after reaching the price of USD 115 per barrel in the middle of 2008, the price decreased by more than 2,5 times and was amounted for USD 44 per barrel. The oil market managed to recover from this crise only after four years and in 2012 the prices on crude oil increased to USD 2012. However, this situation did not last for a long time and in the middle of 2014 the fifth shock took place, when after the announcement of OPEC that they were not going to cut their production, the prices fell from USD 106 to USD 51 per barrel. We can conclude, that the market itself is unstable and it is really crucial to understand the impact of these changes on economies, especially for oil-exporting countries.
After my investigation of articles, in which were examined the factors influencing an economic growth, I came to a conclusion that all these factors can be divided into three groups. The first group consists of indicators, which are connected with the financial development. Among these indicators are private credit, commercial credit, interest rates, reserves of banks and so on. The second group is represented by the indicators of international trade and productivity, namely the amount of export, import, productivity of labor and others. The third group has indicators of macroeconomic stability (or instability), the most important of which is inflation. I want to include in my equation some indicators from each of the group mentioned above plus the indicators of oil sector in order to evaluate, whether the influences of oil sector on economic development is a significant indicator for country under consideration or not.
Modelling financial development and economic growth
In order to evaluate the relationship between oil prices and economic growth in UAE and find out which indicators have the most significant influence on economic growth, I choose the following data for a period of 21 years for a
|
Year |
GDP trln (current US$) |
Annual imported crude oil price ($ per barrel) real prices |
Trade (% of GDP) |
Imports of goods and services trln (current US$) |
Exports of goods and services trln (current LCU) |
|
Y |
X(1) |
X(2) |
X(3) |
X(4) |
|
|
1995 |
66 |
27 |
75 |
35 |
161 |
|
1996 |
74 |
32 |
76 |
36 |
165 |
|
1997 |
79 |
28 |
79 |
38 |
167 |
|
1998 |
76 |
18 |
85 |
47 |
178 |
|
1999 |
84 |
25 |
87 |
45 |
174 |
|
2000 |
104 |
39 |
80 |
42 |
180 |
|
2001 |
108 |
30 |
91 |
46 |
187 |
|
2002 |
110 |
32 |
93 |
48 |
200 |
|
2003 |
124 |
37 |
102 |
58 |
255 |
|
2004 |
148 |
46 |
117 |
78 |
345 |
|
2005 |
181 |
61 |
120 |
94 |
448 |
|
2006 |
222 |
71 |
119 |
113 |
560 |
|
2007 |
258 |
79 |
137 |
166 |
686 |
|
2008 |
315 |
105 |
149 |
220 |
914 |
|
2009 |
254 |
67 |
153 |
187 |
742 |
|
2010 |
286 |
85 |
151 |
207 |
827 |
|
2011 |
349 |
111 |
163 |
252 |
1156 |
|
2012 |
373 |
107 |
176 |
281 |
1380 |
|
2013 |
389 |
103 |
176 |
293 |
1442 |
|
2014 |
402 |
92 |
173 |
306 |
1437 |
|
2015 |
370 |
48 |
180 |
308 |
1324 |
UAE:
|
Year |
Fuel exports (% of merchandise exports) |
Oil rents (% of GDP) |
Inflation, GDP deflator (annual %) |
Market capitalization of listed domestic companies trln(current US$) |
Bank liquid reserves to bank assets ratio (%) |
|
X(5) |
X(6) |
X(7) |
X(8) |
X(9) |
|
|
1995 |
86 |
14 |
4 |
18 |
8 |
|
1996 |
88 |
17 |
6 |
18 |
8 |
|
1997 |
87 |
14 |
-1 |
20 |
9 |
|
1998 |
91 |
8 |
-4 |
21 |
9 |
|
1999 |
91 |
11 |
8 |
23 |
10 |
|
2000 |
94 |
18 |
11 |
21 |
9 |
|
2001 |
92 |
17 |
-2 |
23 |
11 |
|
2002 |
95 |
12 |
4 |
23 |
10 |
|
2003 |
87 |
15 |
4 |
25 |
10 |
|
2004 |
73 |
18 |
9 |
55 |
11 |
|
2005 |
58 |
21 |
17 |
123 |
9 |
|
2006 |
60 |
23 |
12 |
71 |
9 |
|
2007 |
65 |
21 |
13 |
126 |
29 |
|
2008 |
65 |
24 |
19 |
107 |
10 |
|
2009 |
60 |
16 |
-15 |
138 |
13 |
|
2010 |
57 |
20 |
11 |
131 |
14 |
|
2011 |
56 |
25 |
16 |
94 |
13 |
|
2012 |
54 |
25 |
0 |
101 |
14 |
|
2013 |
52 |
24 |
-1 |
180 |
15 |
|
2014 |
42 |
21 |
0 |
202 |
15 |
|
2015 |
41 |
11 |
-11 |
196 |
17 |
|
Year |
Broad money (% of GDP) |
Final consumption expenditure trln (current US$) |
World crude oil production (mln barrel per day) |
Crude oil inventories (mln barrels) |
Crude oil future contract ($ per barrel) |
|
X(10) |
X(11) |
X(12) |
X(13) |
X(14) |
|
|
1995 |
34 |
53 |
62 |
307 |
18 |
|
1996 |
32 |
58 |
64 |
290 |
22 |
|
1997 |
33 |
61 |
66 |
314 |
21 |
|
1998 |
36 |
61 |
67 |
329 |
14 |
|
1999 |
36 |
69 |
66 |
290 |
19 |
|
2000 |
33 |
71 |
68 |
286 |
30 |
|
2001 |
37 |
73 |
68 |
315 |
26 |
|
2002 |
42 |
79 |
67 |
274 |
26 |
|
2003 |
43 |
85 |
69 |
267 |
31 |
|
2004 |
45 |
103 |
72 |
293 |
41 |
|
2005 |
48 |
116 |
74 |
320 |
57 |
|
2006 |
48 |
140 |
73 |
321 |
66 |
|
2007 |
59 |
173 |
73 |
290 |
72 |
|
2008 |
58 |
207 |
74 |
334 |
100 |
|
2009 |
78 |
159 |
72 |
329 |
62 |
|
2010 |
74 |
189 |
74 |
338 |
80 |
|
2011 |
64 |
204 |
74 |
335 |
95 |
|
2012 |
62 |
192 |
76 |
365 |
94 |
|
2013 |
73 |
200 |
76 |
355 |
98 |
|
2014 |
76 |
219 |
78 |
398 |
93 |
|
2015 |
87 |
216 |
80 |
492 |
49 |
Source: World Bank database
According to these data, the system of equations of economic growth can be written down this way:
Y = c1 + ^2-^1 + ^3-^2 + сл + Q^4 + Q*5 + c7x6 + c8x7 + c9x8 + CiqX9 +
СцХ10 + С^Хц + Pl
1= + ^14^12 + ^15^13 + ^16^14 + P2
Before estimating this system, it is important to treat each equation independently and consider the factors this equation has. The formula of first equation is:
Y = Cl + C2X1 + C3X2 + C4X3 + C5X4 + c6x5 + C7X6 + C8X7 + C9Xq + Ci9X9 +
СцХ10 + C12X44 + Pl
|
Letter |
Variable |
Explanation |
|
Y |
GDP trln (current US$) |
GDP is the main indicator of economic growth, because it represents the monetary value of all the finished goods and services produced during a particular period. |
|
*1 |
Annual imported crude oil price ($ per barrel) real prices |
I used this indicator as one of the measurements of oil prices. |
|
^2 |
Trade (% of GDP) |
Trade as a percentage of GDP will help us to estimate the influence of this indicator on the economic growth of a country. |
|
^3 |
Import of goods and services trln (current US) |
Import is one of the main economic indicators, therefore, it is crucial to include this variable in the equation. |
|
^4 |
Export of goods and services trln (current US) |
Export is one of the main economic indicators, therefore, it is crucial to include this variable in the equation. |
|
^5 |
Fuel exports (% of merchandise export) |
I decide to include this indicator in the equation in order to find the influence on economic growth not only of the export as a whole, but also of the fuel export. |
|
Oil rents (% of GDP) |
Oil rents is the difference between the revenues and costs of oil produces, therefore, this indicator is a proxy of country’s oil wealth. |
|
|
x7 |
Inflation (GDP deflator) annual % |
Inflation is a proxy of macroeconomic stability (or instability) of a country, therefore, it is important factor to consider during the estimation of economic growth. |
|
^8 |
Market capitalization of listed domestic companies trln (current US) |
Market capitalization (also known as market value) is the share price times the number of shares outstanding. Listed domestic companies are the domestically incorporated companies listed on the country’s stock exchanges at the end of the year. Thus, I will use this indicator as a proxy for financial sector measurement. |
|
^9 |
Bank liquid reserves to bank assets (%) |
Ratio of bank liquid reserves to bank assets is the ratio of domestic currency holdings and deposits with the monetary authorities to claims on other governments, nonfinancial public enterprises, the private sector, and other banking institutions. |
|
^10 |
Broad money (% of GDP) |
Broad money is the method of calculating country’s money supply. The money supply is the totality of assets that households and businesses can use to make payments. Therefore, this indicator serves as a proxy for financial market development. |
|
^11 |
Final consumption expenditure trln (current US) |
Final consumption expenditure is the expenditure on goods and services that is used for direct satisfaction of individual or collective needs. These expenditures will stimulate the economic growth, therefore, I include them in the equation. |
The formula of second equation is:
^1 = + ^14^12 + ^15^13 + ^16^14 + ^2
|
Letter |
Variable |
Explanation |
|
*1 |
Annual imported crude oil price ($ per barrel) real prices |
I used this indicator as one of the measurements of oil prices. |
|
^12 |
World crude oil production (mln barrels per day) |
In according with fundamental economic theory, an increased oil supply leads to a lowering of its price. |
|
^13 |
Crude oil inventories (mln barrels) |
When the price of oil is low, the producers will be increase the amount of inventories in order to force the increase in prices. |
|
^14 |
Crude oil future contract ($ per barrel) |
Futures contract prices are usually used as a benchmark for the future prices, however, these prices may be not justified and, therefore, companies may adjust their production or consumption of oil applying the wrong assumptions. |
Econometrical model
According to my model, the dependent variables are annual imported crude oil price in US dollars per barrel and current GDP (in USD dollars). The independent variables are trade as a percentage of GDP, imports and exports of goods and services in current prices, fuel export as a percentage of merchandise exports, oil rents as a percentage of GDP, inflation in form of GDP deflator, market capitalization of listed domestic companies in current prices, bank liquid reserves to bank assets ratio, broad money as a percentage of GDP, final consumption expenditure, world crude oil production, crude oil inventories and crude oil future contract prices. Data for all these indicators for a period of 21 years were taken from World Bank database.
Interpretation of results
With the help of Eviews, I got the following data:
System: UAE
Estimation Method: Two-Stage Least Squares
Date: 02/05/17 Time: 17:21
Sample: 1995 2015
Included observations: 21
Total system (balanced) observations 42
|
Coefficient |
Std. Error |
t-Statistic |
Prob. |
|
|
C(1) |
-115.6860 |
28.2449 3 |
-4.095815 |
0.0004 |
|
CP) |
-0.322397 |
0.174602 |
-1.846469 |
0.0767 |
|
Ф) |
0.302 0 36 |
0.196842 |
1.534407 |
0.1375 |
|
C(4) |
-0.752153 |
0.216363 |
-3.476342 |
0.0019 |
|
ОД |
0.236883 |
0.035478 |
6.676803 |
0.0000 |
|
C(6) |
0.610486 |
0.208374 |
2.929756 |
0.0071 |
|
0(7) |
1.92 0 535 |
0.699836 |
2.744265 |
0.0111 |
|
0(8) |
-0.315250 |
0.23536 9 |
-1.339388 |
0.1925 |
|
0(9) |
0.042098 |
0.062195 |
0.676872 |
0.5047 |
|
C(10) |
-0.191586 |
0.271363 |
-0.706013 |
0.4867 |
|
C(11) |
0.350571 |
0.360612 |
0.972156 |
0.3403 |
|
0(12) |
1.294051 |
0.164389 |
7.871895 |
0.0000 |
|
0(13) |
71.76680 |
23.62 8 53 |
3.0 37294 |
0.0055 |
|
0(14) |
-0.939894 |
0.414794 |
-2.26 5927 |
0.0324 |
|
0(15) |
0.240416 |
0.205927 |
1.167485 |
0.2540 |
|
0(16) |
-0.036485 |
0.031200 |
-1.169404 |
0.2533 |
|
0(17) |
1.017010 |
0.088624 |
11.47561 |
0.0000 |
Determinant residual covariance 51.38057
With the help of Excel I found, that t critical is equal to 1,76 (with the level of certainty 90%). It means, that hypothesis about the relationship between oil prices and economic growth is confirmed with t-statistic of annual imported crude oil prices equals to 1,85 and the probability of mistake equals to 7,7%. In addition to this, according to the table provided above, the absolute amount of C(3), C(8), C(9), C(10), C(11), C(15) and C(16) is accounted for 1,53; 1,34; 0,68; 0,71; 0,97; 1,17 and 1,17, which is lower than the value of t critical, therefore, these indicators are insignificant. Moreover, if we take into account the probability of mistake, we may notice, that the abovementioned coefficients have very high probabilities of mistakes, which account for 14%, 19%, 50%, 49%, 34%, 25% and 25%. It means, that trade, inflation, market capitalization of listed domestic companies, bank liquid reserves to bank assets ratio, broad money, world crude oil production and the prices of oil future contracts do not have a significant influence on the economic development of the United Arab Emirates, the level of which was measured with the help of GDP. At the same time, an annual imported crude oil price per barrel, import and export of goods and services, fuel exports, oil rents, final consumption and crude oil inventories are significant indicators and, therefore, have a great impact on GDP. In order to estimate the whole system, we need to find the value of R-squared in each equation:
Equation: Y = C(1) + C(2)*X_1_ + C(3)’X_2_ + C(4)’X_3_ + C(5)*X_4_ + C(6)’X_5_ + C(7)’X_6_ + C(8)*X_7_ + C(9)*X_8_ * C(10)*X_9_ + C(11) *X_10_*C(12)*X_11_
Instruments: X 2X3X4X5X6X7X8X9X10X11
X 12 X 13 X 14 C
Observations: 21
|
R-squared |
0.999498 |
Mean dependentvar |
208 1485 |
|
Adjusted R-squared |
0.998884 |
S.D. dependent var |
121.5770 |
|
S.E. of regression |
4.061893 |
Sum squared resid |
148.4908 |
|
Durbin-Watson stat |
2.196040 |
Equation: X_1_ = C(13) + C(14)*X_12_ + C(15)*X_13_ + C(16)*X_14_
Instruments: X 2X3X4X5X6X7X8X9X10X11
X 12 X 13 X 14 C
Observations: 21
|
R-squared |
0.990395 |
Mean dependentvar |
59.19988 |
|
Adjusted R-squared |
0.988700 |
S.D. dependent var |
31.32513 |
|
S.E. of regression |
3.329861 |
Sum squared resid |
188.4956 |
|
Durbin-Watson stat |
1.631933 |
As we can see, R-square equals to nearly 1 in the first equation and 0,99 in the second equation. It means, that the model passed the R-square test (because R-squares in both cases are higher than 0,7) and the equation can be explained with the help of included factors by 100% and 99%. However, when the amount of R-square is so high, it means, that we have a problem of multicollinearity, in other words, some of instrumental variables are dependent from the other instrumental variables.
Then, to test the residuals of the model for autocorrelation we can use Durbin-Watson test. With the help of Eviews and tables of value of Durbin-Watson statistics for n=21 and k=9 and 17 we can find that the values are the following: DW 1 = 2,2 DW 2 = 1,63 and Dl =0,73 and Du=2,12. It means, that the value of DW2 is on the interval (0,73; 2,12), which means that it is impossible to conclude about autocorrelation of residuals.
Conclusion
The main role of my research was to identify and analyze the influence of oil prices on economic growth of United Arab Emirates. In order to estimate this relationship, I use GDP as a proxy for economic growth (dependent variable) and measure this parameter with the help of the following indicators: annual imported oil price (in dollars per barrel) in real prices, trade as a percentage of GDP, import and export of goods and services in current prices, fuel export as a percentage of merchandise exports, oil rents as a percentage of GDP, inflation in form of GDP deflator, market capitalization of listed domestic companies in current prices, ratio of bank liquid reserves to assets, broad money indicator as a percentage of GDP and final consumption expenditure in current prices. Then I construct the second equation for estimation of annual imported oil price, in which I include amount of world crude oil production in million barrels per day, amount of crude oil inventories in million barrels and price of crude oil future contract in dollars per barrel.
With the help of Excel I proved the hypothesis about the relationship between oil prices and economic growth with t-statistic of annual imported crude oil prices equals to 1,85 (while t critical equals to 1,76) and the probability of mistake equals to 7,7%. In addition to this, according to the data, trade, inflation, market capitalization of listed domestic companies, bank liquid reserves to bank assets ratio, broad money, world crude oil production and the prices of oil future contracts do not have a significant influence on the economic development of the United Arab Emirates, the level of which was measured with the help of GDP. At the same time, an annual imported crude oil price per barrel, import and export of goods and services, fuel exports, oil rents, final consumption and crude oil inventories are significant indicators and, therefore, have a great impact on GDP.
References The influence of oil prices on economic growth. The case of United Arab Emirates
- I.V. Tregub "Mathematical models of econometric systems’ dynamic".
- I.V. Tregub "International diversification".
- World Bank "How is the United Arab Emirates Reacting to Low Oil Prices?"
- Hanna Boheman and Josephine Maxen "Oil price shocks effect on economic growth. OPEC versus non-OPEC Economies".
- Nasser Al-Mawali, Haslifah Mohamad Hasim, Khalil Al-Busaidi "Modeling the impact of the oil sector on the economy of sultanate Oman".
- International Monetary Fund "The impact of higher oil prices on the global economy".
