The Method of Measuring the Integration Degree of Countries on the Basis of International Relations

Author: Rasim M. Alguliyev, Ramiz M. Aliguliyev, Gulnara Ch. Nabibayova
Journal: International Journal of Intelligent Systems and Applications(IJISA) @ijisa
Article in issue: 11 vol.7, 2015.
Free access
The paper studies the concept of integration, the integration of countries, basic characteristics of the integration of countries, the integration indicators of countries. The number of contacts between countries and the number of contracts signed between countries are offered as the indicators to determine the integration degree of countries. An approach to the design of the data warehouse for the decision support system in the field of foreign policy, using OLAP-technology is offered. Designed polycubic OLAP-model in which each cube is based on a separate data mart. Given the differences between the data warehouse and data mart. Shown that, one of the cubes of this model gives full information about the chosen indicators, including their aggregation on various parameters. Method for measuring the degree of integration of the countries, based on the calculation of the weight coefficients is proposed. In this regard, was described the information model of the relevant subsystem by using graph theory. Practical application of this method was shown. Moreover, the used software was shown.
Integration, integration of countries, indicators of the integration degree of countries, decision support system, data warehouse, data marts, OLAP, OLAP-cube
Short address: https://sciup.org/15010764
IDR: 15010764
Text of the scientific article The Method of Measuring the Integration Degree of Countries on the Basis of International Relations
Published Online October 2015 in MECS
The fundamental principle of the international relations of any country includes its interaction with other states. The spheres and directions of international cooperation are diverse. They include economic, political, legal, social, ideological, diplomatic, military, cultural and other fields.
Integration between countries, which is nowadays observed ubiquitously, has recently become particularly important among the most obvious manifestations of the basic patterns of international relations. The trend of integration is a higher level of interaction between the states, its deepening, and the development of relations.
Integration (from lat. integratio – “connection”) – is connectedness of individual differentiated parts and functions of a system or a body forming an organic whole, as well as a process leading to such a state [1]. It is known that the term was first used in the 1930s by the German scientist Carl Schmidt in his “Theory of large Spaces” (“Grossraumtheorie”) [2]. Nowadays, the term has gained a widespread use in various fields, such as biology, physics, chemistry, policy, and information, social, cultural and others.
The article aims at developing a method to measure the integration degree of countries within the framework of the decision support system (DSS) in foreign policy with the use of OLAP-technology.
Studies, which include a review of the relevant literature, as well as an analysis of available software, showed that currently, DSSs are being developed and constantly improved in different areas. For example, various approaches to their creation in medicine, healthcare, education, management, marketing, etc., using Business Intelligence technologies, i.e. OLAP and Data Mining, are considered in [3-5]. In [6] designed the urban earthquake disaster reduction information management system, where applied a variety of information techniques, such as GIS and database, and which assisted the decision-making system effectively for the earthquake emergency work.
It should be noted that Inter-agency automated information retrieval system “Entry, exit, and registration” has established and currently functioning in Azerbaijan. The system aims at improving the efficiency of relevant public authorities in this area, providing information supply, as well as automating the document flow, allowing inspection, querying, analysis, etc. A distinguished feature of our DSS is its multipurposeness. Thanks to its rich DW it can help solving human resources, financial and other issues, as well as integration issues of the country. In the future, the merger of these systems can be considered for their mutual enrichment.
The paper offers an approach to the design of a data warehouse (DW) for decision support system (DSS) in foreign policy (FP), as well as a method of determining the integration degree of the countries.
Thus, the relevance of the subject of this article is as follows: firstly, the application of the proposed approach to DW design will prepare the ground for qualitatively new information layer; secondly, the method of determination of the integration degree of countries proposed in the paper will provide substantial support to a decision maker in this area.
The following chapter of the article discusses the main characteristics of the integration of the countries, among which the indicators determining the integration degree of the countries are highlighted. The III chapter describes the model of information interaction of DSS in foreign policy, highlights the inclusion of DW and data marts (DM) into the information infrastructure of DSS shows their major differences, and offers a method for determination of the integration degree of countries. The IV chapter considers the practical application of the proposed method with a visual representation as a linear diagram. In the V chapter (conclusion) the benefits of integration are described, and the significance of the indicators of integration degree of the countries in the studies of various aspects of integration is highlighted.
-
II. Main Characteristics of The Integration of Countries
Integration of countries is a voluntary and purposeful process of rapprochement, mutual adaptation, and then splice of national political and financial systems of these countries. This process has the potential of regulation and development, and is based on the interests of these countries, which indicates that the integration is a consciously regulated process. The key objective of the integration of the countries is a search for, and extension of forms and methods of cooperation on the basis and as a result of the efficiency of regional and international activity. Integration dramatically increases the capacity of the subjects to solve problems qualitatively, while ensuring internal stability. The more solidary the group of actors involved in the integration process is, the more rational and stronger is their impact on the systems of international relations [7].
It can be noted that nowadays each state seeks to participate in the integration processes. In terms of globalization, an important motivation for this is the fact that the country, which stands aside from the integration process for any reason, will be out of its major development directions [8].
The main characteristics of the integration of countries are as follows [7].
Integration prerequisites:
-
• high level of socio-economic, legal and political development, affecting the level of maturity of
integrating subjects;
-
• common problems faced by the countries in the area of development and cooperation;
-
• demonstrational effect, when improvements affecting the social relations occur as a result of the process;
-
• significant difficulties experienced by the entity, which is not involved in the integration processes. Therefore, some entities without initial interest in this process are later obliged to join it.
Integration objectives:
-
• taking advantage of macroeconomics;
-
• creating favorable condition for foreign policy;
-
• solutions of customs policy;
-
• promoting economic restructuring;
-
• supporting new fields of national industry.
Indicators determining the integration degree of states can be classified as follows:
-
1. Level of legal awareness of citizens: an individual is conscious of himself not just as a citizen of any state, but also as a “citizen” of some international community;
-
2. Presence of structures with a large number of supranational authorities, in other words, the presence of supranational institutions. One of the main features of a supranationality is that decisions are made by the body, which is not composed of the representatives of the national authorities, and does not follow their instructions, but is guided by its own rules, the political line and moral standards [9]; The more there are such structures, the higher the integration degree is;
-
3. The number of international agreements concluded between the governments;
-
4. The number of contacts between government bodies of the countries.
The first and second items in this classification can be classed as qualitative indicators and the third and fourth as quantitative ones. Thus, developing more reliable contacts, ties and relations between countries in the various spheres of activity removing multiple obstacles to their cooperation is necessary for the implementation of the integration process [7].
-
III. Defining the Integration Degree
One of the most pressing problems today is the need for the improvement of management and decisionmaking in e-Government, which will increase the efficiency of internal affairs of government bodies (GB), and will raise its quality.
Globalizing world and expansion of international relations have led to the fact that FP has become one of the most important activities of any GB. As in other areas, making the right management decisions becomes very essential here.
In the normal course of business, responsible officials working in this area have to solve problems associated with the state of the relations with this or that country, with the reliability of long-term or permanent foreign partner, with the choice of foreign company for the acquisition of the necessary equipment, with the participation of a delegation in an international forum, etc. For their solution, it is necessary to analyze the information related to this area available to GB. However, the growing volume, heterogeneity and multidimensionality of the data, which require the development of a clear structure, cause significant problems.
It is offered to establish DSS using OLAP technology (OLAP - online analytical processing) and HD in order to carry out informational and analytical work to support decision-making in FP [10].
The concept of OLAP in its present representation was first described by Codd in 1993 [11]. OLAP is an interactive analytical processing, which unlike the flat relational data model is able to simulate real structures and connections that are essential for analytical systems, based on a multi-dimensional (hypercube) data model. With the help of OLAP technology multi-parameter models are developed with the purpose of more adequate representation of real processes.
DW is one of the main parts of the architecture of DSS. With the advent of ETL (Data Extraction, Transmission, Loading) and OLAP in the early 90s DW began active spread in the commercial sector. Nevertheless, at present, public institutions experience a huge demand for this technology as well [12]. The DW of a system includes both the current data from the OLTP systems (OLTP – On-line Transaction Processing), and historical data, as well as the data from external sources. All these sources are combined by the data integration technology.
As the DSS being developed is a multi-purpose one, the development of its DW is a complex and large-scaled work. Two main points shall be taken into account while designing it. Firstly, all the data that is needed to solve the subtasks covered by the DSS should be included from the beginning. This eliminates the need to add and fill new fields in the future. Secondly, it’s important to take into account that the main function of DW is processing and analysis of the data stored in it. The time of execution of the query procedure or analysis procedure should be minimal to ensure their efficiency. Therefore, it includes not only the raw data from the original sources, but also the generalized information obtained as a result of aggregation. Figure 1 shows the model of information interaction of the system [13].
Proposed model enables tracking of the information communications between the elements of the system and the directions of the main information flows, and ensures integration of DWs of all levels.
The DSS is based on the information about the contacts of GB staff with foreign countries. Internal sources of information for DW of this DSS include the reports about the foreign contacts, which come from the OLTP systems, or stored in paper or electronic form in different parts of the organization. This provides the information about the number of foreign contacts, which is an indicator of the integration degree.
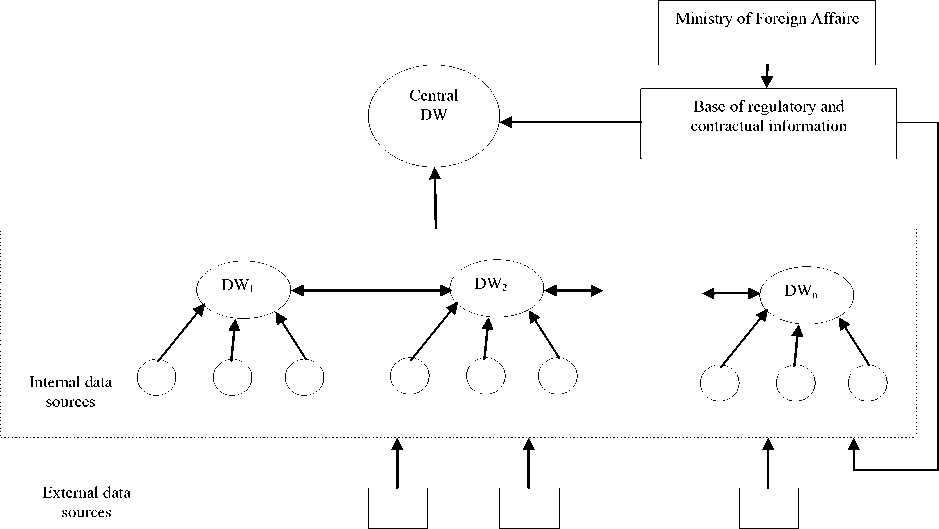
Fig.1. The model of data interaction of DSS in FP.
It is appropriate and useful to use regulatory and contractual database as an external data source of the DW.
This database contains documents such as contracts, agreements, etc., as well as information about these documents (title, date of signing, expiration date, etc.). These documents can be both bilateral and international, which include these countries. Processing of this data according to some key characteristics gives a new powerful source of information that is essential for decision-making support. Thus, we get another indicator of the integration degree of the states. Note that, the external data is acquired only in those organizations, which specialize in its collection.
Thus, the DW of the DSS being developed for FP includes two important indicators of integration degree of the states: the number of contacts between the government agencies and the number of bilateral treaties, as well as international agreements, which include those countries.
As it is mentioned above, the developed DSS in FP is a multi-purpose in its nature, that is, with its help it is possible to solve management problems in various aspects. For this purpose, DMs are extracted from DW. Thus, the information infrastructure of the system may include not only DW, but also DM (Fig. 2).
DMs are arrays of thematic and narrow-directed information intended for the users of one department of government body. As in the case with DWs, with the help of analytical tools (OLAP in this case), it is possible to analyze this data, identify trends, predict future results. Note that DM is a simple form of DW and is focused on one functional area [14].
DMs are intended for solution of subtasks of the primary task. Thereby, for each subtask in accordance with its requirements its own OLAP cube is built, the measures of which are the data of relevant DM. Thus, several OLAP cubes can be built on the basis of one DW. In the first case, we’ll call the OLAP model hypercubic, and in the second – polycubic [15].
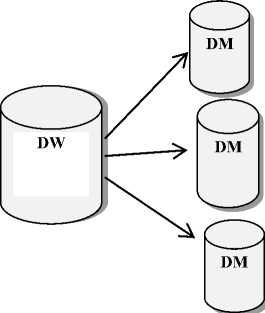
Fig.2. Data warehouse and data marts
DM is an information infrastructure of a subsystem, which is specialized in a specific task. The scale and complexity of the structure of DMs, which also serve to support decision-making, have no restrictions.
Nevertheless, DMs, as a rule, are smaller and less complex than DWs. Consequently, they are generally easier to develop and maintain. Table 1 summarizes the main differences between DW and DM.
Table 1. The differences between DW and DM
|
Category |
DW |
DM |
|
Volume |
Corporate |
Separate functional area |
|
Task |
Multiple |
Single |
|
Data sources |
Many |
Few |
|
Scale (usually) |
from 100 Gb to 1TB and above |
<100 Gb |
|
Implementation period |
from several months to several years |
a few months |
The current task is to define the integration degree of countries. The DM of this subtask includes two dimensional cube with the dimensions “Date” and “Country”. Depending on the queries the results may include various cube sections. The aggregate function is COUNT. Its results will be placed in the cells of the cube. They will be either the values of the contacts, or the values of the contracts with foreign countries.
Let’s describe the information model of the subsystem corresponding to the task of determining the integration degree of a country into others, using graph theory [16].
Figure 3 shows a graph G = (V, M), where V is a set of vertices (n + 1), and M is a set of 3n arches. Let’s describe the graph more thoroughly.
The graph has a hierarchical structure. This is due to the fact that the vertices of the 1st level (country A) is connected to each of the vertices of the 2nd level (country B k , k = 1, n) with 3 edges, i.e. its degree is 3n, and each of the vertices of the 2nd level has degree 3.
The graph is mixed. This is due to the fact that two of the three edges corresponding to the contacts between the countries are directed (i.e., arches), and the third one corresponding to existing contracts is undirected. Note that, the contacts mean an either entry to the country, or an exit from the country.
The graph is weighted, since each edge has a weight. The weight of directed edges is the number of the contacts between the countries (entries and exits), and of undirected ones is determined by the number of contracts signed with the given country. In the graph, denotes the number of entries into the given country from the j-th country, denotes the number of exits from the given country into the j-th country, Kj denotes the number of signed contracts.
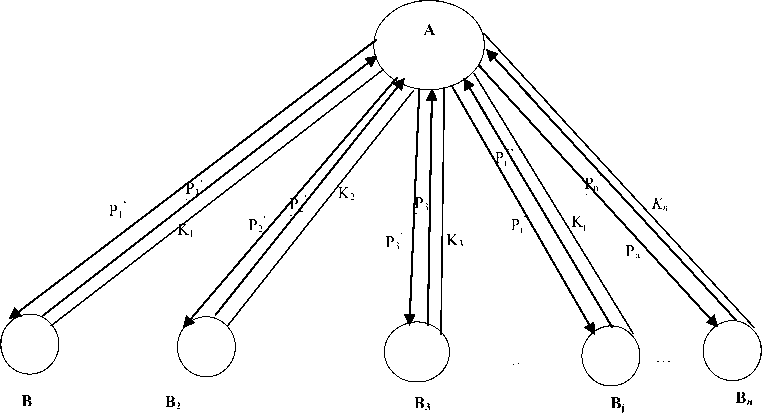
Fig.3. The graph of the subsystem used to determine the degree of integration of countries
Note that, a feature and advantage of OLAP is an ability to build various pivot tables from the DW. The required data is obtained by software from the pivot tables of OLAP cube, and taken into account in determining the integration of the given country into the j- th country. The weighted sum of the values of indicators is found to define the integral indicator of the integration into the j- th country:
Wj = wP + wK (1)
Where is an integral indicator; is a weight of the indicator “contacts” (with the j -th country), is a weight of the indicator “contracts” (signed with the j -th country):
wP = wPPj(2)
WK = wKK(3)
-
- is a number of contacts with j -th country
P = P, + P(4)
-
- is a number of contracts signed with the j-th country.
and are the weight coefficients of “contacts” and “contracts” respectively. They are defined as follows:
W P
WK
nP
^^ i=1 i nK
Z—i i = 1 1
Likewise, the integration degree of the country to another one is defined for each field of activity separately: scientific, educational, economical, political, legal, social, ideological, diplomatic, military, cultural and so on. In this case, the integral indicator is evaluated separately for each area taking into account the contacts and the contracts in the particular area.
The integration indicator of the given country into the j-th country is evaluated each year. The number of the contacts made during the reporting year, and the number of contracts in force during the reporting year is taken into account. This enables to trace the dynamics of the change of the integration of one country into another over the years.
The integration of the country into an international organization, such as the EU (European Union), OPEC (Organization of the Petroleum Exporting Countries), BSEC (Organization of the Black Sea Economic Cooperation) etc. may also be evaluated. Here we have:
l
W1 = ^ W j (7) i = 1
Here denotes the integration of the country into the international organizations, which include, the countries l , and denotes the integration of the country into each of the countries l , included in this organization.
-
IV. Case Study
The Institute of Information Technology (IIT) of the Azerbaijan National Academy of Sciences (ANAS) has developed a DSS based on data about the official foreign trips of its employees, since January 2003. This information was provided by the Department for External Relations, Human Resources, and Department of Archive of the Institute.
Table 2 shows the distribution of the total number of contacts and the number of contracts, as well as the weight coefficients by years (2003–2014), calculated according to the formulas (5) and (6) for the contacts and the contracts, respectively.
Table 2. Distribution of the total number of contacts and contracts, and their weight coefficients by years
|
Year |
Contacts |
Contracts |
||
|
quantity |
weight |
quantity |
weight |
|
|
2003 |
6 |
0.17 |
56 |
0.02 |
|
2004 |
7 |
0.14 |
65 |
0.02 |
|
2005 |
3 |
0.33 |
50 |
0.02 |
|
2006 |
5 |
0.20 |
34 |
0.03 |
|
2007 |
4 |
0.25 |
29 |
0.03 |
|
2008 |
2 |
0.50 |
27 |
0.04 |
|
2009 |
6 |
0.17 |
21 |
0.05 |
|
2010 |
7 |
0.14 |
31 |
0.03 |
|
2011 |
15 |
0.07 |
12 |
0.08 |
|
2012 |
17 |
0.06 |
12 |
0.08 |
|
2013 |
18 |
0.06 |
10 |
0.10 |
|
2014 |
15 |
0.07 |
1 |
1.00 |
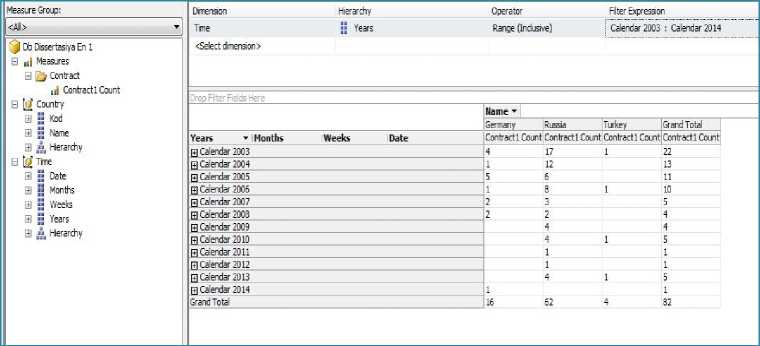
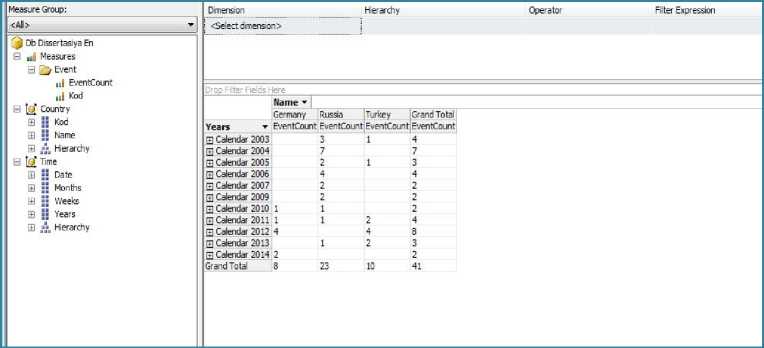
Figures 4 and 5 provide a complete representation of official foreign trips and contracts signed with foreign countries, built in OLAP cube based on the two dimensions “Date” and “Country”. The figures show that detailed information can also be presented quarterly and monthly.
^ Analysis Services Projects - Microsoft Visual Studio (Administrator)
File Edit View Project Build Debug Database Cube Tools Window Help
-J ' d J -J - ' ► | Development - | ^ ^ j^ В □ " ';
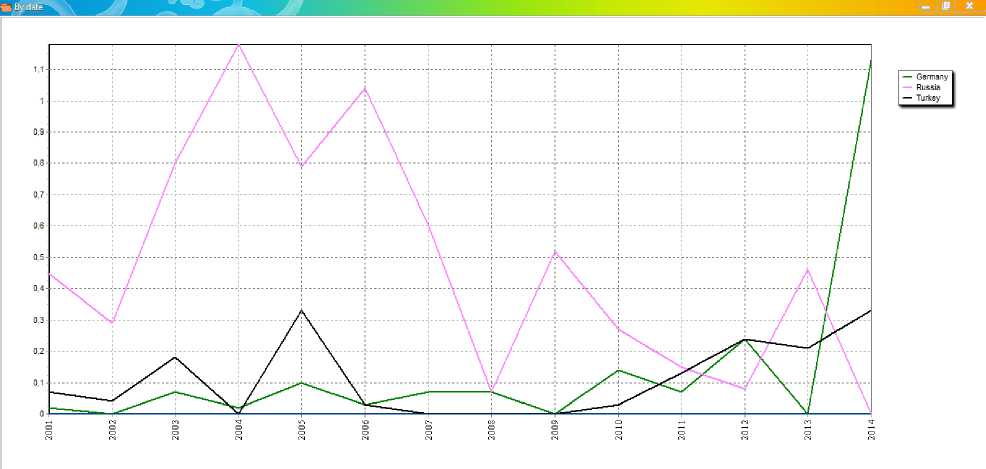
У DbDk - X Й[ Cube Structure |^J Dimension Usage |l^ Calculations |^ KPIs [^ Actions |^ Partitions ||}Z Apgregations Qj Perspectives |l [ ^1 Hh Hiccprkwiy 1+1 «oil Measures В У OLy 5 0 Kod 0 » Name a У events 0 У Time 1 Dimension Hierarchv Ooerasor Filter Excression Drop Filer Fields Here Year т Quarter □ Calendar 2003 0 Calendar 2004 Q Cdltliddl 2005 щ ralmriar 7ПП6 QCdltnddi 2007_________ 0 Calendar 2008 в Cdltnddr 2009_________ ВГаЫаг ?П1П Mnnfh Count name ▼ I | Hungary j Iceland | |Irclandi l|l^lipdn|K«Eal4i^|KQra^Kyryyz3tixijLatviya|Moldova|lIomarra|[li^jEwitmhid|Tliafaid|lhcNcth'cflimd3|Tjrkcy|l№|u^^ Grand Toto CuuriL CuuriL CuuriL ECdltnildi 2D 11 Q Calmdnr X112 □ Cdltliddl 2013 CuuriL EQudrlei 1,2013 QQnnrh-r ?, Hill 0 Илу Х1 ? 0 June 2C13 CuuriL CuuriL щ quarter 3, 2012 g Quarter 4,7013 Count 0 СяИаг 7014 GidridTuldl Fig.4. OLAP cube, developed for representation of contacts based on the two dimensions “Date” and “Country”. Re Edit View Project Build Debug Database Cube Toots Window Help > Development - ^ ^ ^* fi 3 ■ ^ Ц CubeSfructire i У| DrnereonUsage i' j Cakdations — KPIs yj Actors -$ PytiMns |)1 Aggregators J-^J ■ У V _ TimZlm^Desig. 6^ inalyoi: Servites ProjattS - Miaoxsft Visual Studio iMministrator) I, □ i Й W£S цигегйг jju/ Fig.5. OLAP cube developed for representation of contracts signed with foreign countries based on the two dimensions “Date” and “Country”. T ic t : . :: a caterer ao: дсяЫяглю; SCdantoi 200: acSmtrJIIIM 5 Cafeuda 2005 g Quarts-1, 3006 count tiQuarte- 2,2006 Count E Quarte- 3,2006 Count м Qtarf 4,2006 Count Я calendar an дСаЫаг2012 gCahvkrHlB t)Caferriar2314 Three countries are selected to demonstrate the calculation of integration degree of the countries and its dynamics, which the institute cooperates with more closely: Russia, Turkey and Germany. Figures 6 and 7 provide a representation of slices of OLAP cubes of official foreign trips and contracts signed with these countries on the two dimensions “Date” and “Country”. Fig.6. OLAP cube for representation of contracts signed with Russia, Turkey and Germany, based on the two dimensions “Date” and “Country”. Fig.7. OLAP cube for representation of official foreign trips to Russia, Turkey and Germany, based on the two dimensions “Date” and “Country”. Table 3 presents the number of contacts and the number of contracts signed with the selected countries, the weight of these indicators over the years, calculated according to the formulas (2) and (3) for the contacts and contracts, respectively, as well as an integral indicator, calculated by the formula (1). All these calculations are implemented in an interactive mode. This table is constructed by the system automatically. Table 3. The values of the number of contacts and contracts signed with selected countries, their weight coefficients and integral indicators. Year Russia Germany Turkey contacts contracts о 5b contacts contracts 5b contacts contracts .S' s .S' s .S' s .S' s .S' s .S' s 2003 3 0.5 1 7 0.30 0.80 0 0 4 0.07 0.07 1 0.17 1 0.02 0.18 2004 7 1 1 2 0.18 1.18 0 0 1 0.02 0.02 0 0 0 0 0 2005 2 0.67 6 0.12 0.79 0 0 5 0.1 0.1 1 0.33 0 0 0.33 2006 4 0.8 8 0.24 1.04 0 0 1 0.03 0.03 0 0 1 0.03 0.03 2007 2 0.5 3 0.10 0.60 0 0 2 0.07 0.07 0 0 0 0 0 2008 0 0 2 0.07 0.07 0 0 2 0.07 0.07 0 0 0 0 0 2009 2 0.33 4 0.19 0.52 0 0 0 0 0 0 0 0 0 0 2010 1 0.14 4 0.13 0.27 1 0.14 0 0 0.14 0 0 1 0.03 0.03 2011 1 0.07 1 0.08 0.15 1 0.07 0 0 0.07 2 0.13 0 0 0.13 2012 0 0 1 0.08 0.08 4 0.24 0 0 0.24 4 0.24 0 0 0.24 2013 1 0.06 4 0.4 0.46 0 0 0 0 0 2 0.11 1 0.1 0.21 2014 0 0.00 0 0.0 0 2 0.13 1 1.0 1.13 5 0.33 0 0 0.33 The advantage of this DSS is that it automatically provides visual representation of the integration degree of countries as a linear diagram, through which we can see the latest trends. DSS provides the visualization of the dynamics of change in the integration degree of the countries. Fig. 8 shows the corresponding diagram for Russia, Germany and Turkey in the period from 2003 to 2014 on the basis of this data. As it is seen from the diagram, the indicators of integration by 2014 (based on the data from IIT of ANAS) of Russia into Azerbaijan decreased, and that of Germany and Turkey increased. Note that, the developed system uses OLAP-server with 2 Gb RAM and 2.2 GHz in Microsoft Windows 7. Microsoft Analysis Services 2008 is used for OLAP analysis. Fig.8. Dynamics of change of integration of Russia, Germany and Turkey into Azerbaijan for the period 2003-2014. SQL server is used as a database. The implementation environment is Microsoft Visual Studio 2008, and T-SQL query language. The benefits of integration include its impact on the acceleration of the development of countries, the implementation of major innovative projects, the increase of budget revenues, the development of infrastructure, and so on. In addition, the integration processes between developing countries in terms of globalization is characterized by the factors such as deepening of international division of labor and internationalization of capital, increase of free trade, globalization of technological progress, etc. Integration also promotes creation of associations in various parts of the world, which can then be transformed into economic, political and military alliances that are of global importance. The indicators that define the degree of integration of countries are of great significance for studying these processes, their analysis, forecasting, and identification of further development trends. The paper presents the method for determination of the integration degree of one country into another. The method can also be applied to define the integration degree in separate fields of activity. In addition, if we apply this method to determine the integration degree of a country into a group of countries belonging to an international organization, the integration degree of the country to this international organization will be obtained. The diagram, which shows the dynamics of change in the integration degree, enables determination of the priority trends in the international integration of a country.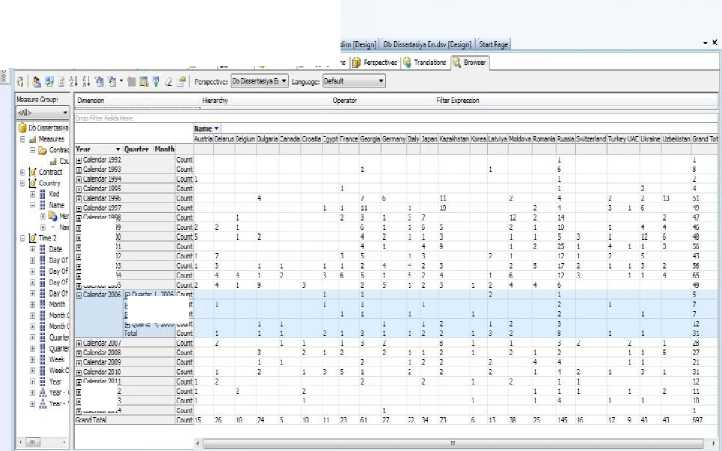
V. Conclusion
References The Method of Measuring the Integration Degree of Countries on the Basis of International Relations
- Great Russian Encyclopedia. M.: Great Russian Encyclopedia. 2003.
- Zh.B. Chernova, “Analysis of scientific approaches to the economic nature of a cluster”, Online journal “Science of science”, vol.25, no.6, 2014, (in Russian).
- E. Starkov, “Decision support system in medicine. Bulletin of new medical technologies”, vol.13, no.2, 2006, pp. 23-24 (in Russian).
- A. Borodkin, et al. Decision support systems in education. http://www.rae.ru/forum2011/pdf/article275.pdf (citation date: February 2015) (in Russian).
- N. Pavlov, Decision support system for product management problem solution. http://www.uecs.ru/uecs-28-282011/item/400-2011-04-25-08-42-16 (citation date: December 2014) (in Russian).
- G. Youhai, et al. “Study on the earthquake disaster reduction information management system and its application”. International Journal of Intelligent Systems and Applications, vol.3, no.1, 2011, pp.51-57.
- A. Chelyadinsky, “The concept of integration in international relations: theoretical aspect”, Journal of International Law and International Relations, no.1, 2009, pp.29-32 (in Russian).
- Popovich, A. Integration: Theoretical aspects. Online resource URL: http: //fmp-gugn.narod.ru/pop2.html (citation data: June 2014) (in Russian).
- A. Etzioni, From empire to community: a new approach to international relations. Translated by Inozemtsev V. Publishing house: Ladomir, ISBN 5-86218-460-0; 2004 (in Russian).
- W. Inmon, Building the Data Warehouse, W.H. Inmon. Wiley, 2005.543 pp.
- E.F. Codd, S.B. Codd, S.T. Salley, “Providing OLAP (Online Analytical Processing) to user-analysts: an IT mandate / San Jose: Codd & Date, Inc., 1993, 31 pp.
- W. Inmon, Data warehousing for government. http://www.b-eye-network.com/view/522
- G. Nabibayova, “Development of data warehouse architecture in the informational analytical systems of decision-making support in the field of foreign policy”, International Journal of Ubiquitous Computing and Internationalization, vol.3, no.2, 2011, pp. 15-18.
- Data Mart Concepts. Online resource URL: http://docs.oracle.com/html/E10312_01/dm_concepts.htm (citation date: December 2014).
- I.Y. Kashirin, S.Y. Semchenkov, Online analytical processing of data in modern OLAP systems. Business Informatics, vol. 8, no.2, 2009, pp.12-19 (in Russian).
- K. Ruohonen Graph theory. Online resource URL: http://math.tut.fi/~ruohonen/GT_English.pdf (citation date: December 2014).
