Theoretical principles of cardiometry

Author: Rudenko Mikhail, Voronova Olga, Zernov Vladimir, Mamberger Konstantine, Makedonsky Dmitry, Rudenko Sergey
Journal: Cardiometry @cardiometry
Section: Theory of cardiovascular system performance. Cardiometry basics
Article in issue: 1, 2012.
Free access
Aims The article aims at describing the theoretical principles of cardiometry as a fundamentally new scientific field which enables the accurate measurement of the cardiovascular system parameters. Materials and Cardiometry is based on the mathematical model of hemodynamic methods processes. The model is described by G. Poyedintsev and O. Voronova equations. The variable values in these equations are the cardiac cycle phase durations recorded on the ECG. An original ECG lead of the ascending aorta reflects all the processes of the heart performance. Thus, it is possible to calculate the phase blood volumes. This method is an accurate indirect measurement method. The synchronous recording of the ascending aorta ECG and Rheogram enables monitoring of the compensation mechanism responsible for the normal hemodynamic performance. Results An innovative mathematical model of hemodynamics providing the creation of an innovative indirect method for measurement of the cardiovascular system parameters was developed. Conclusion The innovative method of cardiovascular system diagnostics enables to measure 7 main hemodynamic parameters using noninvasive technology for qualitative evaluation of 12 functions of cardiovascular system performance and general assessment of coronary flow status.
Сardiometry, cardiology, hemodynamics, ecg, rheogram, g. poyedintsev - o. voronova equations
Short address: https://sciup.org/148308727
IDR: 148308727
Text of the scientific article Theoretical principles of cardiometry
Aims The article aims at describing the theoretical principles of cardiometry as a fundamentally new scientific field which enables the accurate measurement of the cardiovascular system parameters. Materials and methods Cardiometry is based on the mathematical model of hemodynamic processes. The model is described by G. Poyedintsev and O. Voronova equations. The variable values in these equations are the cardiac cycle phase durations recorded on the ECG. An original ECG lead of the ascending aorta reflects all the processes of the heart performance. Thus, it is possible to calculate the phase blood volumes. This method is an accurate indirect measurement method. The synchronous recording of the ascending aorta ECG and Rheogram enables monitoring of the compensation mechanism responsible for the normal hemodynamic performance. Results An innovative mathematical model of hemodynamics providing the creation of an innovative indirect method for measurement of the cardiovascular system parameters was developed. Conclusion The innovative method of cardiovascular system diagnostics enables to measure 7 main hemodynamic parameters using noninvasive technology for qualitative evaluation of 12 functions of cardiovascular system performance and general assessment of coronary flow status. Keywords Сardiometry ≈ Cardiology ≈ Hemodynamics ≈ ECG ≈ Rheogram ≈ G. Poyedintsev - O. Voronova equations Imprint Mikhail Y. Rudenko, Olga K. Voronova, Vladimir A. Zernov, Konstantine K. Mamberger, Dmitry F. Makedonsky, Sergey M. Rudenko. Theoretical principles of cardiometry; Cardiometry; No.1; November 2012; p.7-23; doi:10.12710/cardiometry.2012.1.723 Available from:
There are two types of fluid flow conditions described in the classical fluid mechanics: the first type is the laminar flow, and the second one is the turbulent flow mode [1]. The conventional interpretation of blood circulation is that blood flows through blood vessels under laminar flow conditions to which Poiseuille's law is applicable [2]. But it is a matter of fact that this conventional interpretation concept is inadequate because it is not in compliance with the “principle of optimization” in biology, according to which all processes in biosystems show their best performance, i.e., their highest efficiency [3]. It is just the compliance with this principle that is the major criterion to be used for evaluation of adequacy of any theoretical models describing various systems in a living body and their interactions both with each other and their external environment.
In the course of aero- and hydrodynamic research, physicists discovered and learnt to model the phenomenon of substantial increase of fluid flow rate in rigid pipes under conditions of the pulsating flow. However, no adequate theoretical explanation or description of this phenomenon was offered. Despite this fact, the effects of the phenomenon under investigation were practically applied for designing aircraft engines. Thus, in 1941 V-1 rocket was equipped with a fundamentally novel high-thrust engine known as “pulse engine” [4]. Unlike the modern turbo jet engines, it had no rotating parts. Later the Boeing company updated the technology of “pulse engine” and now intends to use it for vertical take-off aircrafts [4].
This effect also found application in medical science. Thus, the so called “hydro pulsators” are used for restorative cardio surgery. These are turbine driven blood pumps which are implanted into the human body. Thus, the pulsatile blood flow in aorta is restored [5]. The hydraulic pulsators at the outlet transform the blood flow so that its structure is similar to the air flow in the pulse jet engines.
However, despite the successful practical applications none of the researchers succeeded in creating a mathematical model of the blood flow.
Significant progress is made after G. Poedintsev and O. Voronova discovered the mode of elevated fluidity, or the “third” mode of fluid flow characterized by a specific flow structure and showing lesser energy losses to overcome friction [6].
It has been proved that the blood flow through the blood vessels is provided in “the third” flow mode that is the most efficient and therefore fully in compliance with the principle of optimization in biology.
The theory of the third mode is a foundation for the development of new mathematical models describing the performance of the blood circulatory system. In addition, new methods of quantitative determination of a number of hemodynamic parameters and qualitative evaluation of the processes occurring in the system have been elaborated. The application of these methods in practice allows filling a lot of gaps in theoretical cardiology and creates at the same time a system of analysis and evaluation of the functions of the cardiovascular system.
Materials and methods
Special features of hemodynamics and its regulation
It has been established by the authors that there are certain processes taking place in the rigid pipes at the moment of the liquid motion initiation from a quiescent state. At the time when the fluid elements start motion under static pressure difference, the concentric friction waves are generated in the boundary layer. The waves are propagated towards the axis of the pipe [6] (Fig.1). The amplitude of the waves depends on the pipe diameter, acoustic velocity in fluid and the initial pressure difference at the pipe ends. The wavelength of the traveling waves is constantly increasing. The waves converge towards the axis of the pipe and decay, only a single wall wave with parabolic profile remains. This process is the laminar flow mode (Fig.2).
It should be noted that it is just within this short period of time, i.e., starting from the moment of the motion initiation from a quiescent state till the moment of formation of the laminar flow (items t5 and t6 in Fig. 2 herein), the liquid flows in its optimum mode of elevated fluidity, considering it from the point of view of energy consumption (items t1, t2, t3, t4 in Fig 2 herein). The energy consumption under the laminar flow conditions to transport liquid in the pipe is significantly higher due to increase in the flow resistance.
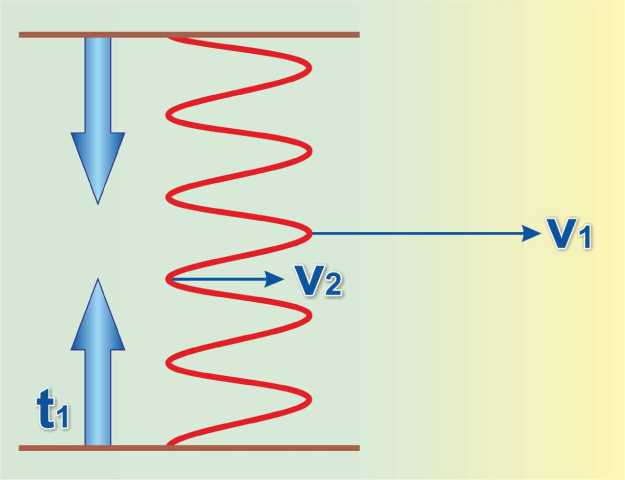
Figure 1 . Formation of concentric friction waves at the time of initiation of fluid flow in a pipe (according to G. Poyedintsev and O.Voronova). t1 - moment of pressure difference formation in the pipe;
V1 – velocity of blood particles in high-velocity blood layers;
V2 – velocity of plasma in slow-velocity layers.
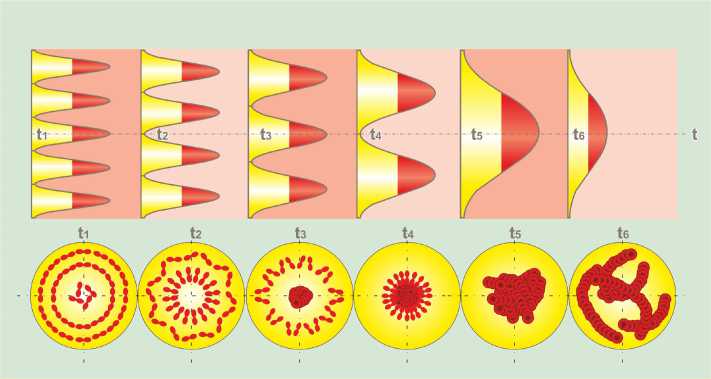
Figure 2. Formation of two-phase pattern at the initiation of the flow from a quiescent state (according to G. Poyedintsev and O. Voronova), items t1, t2, t3, t4 correspond to the elevated fluidity mode of the blood flow in cardiovascular system. The pattern of the blood flow in the elevated fluidity mode represents alterating ring layers of plasma and erythrocytes. The ring plasma layers reduce friction while blood is flowing through the vessels.
There is another phenomenon typical for the “third” flow mode. If liquid contains suspended particles similar to those in blood, during the development of the above mentioned wave process the particles are concentrated at the wave maxima, and the particle-free liquid is delivered to their minima, correspondingly. When the fluid, patterned in such a way, flows along the pipe axis, the velocity of the concentric particle layers is twice what the fluid pattern-free layers reach. Vectors of velocity are parallel to the axis of the flow. And it is just a prerequisite to elevated fluidity of liquid with reduced friction between the liquid layers and the pipe wall. Figure 2 herein shows the locations of erythrocytes in the blood flow referring to each flow formation stage as mentioned above. At the beginning of the formation of the “third” flow mode, the ringshaped alternating layers of the blood elements and plasma are available, while in the laminar mode all elements are accumulated in the center of the flow. In this case they are located very close to each other forming a thick mass. This process may result in an aggregation of erythrocytes and hemolysis. In order to avoid such pathological consequences, it is a must to manage the blood transportation in the “third” mode of flow, avoiding its transformation into a laminar one.
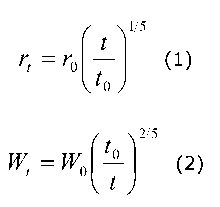
The theory gives a clue: it can be obtained when transporting liquid in a pulsating mode through an elastic pipe. According to this theory, the pipe clear width and the liquid flow velocity should be changed with every impulse under certain laws. The laws of increasing in the pipe clear width and decreasing in the flow velocity with every impulse take the form as follows.
(t у 15
r t = r0
V t 0 7
W w 0 1 t 0
where:
-
r t - current radius of the pipe increasing;
-
r 0 - initial radius (at t = t 0 );
-
t - current time (t ≥ t 0 );
-
t 0 - time of acceleration of flow velocity up to maximum velocity in an impulse;
W t – current value of liquid flow velocity;
W 0 – maximum value of velocity in an impulse (at t = t 0 ).
It is proved by the authors of this theory that the above conditions are met in the blood circulation system.
This is provided by changing in the clear width of blood vessels in every cardiac cycle and arterial pressure pulsating. There are 10 phases in every heart cycle. The phase structure of the arterial pressure pulse wave and the corresponding phases on the ECG are given in Fig.3
The phase structure of the cardiac cycle on the ECG includes the following periods:
Phase of atrial systole P н – P к ;
Phase of closing of atrioventricular valve P к – Q;
Phase of contraction of interventricular septum Q – R;
Phase of contraction of ventricle walls R – S;
Phase of myocardial tension S – L;
Phase of rapid ejection L – j;
Phase of slow ejection j - T н ;
Phase of buildup of maximum systolic pressure in aorta T н - T к ;
Phase of closing of aortic valve T к - U н ;
Phase of early diastole of ventricles U н - P н .
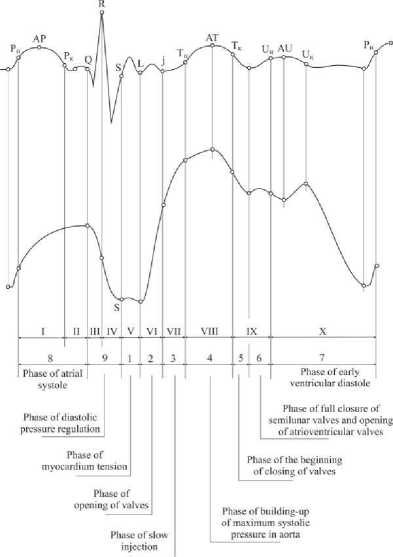
Figure 3. Phase structure of the ECG and arterial pressure pulse wave determining the mode of blood flow in the cardiovascular system.
The cardiac cycle phases can be conventionally grouped according to the processes occurring therein, namely:
-
* Diastolic phases responsible for blood supply to the ventricles :
Phase of early diastole of ventricles U н - P н , (sec);
Phase of atrial systole P н – P к , (sec);
Phase of closing of atrioventricular valve P к – Q, (sec).
The phase of early diastole of ventricles contains a period of time equal to the duration of wave U which reflects an intensive filling of the coronary vessels with blood. It occurs in synchronism with filling of the ventricles.
Functioning of the cardiovascular system during diastole phase is characterized by the following hemodynamic parameters:
PV1 – volume of blood entering the ventricle during early diastole (ml);
PV2 – volume of blood entering the ventricle during atrial systole (ml).
-
* * Systolic phases providing blood ejection from the ventricles. They can be conventionally classified into three subgroups:
-
- Phases regulating diastolic arterial pressure:
Phase of contraction of interventricular septum Q – R, (sec);
Phase of contraction of ventricle walls R – S, (sec);
Phase of myocardial tension S – L (partially), (sec).
-
- Phases regulating systolic arterial pressure:
Phase of myocardial tension S – L, (sec);
Phase of rapid ejection L – j, (sec).
-
- Phases regulating the pumping function of aorta:
Phase of slow ejection j - T н , (sec);
Phase of buildup of maximum systolic pressure in aorta T н - T к, , (sec);
Phase of closing of aortic valve T к - U н , (sec) .
Functioning of cardiovascular system during systolic phase is characterized by the following hemodynamic parameters:
SV – stroke volume, (ml);
MV – cardiac output, (liters/minute);
PV3 – blood volume ejected from the ventricle during the phase of rapid ejection, (ml);
PV4 – blood volume ejected from the heart ventricle during the phase of slow ejection, (ml);
PV5 – blood volume pumped by the ascending aorta operating as a peristaltic pump during the systolic phase, (ml).
It should be noted that phase of slow ejection j - T н is a time when the stroke volume of blood is distributed throughout the ascending aorta, i.e., the time of the aorta expansion. As our investigations demonstrate, in case of improper elasticity of the aorta this period of time is prolonged.
As illustrated by Figure 3, the arterial pressure is not increasing during the myocardial tension phase S – L. Aorta valve opens at the moment L. The slope of the Rheogram during the phase of rapid ejection L-j characterizes the blood flow velocity and the systolic arterial pressure.
Mathematical equations used for calculating blood volumes. Individual normal values of hemodynamic parameters
The relationships described by the equations (1) and (2) are the main initial conditions for creating the mathematical model of blood flow and developing the indirect method for determining volumetric hemodynamic parameters in terms of durations of the cardiac cycle phases. The functional dependency between stroke volume SV and durations of the cardiac cycle phases is as follows [6]:
SV = f (a, g, Sа, QRS, RS, Em, Er), (ml) (3) where: a – acoustic velocity in blood, (m/sec);
g – acceleration of gravity, (m/sec2);
Sа – the area of the clear width of the ascending aorta (cm2);
QRS, RS – durations of the ECG waves, (sec);
Em – duration of the phase of rapid ejection of blood from the ventricle, (sec);
Er – duration of the phase of slow ejection of blood from the ventricle, (sec).
The final formulae for calculation of the cardiac output (MV), stroke volume (SV), and systolic phase volumes PV3 and PV4 are as follows:
PV3 = Sа · (QR+RS)2· f 1 (α) · [f 2 (α) + f 3 (α, β, γ, δ)]; (ml) (4)
PV4 = Sа · (QR + RS)2 · f 1 (α) · f 4 (α, β, γ, δ); (ml) (5)
SV = PV3+ PV4; (ml) (6)
МV = SV· HR/1000 (l/min) (7)
8 3
1 8
f 4 ( a, в, Y, 5 )= [5( 3 - -«XP — a ) + 7,5 y3p - a ) + 3 y ( P - a )];
|
8 |
3 Em
QR + RS Y = 2( a - 1) . γ β - α |
-
3 = a (2 + y ) ;
HR – heart rate, BPM.
Other phase volumes are calculated in a similar manner.
Thus, the proposed method allows determining the main hemodynamic parameters, namely seven blood volumes ejected by the heart and entering it during different cardiac cycle phases. They are stroke volume SV, cardiac output MV, two diastolic phase-related volumes PV1 and PV2, two systolic phase-related volumes PV3 and PV4, and PV5 as a volume of blood pumped by the aorta.
The authors of this theory in their researches utilize relative phase volumes denoted by RV. Each relative phase volume is that expressed as a percentage of stroke volume SV. These relative parameters demonstrate contributions of each phase process to the formation of the stroke volume in general.
For effective application of the proposed method into practice, diagnostic criteria of various pathological states should be developed. To achieve that, it is critically important to evaluate the eventual deviations of the calculated hemodynamic parameters from the normal values.
The limits of the normal values of hemodynamic parameters are obtained by means of calculation.
With respect to the normal values (the required parameters) in hemodynamics, they have been taken on the basis of the known data on ECG waves, intervals and segments for adults from the literature sources as given below:
-
1. The upper and lower limit of the QRS complex value:
-
2. The upper and lower limit of the RS complex value:
-
3. The normal value of the QT interval in every specific cardiac cycle is determined from the Bazett formula as follows:
-
4. The normal value PQ сег. is calculated from a formula as indicated below:
QRS max = 0.1 sec ; QRS min = 0.08, sec.
RS max = 0.05 sec; RS min = 0.035 sec.
QT = 0.37 ≈ RR0.5 , (seconds for men) (8)
QT = 0.4 ≈ RR0.5 , (seconds for women) (9)
PQ сег. = 1 / (10-6 638.44 ≈ HR2 + 9.0787), (sec) (10)
This equation was obtained according to the method of approximation of the normal values PQ сег . , as known from the sources, considering their dependence on heart rate (HR).
These values are used as initial values for calculations of individual range of normal values of volumetric hemodynamic parameters considering individual patient cases.
Capabilities of the method for indirect measurement of hemodynamic parameters
Despite the complex theoretical background, the new indirect method for determining phase volumetric hemodynamic parameters is easily applied into practice. It is based on the mathematical model developed by G. Poyedintsev and O. Voronova describing blood flow mode in the vessels. The method contains a number of equations for calculating hemodynamic parameters. The initial data used for the calculations are limited to durations of the heart cycle phases measured on the ECG. The ECG and Rheogram are recorded simultaneously using the same detectors, thus giving a comprehensive idea of how the cardiovascular system performs [6].
The method enables not only obtaining numeric values of the phase volumetric parameters of hemodynamics, but also evaluating the functional, structural and hemodynamic changes in different parts of cardiovascular system.
Investigation of hemodynamics basing on the given equations allowed defining conventionally normal shape of the ECG and Rheogram, as illustrated by Fig. 4. These were adopted by the developers as reference curves.
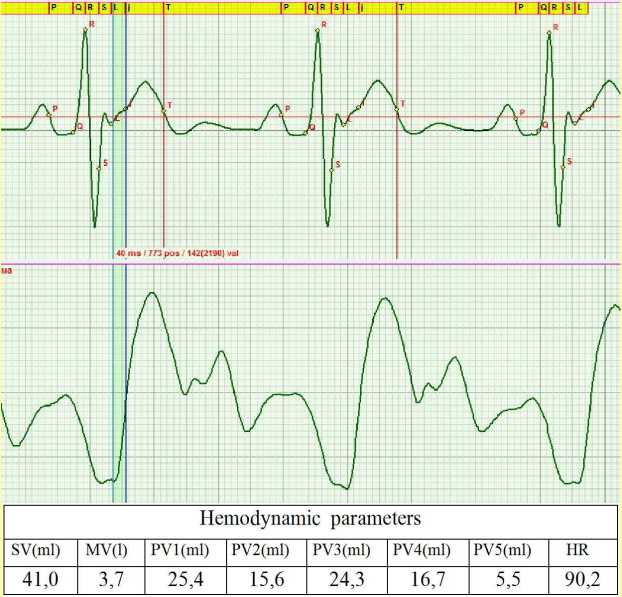
Figure 4. Reference curves of the ECG and Rheogram shape. The table contains the calculated values of main hemodynamic parameters corresponding to the reference curve.
The possibility of obtaining a wide range of quantitative and qualitative values of the major hemodynamic parameters characterizing the performance of cardiovascular system allows using the proposed method for verification of effectiveness of the selected tactics of the patient treatment.
Let us consider the results of the study of the therapeutic treatment effects upon the recovery process of myocardium contraction function of the patient. In this case, the change of the ECG shape is caused by mitochondrial cardiomyopathy [7]. This pathology is associated with decrease in energy supply for muscle contraction due to reduced ATP production by mitochondria caused by hypoxia. The pathology is fairly widespread, especially among the elderly patients.
The change of the ECG shape and the values of phase blood volumes in the course of treatment is given in Fig.5. As the contraction function of myocardium recovers, the shape of the ECG evolves from the pathological shape corresponding to Brugard syndrome (Fig. 5а) at the beginning of treatment to practically normal shape observed in the last test (Fig. 5e).
There is a clearly visible correlation between the recovery of the ECG shape and changes of hemodynamic parameters, in particular, of the cardiac output (MV). At the beginning of the study, we had MV=9.83 l/min, whereas at the end it amounted to MV=7.35 l/min, the conventional normal value being MV=3.7 l/min.
The ratio of diastolic phase volumes PV1/PV2, proved to be an informative parameter. In the course of myocardium recovery, blood volumes redistribute between the early diastole and systole of atrium. More specifically, at the beginning it was equal to 1.56, whereas at the end it was 1.88, which is indicative of increased intensity of atria functioning. Meanwhile, the ratio of systolic phase volumes PV3/PV4, remains practically unchanged at the level of 1.46. The pumping function of aorta is changing. The load on the aorta is decreasing, and the blood volume PV5 decreases from 16.53 ml to 15.95 ml. The stroke volume SV also changes from 153.56 ml to 131.17 ml.
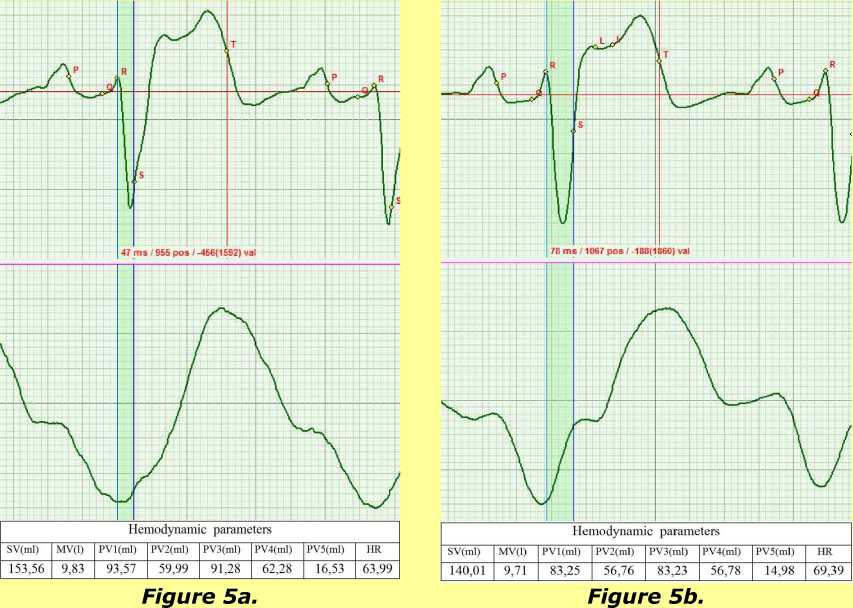
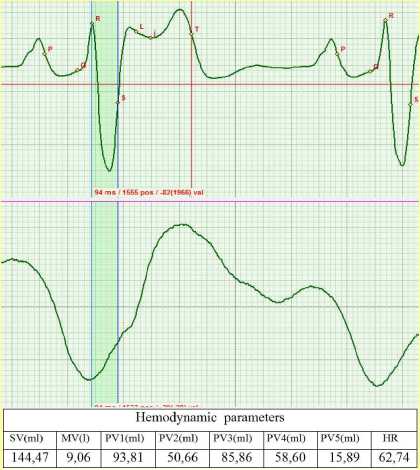
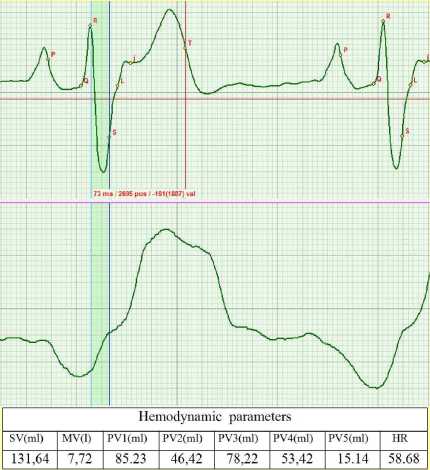
Figure 5d.
Figure 5c.
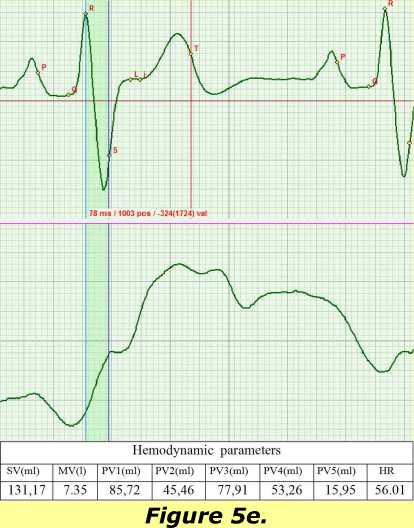
On figures 5: change of the ECG shape and Rheogram shape in the course of recovery of normal mitochondrial function in the myocardium cells resulting from the treatment. The tables present the calculated values of the main hemodynamic parameters.
Although the treatment of the patient is not complete yet, the obtained data provide a comprehensive view of the dynamics of the recovery process of the myocardial contractility and allow evaluating the adequacy of the selected treatment.
Results
A comparative study of the developed method, the thermodilution method and Fick method was undertaken. Their correlation coefficients were approximately equal and reached 0,7. The developed method is an indirect method of measurement that is its significant advantage. It measures 7 blood volumes compared to method of thermodilution and Fick method which measure only minute blood volume. Besides, the other methods are invasive and require special clinical settings and are time-intensive.
Discussion and conclusions
It is not possible to describe within a single paper how promising the discovery of the phenomenon of the elevated blood fluidity proved to be. Let us summarize some of the conclusions.
Firstly, a fundamentally new method for indirect measurement of major hemodynamic parameters was developed on the basis of this theory.
Secondly, the research revealed that phase-volume hemodynamic parameters are the most informative characteristics of the cardiovascular system performance, since they reflect functioning of the heart and the vessels. Knowing the relations of these parameters and having associated this information with anatomic and functional state of the heart and blood vessels in each phase, one can diagnose the state of the cardiovascular system, identify the existing pathologies and establish cause-and-effect relationships in the pathological processes.
Thirdly, clinical application of the method allows stating that it can be successfully used for evaluating and monitoring the efficacy of the specific patient treatment.
Besides, the accomplished studies using the mathematical model of blood flow allowed precisely identifying the structure of the S-T interval on the ECG. This was the so called “Terra incognita” in cardiology, since there failed to exist a unanimous opinion on how to identify the beginning of the rapid ejection phase (point S) on the ECG. The phase of slow ejection was not properly described before. The proposed model provides a full description of hemodynamic processes in each of the four phases. This enabled establishing the criteria for the boundaries of all four phases in the S-T interval.
Finally, it was found that the duration of the j-T interval can serve as a criterion for evaluating the elastic properties of the ascending aorta. During this period, the stroke volume redistributes within the ascending aorta. The duration of the j-T interval will change depending on the velocity of aorta expansion influenced by the blood volume pressure. Thus, reduction in aorta elasticity will cause the j-T interval to increase.
The described above theory of the elevated blood fluidity can contribute to development of the existing methods of cardiovascular system evaluation. We suppose that the fractal theory can contribute to the understanding of the relationship of the phase processes and the functions of cardiovascular system regulation.
The theory of cardiac cycle phase analysis can be used in cardiac surgery with respect to diagnostics of the implantable devices. With advances in technologies, this problem proves to be important [9].
One of the ways of further development of the method is the comparison of cardiovascular system phase functions and geometric shape of myocardium [10]. This will enable providing accurate noninvasive diagnostics of coronary flow.
The above new hemodynamic model provides a wide range of new possibilities for investigation of cardiovascular system. It gives a clue to understanding the biophysical processes taking place in the cardiac cycle phases and enables defining the location of pathological processes.
A new approach to electrocardiography interpretation is provided in the article. Further development of the theory of the cardiac cycle phase analysis can lead to creation of a fundamentally new theory of rheography. Since rheography reflects blood filling of the vessels and the U-wave of the ECG corresponds to the phase of filling of coronary arteries, a new method of diagnostics of coronary blood flow can be developed.
The authors are confident that the discovery of the phenomenon of elevated blood fluidity which allowed developing a simple diagnostic method will not only stimulate new scientific discoveries. It will also enable solving an important social problem of reducing the death-rate caused by cardiovascular diseases.
The described above diagnostic method based on the hemodynamic models can be characterized as a multiparametric method of the diagnostics of phase hemodynamics. It can be used to diagnose not only the seven main phase volumes of blood, but also the functions of individual segments of cardiovascular system and their interrelation in case of different pathologies [11].
Statement on ethical issues
Research involving people and/or animals is in full compliance with current national and international ethical standards.
Conflict of interest
None declared.
Acknowledgements
The article commemorates Gustav M. Poyedintsev, who was the first scientist to give a mathematical description of the elevated fluidity mode.
Author contributions
M.Y.R., O.K.V. and V.A.Z. developed the concept and prepared the manuscript. K.K.M., D.F.M. analyzed the data, S.M.R coordinated and helped to draft the manuscript, V.A.Z. read and met the ICMJE criteria for authorship. All authors read and approved the final manuscript.
References Theoretical principles of cardiometry
- Caro C., Padley T., Shroter R. & Sid W. Blood Circulation Mechanics. Mir. M.,1981, 624 pages.
- Rosen P. The Principle of Optimization in Biology. Mir. М., 1969.
- Boeing will take off vertically. http://rnd.cnews.ru/tech/news/top/index_science.shtml?2011/07/28/4489995.
- No pulse heart prolonged dying man life. http://www.membrana.ru/particle/16296?utm_source=feedburner http://www.npr.org/2011/06/13/137029208/heart-with-no-beat-offers-hope-of-new-lease-on-life
- Rudenko M., Voronova O. & Zernov V. Theoretical Principles of Heart Cycle Phase Analysis. Fouqué Literaturverlag. ISBN 978-3-937909-57-8, Frankfurt a/M. München -London -New York; 2009.
- Shlichting G. Theory of Boundary Layer. M., IL, 1956: 57.
- Vasilenko V. Kh., Feldman S. B., Khotrov N.N. Miocardyodistrophia. Medicine, Moscow. 1989, 272 pages.
- Goran Krstacic, Antonija Krstacic, Anton Smalcelj, Davor Milicic and Mirjana Jembrek-Gostovic. The Chaos Theory and Nonlinear Dynamics in Heart Rate Variability Analysis: Does it Work in Short-Time Series in Patients with Coronary Heart Disease? Annals of Noninvasive Electrocardiology, April 2007. Issue 2. Volume 12: 130-136.
- Joep Thijssen, C. Jan Willem Borleffs, Johannes B. van Rees, Mihály K. de Bie, Enno T. van der Velde, Lieselot van Erven, Jeroen J. Bax, Suzanne C. Cannegieter, and Martin J. Schalij. Driving restrictions after implantable cardioverter defibrillator implantation: an evidence-based approach. Eur Heart J., 2011 November; 32(21): 2678-2687. Published online 2011 June 5. 10.1093/eurheartj/ehr161
- Jadranka Šeparović-Hanževački. Deformation imaging (strain and strain-rate imaging). Kardiolist, April 2012; 7 (3-4):111.
- Innovation in cardiology. A new diagnostic standard establishing criteria of quantitative & qualitative evaluation of main parameters of the cardiac & cardiovascular system according to ECG and Rheo based on cardiac cycle phase analysis. (npre.2009.3667.1). Nature Precedings. http://precedings.nature.com/documents/3667/version/1
