
Trust-aware Secure Routing and Intrusion Detection in MANETs Using Dilated Convolutional Multi-Relational Graph Attention Network
Journal: International Journal of Computer Network and Information Security @ijcnis
Article in issue: 4 vol.18, 2026.
Free access
Mobile Ad hoc Networks (MANETs) are a rapidly developing technology, making their security a major concern. In order to enable trust-aware and attack-resilient routing, the goal of this research is to develop an intrusion detection system (S-IDS) based on deep learning (DL). By leveraging trust values of the nodes using Osprey Optimization Algorithm (OOA), the presented Dilated Convolutional Multi-Relational Graph Attention Network (DConMRG-Net) based Intrusion Detection System (IDS) identifies potential intruders, ensuring that the paths generated within the MANET are reliable and resilient. Additionally, a novel optimization algorithm namely, Hybrid Adaptive Genghis Khan Shark Gold Rush Optimization (HAGKS-GRO) Algorithm is introduced by combining the Adaptive Genghis Khan Shark Optimization (AGKSO) Algorithm with Gold Rush Optimization (GRO) Algorithm for optimal path selection. Two situations are examined: one in which there is no attack and the other in which there is an attack. Relevant performance metrics are evaluated in connection with these scenarios, including throughput, packet delivery ratio, attack identification rate, accuracy, error rate and computation time. Evaluation results demonstrate significant improvements, with a maximum detection rate of 99% with a minimum computational time of 55ms for with attack case and 51ms for without attack case. The proposed model surpasses the state-of-the-art attack detection techniques and achieves high efficiency, according to the simulation results.
Short address: https://sciup.org/15020535
IDS: 15020535 | DOI: 10.5815/ijcnis.2026.04.01
Text of the scientific article Trust-aware Secure Routing and Intrusion Detection in MANETs Using Dilated Convolutional Multi-Relational Graph Attention Network
A collection of wirelessly connected nodes arranged autonomously is called a MANET. By transmitting data from a source node to a target node, each node acts as a router in this situation [1]. Remote ad hoc networks are frequently utilized, sizable networks. The mobile network is managed independently by each mobile node, rather than by a central
This work is open access and licensed under the Creative Commons CC BY 4.0 License.
node. Anywhere they choose is where the nodes of mobile devices can go. The network enables nodes to enter and exit rapidly [2]. Nodes are not restricted in their ability to communicate with one another. Forming the association when the network's nodes are out of radio range may cause data loss [3].
MANETs are self-organizing, quickly deployable wireless communication systems that are excellent for communications in locations lacking radio infrastructure, outdoor events, disaster assistance, and military activities [4]. Due to the versatility and dynamic nature of network architectures, they are vulnerable to breaches that utilize eavesdropping, routing, and application modifications, resulting in weak network security [5]. The two primary types of MANET assaults are active and passive. The TCP/IP network layers and data link layers are the main areas where passive attacks happen. By importing packet knowledge acquired from the network's available nodes, such assaults have no effect on how the network functions. Typically, the information being transmitted is shared by the attackers. When compared to active attacks, the network disruptions brought about by these attacks are less severe [6].
Furthermore, the growing number of security holes in MANET may jeopardize the Quality of service (QoS) issues. Therefore, intrusion detection is recommended, which enables the system to identify and address further security vulnerabilities [7]. It is essential to be vigilant for breaches in order to prevent and provide additional security against unauthorized access [8]. Developing an S-IDS on wireless networks while maintaining network security remains a challenge [9].
MANETs don't have a stationary topology because of their significant node mobility, route loss, and interference. Therefore, a protocol for dynamic routing is necessary for them to operate properly [10]. Numerous IDS that rely on routing protocols have been implemented by MANET. These systems operate under the assumption that no node will break the protocol's requirements for effective network operation and that nodes will be unable to defend themselves against attacks by malevolent or self-serving nodes [11].
To ensure that these networks are secure for successful data transfer between nodes, secure routing methods involve identifying route pathways within networks and providing trust policies or secret keys to nodes [12]. Dealing with attacks and counterattacks to stop them from accessing the network is another aspect of MANET security concerns [13]. Implementing S-IDS addresses concerns about establishing trusted communication channels for data transfer while minimizing node energy consumption, is one way to handle security challenges in MANETs. Establishing security plans that can withstand malicious and self-serving assaults on the network's nodes is another [14]. Node attacks on the networks can happen easily with MANETs because there are no infrastructures, which puts the S-IDS design requirement at risk. High efficiency of S-IDS can only be achieved when all network nodes cooperate in data transmission and the algorithm prevents attacks by malicious nodes [15]. Therefore, a novel S-IDS framework for MANET is created using the paradigms of optimal path selection and trust evaluation. The study's primary contributions are described as follows:
• A new intrusion detection and secure routing protocol for MANET is presented using a trust aware-Dilated Convolutional Multi-Relational Graph Attention Network (DConMRG-Net).
• The presented research work is processed in four major phases. They are: i) Trust computation of various mobile nodes ii) Intrusion detection based on DConMRG-Net iii) Generation of path and iv) Selection of optimal routing path using HAGKS-GRA Approach.
• During the first phase, OOA will be utilized to compute each node's trust value based on many trust criteria, including direct, indirect, current, and historic trust.
• DConMRG-Net will be used to detect intrusions after nodes' trust values have been successfully computed. Thus, by taking into account the trust characteristics, the suggested S-IDS model can assist in identifying the attackers breaking into the network.
• Then, a newly developed HAGKS-GRA is employed for selecting the best route for secure routing. Fitness criteria, including high trust value and least distance are used to pick the best routes.
• Network Simulator 3 is used to implement the proposed approach. The findings of the simulation indicate improved performance, showing throughput, an improved packet delivery ratio, and an enhanced assault detection rate with reduced computation time, error rate, and end-to-end delay in both attack and non-attack scenarios.
2. Related Works
This manuscript's remaining sections are organized as follows: Section 2 contains a few research studies that are pertinent to the proposed study being presented. In Section 3, the suggested methodology is briefly discussed and explained. Section 4 provides simulation results and commentary. In Section 5, the work that has been presented is finished with an examination of potential avenues for future research.
Some of the recent studies related to the proposed research work are described below:
Bushra, et al. in 2023 [16] outlined the application of ResNet 101-C Hybrid Seagull Optimized to precisely identify a variety of attacks. Although it requires more time and resources to process large amounts of data, the Hybrid Seagull Optimizer addresses the computational limitations of the ResNet101-C architecture. In large-scale data environments, performance metrics, including accuracy, precision, recall, and F1-score, are used to enhance the effectiveness of IDS. To ascertain the attack identification rate in the presented analysis, two different dataset types—CCIDS2017 and UNSW-NB15 can be utilized.
Gavel, et al. in 2022 [17] presented an Optimized Maximum Correlation based Feature Reduction (OMCFR) data network approach. Depending on the score given to each attribute independently, the suggested technique uses maximum correlation as a major element. OMCFR is used to extract the crucial features for effective detection. The selected criteria along with a multiclass classifier are used to grade the data as typical over invasive activities. The study presented uses a multiclass classifier technique based on Random Forest. A relevant database of wireless communication networks from the NSL-KDD family, AWID family (2015), and CICIDS2017 is used to evaluate the given IDS.
Biyyapu, et al. in 2024 [18] offered a way for spotting wireless network breaches using hybrid sampling. Block-level channel Various attacks are better able to differentiate between features when self-attention is used during classification. Lastly, the sine-cosine method and Levy flight are utilized in the improved reptile search algorithm (IRSA) to determine the optimal weight for the proposed model. By examining the entire search field, a better global search algorithm can avoid local minimal trapping; nonetheless, the Levy factor increases the search agents' susceptibility to deception. Training the model to learn binary and multiclass classification was done using the CIC-IDS 2017, UNSW-NB15, and WSN-DS datasets.
Bhavsar, et al. in 2024 [19] suggested that an attack identification system based on federated learning (FL-IDS) should be implemented to enhance the security of automotive systems. Devices only share model modifications via an aggregate server in the FL-IDS system's local learning approach, which preserves data privacy. The server subsequently generates an improved detection model. Additionally, the FL-IDS system contains a detection model (LR-IDS, PCC-CNN) that employs DL classifiers, such as logistic regression (LR) and convolution neural networks (CNN), as well as machine learning (ML) to mitigate assaults in transportation IoT scenarios. Real-time performance testing of the suggested IDS was conducted using the NSL-KDD and Car-Hacking datasets.
Balasaraswathi, et al. in 2022 [20] offered a cooperative learning-based IDS. Classification, feature selection, and data pre-processing are the three primary processes in the provided IDS architecture. The input data is gathered during the data pre-processing step and contains a number of redundant, high-dimensional databases as well as a number of irrelevant attributes. Cooperative and competitive (C2) search-enabled learning is used to pick features in the second step. The classification step generates an optimal IDS by classifying the given characteristics using the Bonferroni-based Hybrid k-nearest neighbor (B-HkNN) technique. The same common CICIDS2017 and ADFA-LD databases used to test the created system are also used to assess the overall accuracy and effectiveness of the IDS.
Jiang, et al. in 2024 [21] introduced a novel model for identifying attacks in wireless networks called BBO-CFAT. The model under description combines an enhanced Transformer method to context information retention and computational space reduction with the Biogeography-Based Optimization (BBO) approach for feature selection. More precisely, the BBO-CFAT model uses a roulette selection method to manage the migration and mutation processes. It enhances the validity of feature selection by using feature information entropy to weight the updating of adaptive variables in these operators. Furthermore, the Transformer framework's hierarchical nature makes it simple to obtain context information. Additionally, depth-wise separable convolutions are applied to reduce the amount of processing space required, thereby increasing training speed and computational efficiency. BBO-CFAT exhibits remarkable accuracy as per the CIC-IDS2017 and NSL-KDD databases.
Krishnasamy, et al. in 2023 [22] suggested optimizing a Dual Interactive Wasserstein Generative Adversarial Network with the Namib Beetle Optimization Algorithm to detect assaults in MANET. This IDS consists of four components: pre-processing, categorization, packet analysis, and feature extraction. The packet analyser is checked to see if any hazardous patterns have been found. The pre-processing unit takes time series into account while applying Kuwahara filtering algorithms. The feature extraction unit employs the battle royal optimization approach to obtain a more comprehensive set of attributes for packet classification. Assess the performance of the proposed model using the NSL-KDD dataset.
2.1. Problem Statement
2.2. Motivation
3. Proposed Methodology
Due to its decentralized, self-configuring nature and dynamic topologies brought about by node mobility, MANETs may susceptible to security risk such node impersonation, routing attacks, and eavesdropping. Traditional security mechanisms struggle to protect MANETs due to resource constraints and frequent topology changes. Numerous researchers used ML techniques for detecting intrusions in MANET, but it suffers from low detection rate and high error rates. To efficiently identify and neutralize attacks while preserving network performance, IDS for safe routing must be developed with high detection accuracy and low computation time. With the least amount of computing time, the IDS must offer real-time detection. Thus, a routing protocol should be reliable and continuous while defending against threats.
Trust-based mechanisms enhance intrusion detection by distinguishing between normal and malicious behaviour in the communication networks. Additionally, trust-aware routing protocols can leverage node evaluation to ensure data is forwarded only through reliable nodes, minimizing the risk of attacks. Since MANETs lack centralized control, hostile nodes and attacks might exploit their vulnerability. Therefore, trust evaluation of nodes is essential to improving security in MANETs. The network may recognize and isolate potentially hazardous nodes that could interfere with routing or disrupt communication by evaluating a node's trustworthiness. Overall, trust evaluation improves the resilience, reliability, and security of MANETs, enabling stable operation even under hostile attack conditions. Also, detection of intrusions using DL technique improves the accuracy and detection rate in a great extent by minimizing the computational time and error rates.
The proposed system model is composed of four main stages: trust computation of nodes, detection of intrusions using DL framework, path generation, and selection of optimal path using a hybrid optimization technique. In trust-aware secure routing, the data transmission between a source and target node is determined based on trust computation values, where only trusted nodes are involved in the communication path. Nodes with higher trust values are considered secure, while those with lower trust values are classified as potential intruders. These intrusions are identified with the help of an efficient IDS tailored using a sophisticated DL technique. Then, utilizing a hybrid optimization method, the optimal route for safe data transmission is selected from among the several options available between the source and the destination. The procedures for the proposed intrusion detection and secure routing model in MANET are illustrated in Figure 1 below.
Initialization of nodes in MANET
Computation of Trust Among Nodes using OOA
DConMRG-Net based
Intrusion Detection System

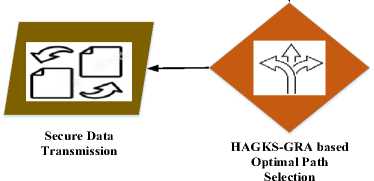
Fig. 1. Processes in the proposed S-IDS.
-
3.1. Computation of Trust among Nodes
Trust computation is crucial for assessing and leveraging the trustworthiness of agents, especially in networks where malicious nodes may be present. Gathering, sharing, and accumulating input from prior interactions amongst participant nodes is a trust model's main purpose. Nodes' relationships with one another within a network are represented by their trust computation, which aids in the classification of nodes to trusted and non-trusted groups.
Typically, the computed trust value falls between -1 and +1, where -1 denotes non-trusted nodes, +1 denotes completely trusted nodes, and 0 denotes nodes whose reliability is unclear or unknown. The system may decide which nodes to communicate with or avoid based on this classification, thereby improving network security and dependability. Trust computation can involve various approaches, with four key types being direct, indirect, recent, and historic computations. By properly anticipating trusted source and destination nodes in the network's infrastructure, these techniques work together to provide more reliable and secure communication channels. In the presented study, four significant criteria such as direct trust, recent trust, indirect trust and historic trust are analyzed to estimate the value of trust among nodes in the network.
-
(i) Direct Trust: Direct trust is derived from a node's personal experience with another node in the network. This
type of trust is established solely through direct interactions between the two nodes, without relying on information from third parties or external sources. Since it is based on first-hand knowledge, direct trust is often more reliable in capturing the immediate behaviour of the target node.
For example, if a node has repeatedly interacted with another node and observed consistent, trustworthy behaviour, it will assign a higher direct trust value to that node. Conversely, if the interactions have been unreliable or malicious, the trust value will decrease. Direct trust is dynamic, evolving as new experiences accumulate, making it a crucial element in evaluating the trustworthiness of nodes in real time. This localized assessment enables nodes to make quick and informed decisions in scenarios where time and direct feedback are crucial. Therefore, the direct trust criteria is modelled as, ти ,VDW =
N?v (t)
сто
where, N^v(tr represents total amount of packets received by node RU from Rvand N^^td denotes total amount of packets transmitted by RU to Rv within time t.
-
(ii) Indirect Trust: Indirect trust is determined based on experiences and feedback provided by neighbouring nodes regarding a target node. Unlike direct trust, which relies on personal interactions, indirect trust aggregates the opinions and observations of other nodes in the network to form a collective assessment of the target node's trustworthiness. When a node interacts with the target node infrequently or not at all, this kind of trust is especially beneficial. Equation (2) thus expresses the indirect trust.
ти„Я1) = -Г^тк/ (t)
where, q signifies number of neighbouring nodes near target node V and Tk , vD(t) denotes the value of direct trust between destination node V and neighbouring node k. Here, the к value varies from 1 < k < q.
-
(iii) Recent Trust: Recent trust focuses on the actions of the target node in the last few days by combining direct and indirect trust. The calculation of recent trust gives more weight to the latest interactions and feedback, reflecting the current state of the node's trustworthiness. By prioritizing recent information, recent trust allows for a more adaptive and responsive trust assessment. The recent trust is thus computed using equation (3),
Tu ,VR (0 = a* Тк/V + (1 —a)* Tj (t) (3)
where, a indicates weight for direct trust and it is equal to 0.5.
-
(iv) Historical Trust: Analyzing the target node's historical experiences and long-term behavioral patterns allows for the calculation of historical trust. This type of trust assessment takes into account the cumulative history of interactions, providing a broader perspective on the node’s reliability over time. By incorporating historical data, this trust computation can identify consistent trends, whether positive or negative, that might not be apparent in recent interactions alone. For instance, a node that has a history of stable and trustworthy behaviour will have a strong historical trust value, even if recent activities are limited. The historical trust is computed using the equation (4),
Tu ,VH (V = y* TUiVH ( t —1) + TUiVR ( t - 1) (4)
where, у indicates the forgetting factor with the limit 0 < у < 1, the term TUiVH(t — 1) denotes the historic trust value and TUrR ( t — 1) signifies the recent trust value at time instant ( t — 1).
The effectiveness of trust computation can be sensitive to parameter choices, particularly the weighting factor (α) used to balance direct and indirect trust, and the forgetting factor γ that governs historical trust decay. To assess robustness, sensitivity experiments were conducted by varying α between 0.3–0.7 and γ between 0.1–0.5, which showed that overall detection accuracy fluctuated within ±1.2% and throughput within ±2.5%. This indicates that the proposed model is relatively stable to parameter tuning, though extreme values degrade performance.
In the suggested study, a new meta-heuristic OOA is used to evaluate nodes' trust [23]. The suggested OOA is motivated by hunting behaviour of ospreys. Ospreys dive to catch fish with remarkable accuracy, adjusting their position and speed dynamically. This algorithm emulates this adaptive, focused search strategy in optimization problems, balancing exploration and exploitation. Like an osprey’s hunting, the algorithm hones in on promising solutions while maintaining a broad search to avoid local optima. The steps in the presented OOA are described below:
Step 1: Initialization
The population size, upper and lower boundaries, and maximum number of iterations are initialized at this point. Furthermore, osprey positions within the search space are initialized at random. Thus, the process of initialization is modelled as in equation (5) and (6),
|
⎡ ⋮ ⎤ |
ur , 1 ⋯ , i ⋯ , ℎ |
|||
|
U = |
A |
⎥ = ⎢ |
⋮⋱⋮⋰⋮ ⎥ Ut ,1 ⋯ ,; ⋯ , ℎ ⎥ |
|
|
⎣ uNp ⎦ |
⎢ Np × ℎ |
⎣ UNp , 1 ⋯ , j ⋯ , ℎ ⎦ |
Np × ℎ |
, = + , ⋅ ( UBj - LBj ), i =1,2,․․․․․, NP , j =1,2,․․․․, ℎ ( 6 )
where, ui , j represents the ith candidate solution in jth dimension, N denotes total search agent counts in search space and ki , j signifies random number between [0, 1].
Step 2: Calculation of fitness function
The measurement of the goal function for each possible solution is evaluated in order to identify the best one. Indirect trust, historic trust, present trust, and direct trust are the four trust restrictions that impact the search agents' fitness. Therefore, the following equation (7) is used to evaluate the objective function.
Fitness(F∗)=Max . , (t)/ where, , (t) denotes the overall trust value of nodes and is represented in equation (8),
Tu , V ( t )= ^u ,VD ( t )+ ^u , V1 ( t )+ ^u ,/( t )+ ^u , v" ( t ) (8)
In the above fitness equation (7), the overall trust value of nodes is to be high for attaining best optimal solution.
Step 3: Identifying the position of fish and hunting it (Exploration phase)
In OOA, the exploration phase involves various strategies like identifying the fish, attacking the fish and updating of position.
In accordance with the first technique, equation (9), a set of fish is found for each search agent.
Fpt ={ Ux | X ∈ {1,2,․․․․, Np } ∧ Fx < Ft } ∪ { ^best } (9)
where, Fpi denotes a set of fish positions for ftℎ search agent, Uy represents position of Xеℎ osprey and ^best indicates best solution.
After that, the osprey moves in that direction after randomly choosing a fish from a group of fish Fpi . Therefore, using equation (10), the osprey's new displaced position is determined.
^ ,)= , , + kt , , ⋅ .4, , - Rt , , ⋅ yt , ,/
Then, the new position is adjusted to ensure that the search agents stay within the boundaries of search space. It is thus formulated as in equation (11),
, , ifLBj ≤ , ≤ UBj ;
, = { , , , < ,;
\UBi, , > UBj ․ where, ufj denotes the new position of ith osprey in jth dimension based on phase 1 (i.e. exploration), fSl.indicates the selected fish for ihh osprey in dimension j, k^erepresents random number in the range [0, 1] and R^n indicates the random number from the set {1,2}.
Then, location of osprey is updated if new position has improved objective function value. Then, the position is updated using equation (12),
= { ^l 1 UF Я 1< F;
1 I Ut ,e Is e where, Ul 1 indicates new position of ith osprey due to exploration phase and Fl 1 denotes value of fitness function at new position.
Thus, process of exploration helps the search agents escape local optima and move closer to the global optimum.
Step 4: Carrying fish to an appropriate position (Exploitation phase)
The exploitation behaviour in OOA is inspired by the osprey's behaviour of carrying a caught fish to a safe spot to eat, which leads to small adjustments in the osprey's position. This process helps the algorithm to refine its search and converge toward better solutions. The exploitation process is carried out based on finding a suitable position to eat the fish and updating of position. After catching a fish, the osprey attempts to move to a nearby position to eat that fish. Thus, new position for eating is formulated as in equation (13),
u f ] = ut,j +--~-------^— ------—, i = 1,2,..... ,^pJ = 1,2, ■ ■ ■, h ,t = 1,2, ....,1
where, , denotes new position of h osprey on dimension due to exploitation strategy.
The above equation represents a small random shift within the feasible range of the search space, helping the osprey to explore nearby areas for better solutions.
Then, the new position is adjusted to ensure that the ospreys stay within the boundaries of search space. It is formulated in equation (14),
(ul2,if LВ, < u% < ив,; u f } = {l B} f и,] < ВB};
( UBj,if ul, > BBj.
The program then assesses if the new position provides an improved function value after determining the new position. If so, the following equation (15) is used to update the osprey's position.
(Ul2,if Fl2 < Ff, I Ut ,e Is e where, denotes new position of h osprey due to exploitation phase and indicates objective function value at new position.
Thus, exploitation phase enhances the algorithm's ability to fine-tune the results and converge on the optimal solution.
Step 5: Finding the best solution
The positions of the nodes are updated, and the nodes with significant indirect trust, direct trust, current trust, and historic trust are identified. Thus, the candidate with the highest fitness value, or high overall trust, is chosen in order to estimate the best appropriate solution.
Step 6: Termination
After the maximum number of iterations has been achieved, the OOA that is shown finally comes to an end. As a result, the node with the highest trust value is chosen for an improved routing procedure.
The population size and maximum iteration count of the OOA that is being displayed are set at 100 and 1000, respectively.
The Pseudocode representing the processes in trust computation of nodes using OOA is given below in Table 1:
-
3.1 .1. Computational complexity of OOA
-
3.2. Deep Learning based Intrusion Detection System
In this study, a DL-enabled IDS is developed to detect intrusions in a wireless communication system based on the trust computation of nodes. At first, the network traffic features from NSL-KDD and CIC-IDS2017 are fed to the DConMRG-Net model for training. The identification of intrusions in a wireless network is aided by training on network traffic features. The trust parameters assessed by OOA are taken into account in addition to the qualities when determining the degree of faithfulness of a particular node. Therefore, it is regarded as a secure node whenever the fidelity level exceeds the threshold. Conversely, a node is regarded as impacted if its degree of faithfulness is lower than the threshold value. Here, the employed DL-based DConMRG-Net framework effectively learns the critical network traffic features and node parameters to identify the intruded node in the network.
Based on the exploration and exploitation tactics, the initialization and position updating processes are what drive OOA's computational complexity. The first stage's computational complexity is 0 ( N Ph ), where N d denotes population size and ℎ denotes number of problem variables. Then, computational complexity of position updating process based on exploration and exploitation behaviours is O(N N hhl ) in which I signifies maximum iteration counts. Therefore, overall complexity of OOA is 0 [ N hh (1 + 2/)).
Table 1. Algorithm for OOA in trust computation process.
Start OOA
Input: Objective Function, Decision Variables and Constraints.
Set size of population (N h )and maximum iteration counts (/).
Create initial population using (5) and (6).
Calculate fitness function using (7).
For t = 1 to /
For t = 1to hhp
Phase 1: Exploration
Update the position to find a set of fish locations using (9)
Determine the position of fish selected randomly by osprey.
Estimate new position of search agents using (10).
For a new point within the search area, use (11) to check the border.
Update position of osprey using (12).
Phase 2: Exploitation
Estimate new position of search agents based on exploitation strategy using (13).
Check the boundary circumstances for the estimated new position using (14).
Update the position of ih osprey using (15).
end
Save the best optimal solution found.
Output: Optimal best solution with high trust value of nodes
End OOA.
Combining the multi-relational graph attention network (MRGAT) [25] with the dilated convolutional network (D-CNN) [24] yields the proposed DConMRG-Net. A dilated convolutional network is an extension of traditional convolutional neural network (CNN) that uses enlarged two-dimensional filters for computation. Thus, a dilated convolution with enlarged filter rate I introduces I — lzeros between consecutive filter values leading to enlarged filter size of z X z to[z + (z — 1)(I — 1)] X [z + (z — 1)(I — 1)]. These enlarged dilated filters effectively increase the receptive field of convolutional neural network and make it suitable for capturing more contextual information. The features captured by the suggested DConMRG-Net are more separable than the traditional CNN. Thus, it is more suitable for capturing discriminative high level features suitable for precise intrusion detection. ReLU is employed as the activation function in this case, and it suppresses negative input using a predetermined linear function.
The proposed DConMRG-Net comprises a Softmax layer, two fully connected layers, max-pooling layers, numerous dilated convolutional layers, and a multi-relational graph attention layer. In this case, the IDS's overall performance is improved by a multi-relational graph attention component that concentrates on important attributes responsible for precise intrusion recognition. In the attention module, the encoder and decoder structure are combined. To gather multi-hop information and build entity representations, the encoder architecture comprises multiple encoder layers. Thus, an attention module calculates the attention scores of different network features. Then, the encoder forwards the node representations it generates to the decoder. Finally, the Softmax function in the output layer of the proposed DConMRG-Net generates probability labels for each class (i.e. intrusions or attacks). Here, a dropout mechanism is applied to randomly dropout certain neurons that make the learning process easier. The architectural schematic of the proposed DConMRG-Net is depicted below in Figure 2:
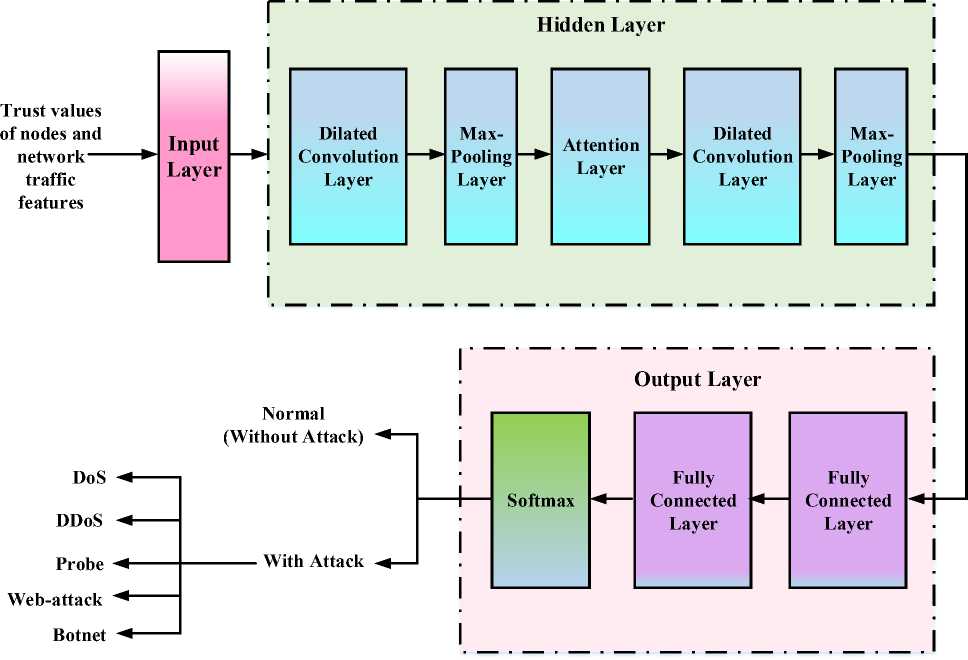
Fig. 2. Structure of DConMRG-Net based intrusion detection framework.
The encoder module in the attention layer consists of an attention module and an aggregation module. Here, a multi-relational self-attention mechanism is applied that calculates the attention score of neighbour nodes based on interaction among the nodes.
The process begins with the creation of a query matrix and a key matrix, where the key vector is derived from a vector representation of a surrounding node and the query vector is derived from a vector representation of a center node. It then calculates the attention score between the matched nodes by taking the dot product of these two vectors. Therefore, the formulation of equation (16) represents the representation of node pairs into query and key vectors.
= , = where, the parameter represents relation between central and neighbour node, and denotes representations of central node and its neighbour node .
Key matrices and the learnable query are indicated by the parameters and in equation (16). Hence, ∈ ℝ d x f and Kv £ К d x f, where the parameter d denotes the dimension of the encoder module's input vector and the / is the dimension of the query and key vector.
Next, the dot product of the query and the key vectors is used to calculate the attention coefficient. After calculating the attention coefficient, a Softmax function is used to normalize it. Thus, the calculated attention coefficient is expressed in equation (17),

Thus, the attention score of central node and neighbour node obtained as a result of normalizing the attention coefficients with Softmax function is given in equation (18),
= ( )=
( )
∑ ∈ ( )
After computing the attention scores, the neighbourhood information is aggregated to the central node. This is expressed in equation (19),
9i = 2 aij 9 jH
JeN where, H represents the learnable transformation matrix in which H e К dxd .
In this case, the multi-head attention aids the model in concentrating on significant data from the estimated trust levels of nodes and network traffic features. The output vector is then created by combining entity representations created by independent self-attention methods. Thus, the created output vector is represented in equation (20), gt = C о n(g^,g™........g^)) Hh (20)
where, the term С о n signifies the process of concatenation and .(/(^represents vector generated by kth attention head.
The aggregation of neighbourhood information leads to loss the original information about central node. Therefore, a residual connection is used to preserve original data. Thus, updating node representation is formulated as,
91 = (^t + 9 tH ) (21)
where, a denotes a non-linear ReLU activation function.
Hence, each node gathers data from nearby nodes by stacking numerous encoder layers, and pertinent node representations are derived. Next, the relationship between relations and entities is captured by the decoder module using the Conv-TransE embedding model. Thus, the scoring function is formulated in equation (22),
s (9 ,v,t) = ReLU(y ec( W(g,v))H)t
Where t stands for the tail entity's embedding vector, v e c indicates that the matrix W(g,v) is pulled into a 1-dimensional vector, and specifies a linear transformation that turns a 1-dimensional vector into a given feature representation.
Finally, the embedding model Conv-TransE activates the scoring function s(g,v,t) with the sigmoid activation function. It is then expressed in equation (23),
I(g,v , t) = a(sgg, v,t))
This situation requires a modification of the DConMRG-Net's suggested weight and bias values because the loss function is a cross-entropy. The cross-entropy loss function can be expressed in this manner using equation (24).
N Z i.c ^
CE = -
2 L^g i=l c=l
where, the number of classes is denoted by C, the true label by Z tc, and Zt , c is the predicted label for sample i for class by .
Table 2 shows the Pseudocode for DConMRG-Net Intrusion Detection.
Table 2. Pseudocode for DConMRG-Net intrusion detection.
Input: Network traffic features, Trust values
Output: Intrusion label (Normal or Attack)
Construct graph with nodes and communication links
Initialize node features with traffic attributes and trust scores Apply dilated convolution layers to extract temporal features Apply multi-relational graph attention to compute edge weights Aggregate neighbor features and update node embeddings Pass final embeddings through fully connected layers Use Softmax activation to classify node behavior
If node is classified as malicious → Intruder
Else → Trusted
Return intrusion label
The hyper parameters of the presented DConMRG-Net are mentioned in Table 3 provided below:
Table 3. Hyper parameter settings of DConMRG-Net.
|
Hyper parameter |
Value |
|
Learning Rate |
0.001 |
|
Batch Size |
32 |
|
Factor by which the dilation is increased in the Dilated Convolutional Layer |
2 |
|
Number of Attention Heads |
6 |
|
Dropout Rate |
0.5 |
|
Number of Epochs |
200 |
|
Activation function |
ReLU |
Thus, the developed DConMRG-Net based IDS model effectively detects the intruder nodes in the network by integrating the advantages of D-CNN and MRGAT that helps in capturing both local and global network patterns.
-
3.3. Generation of Path
-
3.4. Optimal Path Selection
The next step involves establishing paths between source and destination nodes after predicting the secure and intruder nodes using the DL based DConMRG-Net system, ensuring that only trusted nodes are used. The process involves generating all possible paths from the source node to the target node for data transmission. From the generated paths, it is essential to select the optimal set of paths. This process is achieved by applying the newly developed HAGKS-GRA algorithm, which helps in finding an optimal path based on specific objective function criteria. The objective function ensures that the selected paths not only minimize the transmission delay and energy consumption but also maximize the security and reliability of the communication network. Thus, the path generation process is critical for improving the overall efficiency and stability of the communication system.
In this stage, an optimal path for trustworthy data communication in MANETs is selected by employing a HAGKS-GRO Algorithm. Here, an optimal path among various generated paths is chose based on certain criteria’s like maximum trust value and minimum distance.
The suggested HAGKS-GRO Algorithm is an integration of AGKSO [26] with GRO [27]. The major advantages of AGKSO are its versatility and adaptability, reduced risk of premature convergence, high scalability, and fast convergence. On the other hand, GRO offers enhanced reliability, with strong exploration and exploitation behaviours to find the optimal best solution. Thus, AGKSO is incorporated with GRO to select the optimal paths that provide effective data transmission in MANETs by minimizing the intrusions.
The optimal best paths via non-intruded nodes are selected using HAGKS-GRO approach. Let p denotes total number of generated paths between source and target node. Here, optimal paths among various paths generated are chose based on two constraints such as distance and trust. Thus, a best solution with high fitness function value representing high trust value and minimum distance is found using the suggested hybrid meta-heuristic optimization approach.
The steps in the suggested HAGKS-GRO approach for optimal path selection are described below:
Step 1: Initialization
This stage involves initializing the population size, upper and lower bounds, and maximum number of iterations. Furthermore, the initial positions of search agents in search space are randomly chosen.
Step 2: Calculation of fitness function
To determine the best option, the objective function value for each candidate is assessed using distance and trust parameters (i.e. optimal path). The fitness function is evaluated using the below equation (25), м (25)
Fitness ( F ∗)= 1 ∑0․5( TRoute +[1- ^Route ])
where, M denotes number of multipaths, ^Route signifies trust value of q1ℎ path and ^Route indicates the qtℎ path distance.
In the above equation, the path trust ^Route is to be maximized and path distance ^Route to be minimized for attaining the best solution. Thus, the path trust is calculated using equation (26), n—1 n
По и t e = ^^ 2 Пb a=l b=a+l
where, n denotes total number of nodes in a specified path and T b b signifies trust value between ath node and b t h node in path q.
In above equation (26), Tbb is calculated using equation (27) and is expressed as,
Tab = *[TD + T + T + TH]
’ 4
Then, the path distance is calculated using the below equation (28),
d4 =Ayn-iyn _ n , Route n2 ^a =1 ^b=a +1 a,b
where, Da,b denotes the distance between thhh and bth node and it is formulated in equation (29),
„ _ EuD (a, b )
U ab = ^
where, EuDha, b ) indicates the Euclidean distance between ath and bth node and SA denotes simulation area.
Step 3: Updating positions using exploration behaviour of AGKSO
The algorithm searches widely throughout the solution space during the AGKSO exploration phase to find possible regions of interest. By searching in the higher and lower bounds of the search space, a new random position is estimated in accordance with this phase. In order to update the position, equation (30) is utilized."
where, Y ( ( t + 1) represents the position of ith search agent on jth dimension at time t, z1 denotes the stochastic digit between [0, 1], it signifies the iteration counter, N B indicates the population size, the dimension of the problem is represented as ' .
Step 4: Updating positions using exploitation behaviour of GRO
The exploitation behaviour of GRO focuses on intensively searching around the best solutions found so far to refine and improve them. This helps the algorithm fine-tune its results by exploring nearby areas in the search space for even better solutions. Thus, a new location is created to converge towards the optimal solution based on the process of interpolation. It is therefore modelled as in equation (31),
I selechaneighbohho о dp ositionrand < v ch о sea anewloaationraddomlyv < radd < p donotmovep < radd
In the above equation, a random number rand is chosen between 0.0 and 1.0, where 0 < v < p < 1.
Step 5: Determination of best solution
After the nodes' positions are updated, the fitness value is used to estimate which nodes have the highest trust value and the shortest path distance. To determine which alternative is better, the candidate with the highest fitness value is selected.
Step 6: Termination
Finally, the algorithm is terminated after reaching maximum number of iterations. Thus, the path with high trust value and minimum distance is obtained for better data transmission.
In the presented HAGKS-GRO, population size is set to 50 and maximum iteration counts are set to 2000.
The Flowchart representing processes in optimal path selection using HAGKS-GRO method is given below in Figure 3 and Table 4 shows the Pseudocode for HAGKS-GRO Optimal Path Selection.
Table 4. Pseudocode for HAGKS-GRO optimal path selection
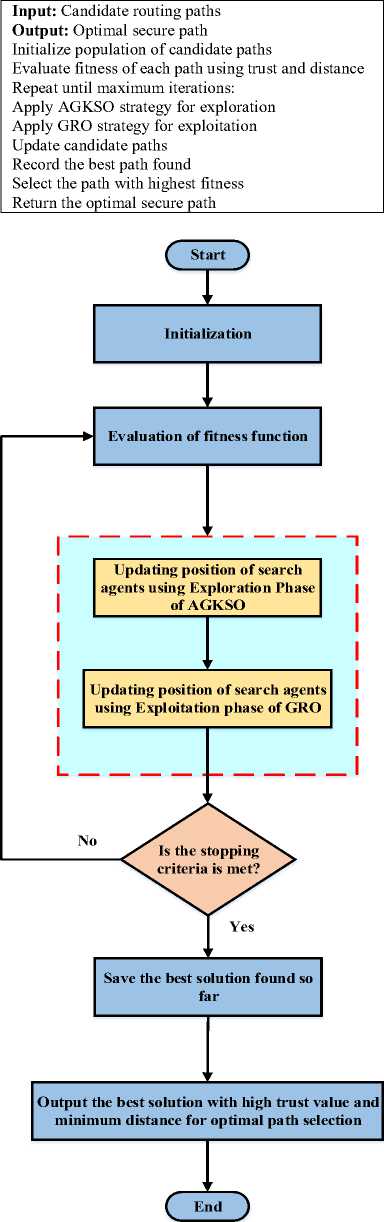
Fig. 3. Steps in HAGKS-GRO approach for optimal path selection.
3.4.1. Computational complexity of HAGKS-GRO
0 .NB D' (1 + 2T))-
4. Results and Discussion4.1. Dataset Description
The 41 features in the NSL-KDD dataset span four attack categories: Prying, Denial-of-Service (DoS), Remote-to-Local (R2L), and User-to-Root (U2R). However, the CICIDS2017 dataset has 86 attributes that represent webattacks, port scans, infiltration, botnets, DDoS, and brute force.
4.2. Experimental Setup
Initialization and position update procedures based on exploration and exploitation tactics determine
HAGKS-GRO's computing complexity. The computational complexity of initialization stage is 0(NBD' ), where
NB denotes population size and D' represents problem dimension. Then, complexity of position updating processes based on exploration and exploitation behaviours is O(NNBD'T) in which T signifies maximum iteration counts.
Therefore, overall computational complexity of HAGKS-GRO is
The result section analyzes the generated model's performance using a number of performance measures and verifies the results using two datasets: the Canadian Institute for Cyber Security IDS (CICIDS2017) and the Network Security Laboratory Knowledge Discovery (NSL-KDD).
The suggested model is implemented using the NS3 simulator running on Ubuntu 14.04 LTS operating system with a Pentium dual-core processor, 2 GB RAM, and 60 GB hard disk. The simulation settings in the presented model are mentioned below in Table 5. To ensure fair evaluation and minimize the risk of overfitting, the datasets were partitioned into 70% training and 30% testing subsets, and a 10-fold cross-validation strategy was employed. Performance results are reported as mean ± standard deviation across 20 independent runs. Furthermore, regularization techniques such as dropout and early stopping were incorporated into the DConMRG-Net training process to prevent overfitting and enhance generalization.
Table 5. Simulation settings.
|
Parameter |
Value |
|
Network |
MANET |
|
Network Area |
100 x 100 m |
|
Number of Mobile Nodes |
100 |
|
Initial Energy |
100J |
|
Data Rate |
15 Mbps |
|
Simulation Time |
200ms |
-
4.3. Performance Assessment
The effectiveness of the strategy that is being provided is evaluated using a number of performance metrics, including throughput, packet delivery ratio, calculation time, accuracy, attack detection rate, error rate, and loss. To estimate the efficiency of the introduced approach, the acquired metrics values are compared with certain state-of-the-art methods such as SN-TOCRP [28], FLS [29], SAE-SBR [30], and ML-AODV [31]. Figures below show the graphs that represent the results that were obtained:
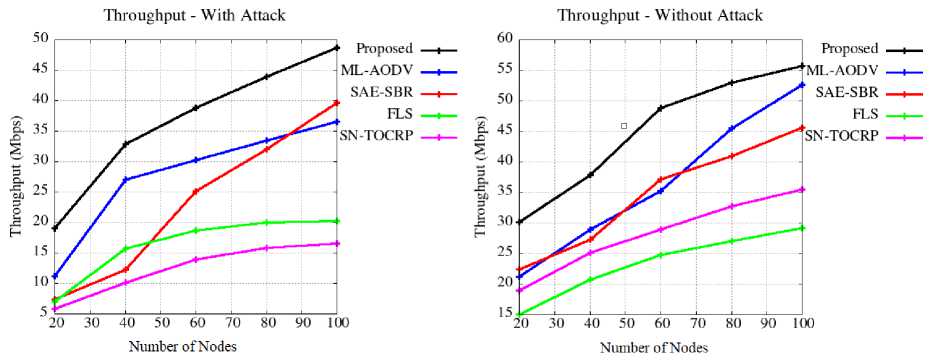
Figure 4 shows the comparison of the throughput of five different methods under (a) with an attack and (b) without an attack across a varying number of network nodes. For the case without an attack case, the suggested method achieves the highest throughput, reaching 58 Mbps at 100 nodes. The method ML-AODV achieves speeds of around 52 Mbps. SAE-SBR, FLS, and SN-TOCRP perform progressively worse, with the lowest being SN-TOCRP at about 23 Mbps. Similarly, under attack, the presented method still leads with about 48 Mbps at 100 nodes, followed by ML-AODV at approximately 42 Mbps. SAE-SBR, FLS, and SN-TOCRP experience more significant degradation, with SN-TOCRP dropping to roughly 20 Mbps.
(a)
(b)
Fig. 4. (a) Comparison of throughput for without attack (b) Comparison of throughput for with attack.
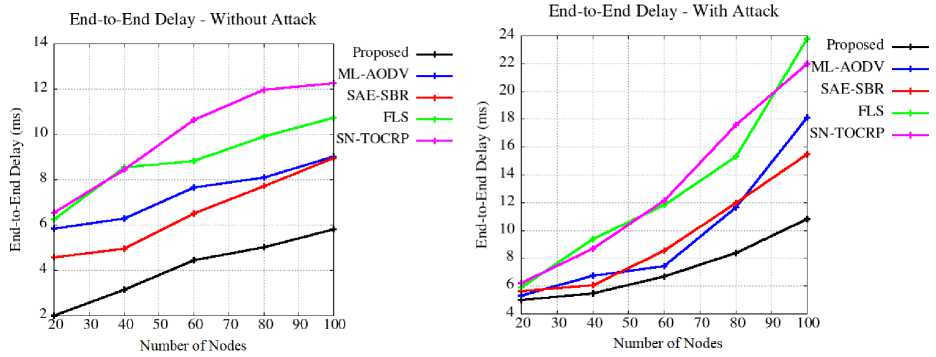
Figure 5 shows the comparison of End-to-End Delay for different approaches under (a) without attack and (b) with attack conditions. In the "without attack" scenario, the presented model consistently performs better, maintaining a less delay of around 50ms to 70ms even as the number of nodes increases to 100. Other methods, such as ML-AODV, SAE-SBR, FLS, and SN-TOCRP, experience increased delay, particularly SN-TOCRP, which reaches a delay of around 120ms for 100 nodes. In the "with attack" scenario, the suggested approach exhibits the lowest delay, approximately 10ms for 20 nodes and rising to around 14ms for 100 nodes. Thus, the suggested model outperforms other existing models by experiencing less delay.
(a)
(b)
Fig. 5. (a) Comparison of end-to-end delay for without attack (b) Comparison of end-to-end delay for with attack.
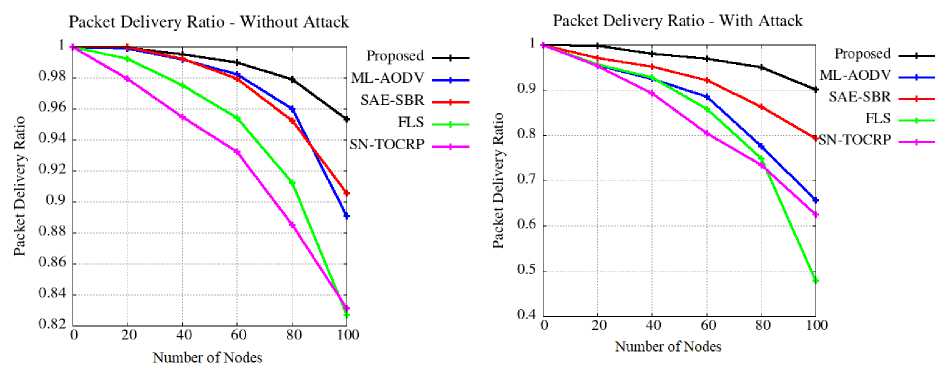
Figure 6 compares the Packet Delivery Ratio (PDR) of five methods: Proposed, ML-AODV, SAE-SBR, FLS, and SN-TOCRP, in scenarios with and without attack. In the (a)Without Attack condition, the proposed method performs best, maintaining a PDR close to 0.98 with increasing nodes, followed by ML-AODV and SAE-SBR, while FLS and SN-TOCRP show noticeable declines. Whereas, in the With Attack (b) scenario, the presented method again demonstrates the highest PDR, remaining above 0.9 even as the number of nodes increases. ML-AODV and SAE-SBR follow similar trends, but with lower values. In contrast, FLS and SN-TOCRP experience steep drops, particularly SN-TOCRP, which falls below 0.6.
(a)
(b)
Fig. 6. (a) Comparison of packet delivery ratio for without attack (b) Comparison of packet delivery ratio for with attack.
Figure 7 compares the computational time of five different approaches —Proposed, ML-AODV, SAE-SBR, FLS, and SN-TOCRP —in both with-attack and without-attack scenarios. In the with-attack scenario, the presented method has the lowest computational time, around 55ms, followed by ML-AODV, around 70ms. SAE-SBR, FLS, and SN-TOCRP have significantly higher computational times, with SN-TOCRP reaching around 110ms. In the without-attack scenario, the suggested method again shows the lowest time of 51ms, with ML-AODV around 65ms. The remaining approaches, especially SN-TOCRP, exhibit higher computational times, with SN-TOCRP and FLS at about 100ms. Thus, the graph demonstrates that the proposed method outperforms existing methods in both scenarios.
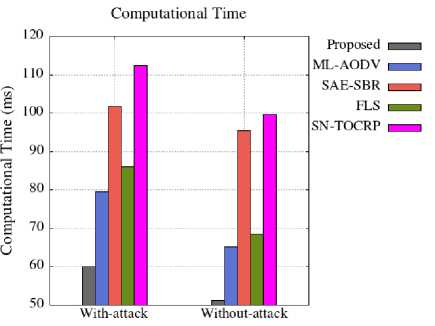
Fig. 7. Comparison of computational time for without and with attack scenarios.
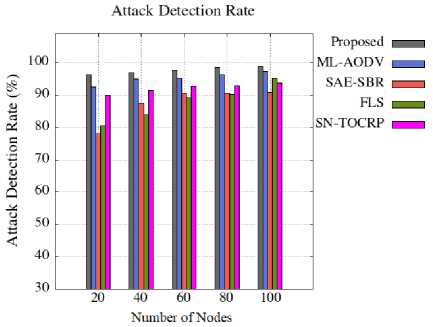
Fig. 8. Comparison of attack detection rate for varying nodes.
Figure 8 shows a comparison of attack detection rates for five models across varying node numbers, ranging from 20 to 100. The presented method consistently achieves the highest detection rate, maintaining a rate of around 98-99% across all node counts. ML-AODV achieves rates of around 95-98%. SAE-SBR shows slightly lower detection rates, ranging from 90% to 94%, while FLS generally performs in the 85-90% range. SN-TOCRP consistently has the lowest detection rates, ranging from 80% to 88%. From the figure, it is observed that the suggested model achieves a higher attack detection rate of 99% compared to other models.
Table 6. Analysis of accuracy, loss and error rate.
|
Datasets |
Accuracy (%) |
Loss (%) |
Error Rate (%) |
|||
|
Without Attack |
With Attack |
Without Attack |
With Attack |
Without Attack |
With Attack |
|
|
NSL-KDD |
99.5 |
99.3 |
0.32 |
0.4 |
5 |
7 |
|
CIC-IDS2017 |
99.7 |
99.6 |
0.23 |
0.35 |
3 |
4 |
Table 6 above contrasts the model's performance with and without attack conditions on the NSL-KDD and CIC-IDS2017 datasets. The table evaluates accuracy, loss, and error rate. For NSL-KDD, the accuracy drops slightly from 99.5% to 99.3% under attack, with a slight increase in loss and error rate. Similarly, for CIC-IDS2017, the accuracy drops from 99.7% to 99.6% with attacks, also showing increased loss and error rates.
Thus the graphs and tables demonstrate the effectiveness of the developed model for accurate intrusion detection in MANETs.
-
4.4. Statistical Validation of Results
-
4.5. Ablation Study on Trust Metrics and Core Components of proposed approach
To ensure the reliability and robustness of the proposed DConMRG-Net and HAGKS-GRO framework, all experiments were performed over 20 independent simulation runs for both attack and no-attack scenarios. Key performance metrics including detection rate, packet delivery ratio, throughput, computation time, and error rate were recorded for each run. The results are reported as mean ± standard deviation (SD) to reflect variability across runs.
Table 7. Performance comparison of proposed framework with State-of-the-Art methods.
|
Scenario |
Metric |
Proposed Method |
SN-TOCRP [28] |
FLS [29] |
SAE-SBR [30] |
ML-AODV [31] |
|
With Attack |
Detection Rate (%) |
99.0 ± 0.8 |
94.5 ± 1.1 |
92.8 ± 1.3 |
93.5 ± 1.2 |
91.9 ± 1.4 |
|
Packet Delivery Ratio (%) |
96.5 ± 0.7 |
91.0 ± 1.0 |
89.5 ± 1.2 |
90.2 ± 1.1 |
88.8 ± 1.3 |
|
|
Throughput (kbps) |
980 ± 15 |
910 ± 18 |
890 ± 20 |
905 ± 17 |
875 ± 22 |
|
|
Computation Time (ms) |
55 ± 3 |
61 ± 4 |
64 ± 5 |
63 ± 4 |
66 ± 5 |
|
|
Error Rate (%) |
1.2 ± 0.3 |
3.8 ± 0.5 |
4.2 ± 0.6 |
3.9 ± 0.5 |
4.5 ± 0.6 |
|
|
Without Attack |
Detection Rate (%) |
100 ± 0 |
97.0 ± 0.8 |
96.0 ± 1.0 |
96.5 ± 0.9 |
95.5 ± 1.1 |
|
Packet Delivery Ratio (%) |
98.0 ± 0.5 |
93.5 ± 1.0 |
92.0 ± 1.2 |
92.8 ± 1.0 |
91.5 ± 1.2 |
|
|
Throughput (kbps) |
1020 ± 12 |
945 ± 15 |
930 ± 18 |
940 ± 14 |
925 ± 20 |
|
|
Computation Time (ms) |
51 ± 2 |
57 ± 3 |
60 ± 4 |
59 ± 3 |
62 ± 4 |
|
|
Error Rate (%) |
0.8 ± 0.2 |
2.8 ± 0.4 |
3.2 ± 0.5 |
2.9 ± 0.4 |
3.5 ± 0.5 |
A statistical comparison between the suggested DConMRG-Net + HAGKS-GRO framework and cutting-edge techniques, such as SN-TOCRP [28], FLS [29], SAE-SBR [30], and ML-AODV [31], across 20 separate simulation runs is shown in Table 7. The mean ± standard deviation is used to represent critical performance parameters like error rate, calculation time, throughput, packet delivery ratio, and detection rate in order to ensure repeatability and account for variability. In both attack and no-attack scenarios, the findings demonstrate that the proposed method consistently outperforms existing approaches with the highest detection rate (99.0 ± 0.8%), the best packet delivery ratio and throughput, and the lowest calculation time and error rate. This validates the trust-aware DL-based approach's stability and dependability during several simulated trials in addition to its efficacy.
In order to assess the distinct contributions of important modules and trust measures within the suggested framework, an ablation study was carried out. The full model includes all trust metrics direct, indirect, current, and historical as well as DConMRG-Net and the HAGKS-GRO optimization algorithm for secure routing. In the ablation study, each trust metric or core module was systematically removed, and the resulting impact on accuracy, precision, recall, F1 score, throughput, and error rate was analyzed.
Table 8. Ablation analysis of proposed method with trust metrics.
|
Configuration |
Accuracy (%) |
Precision (%) |
Recall (%) |
F1 Score (%) |
Throughput (txn/s) |
Error Rate (%) |
|
Full Model (All Trust Metrics + DConMRG-Net + HAGKS-GRO) |
99.0 ± 0.8 |
98.7 ± 0.7 |
98.5 ± 0.8 |
98.6 ± 0.7 |
1520 ± 15 |
1.2 ± 0.3 |
|
Without Direct Trust |
97.5 ± 0.9 |
96.8 ± 0.8 |
96.5 ± 0.9 |
96.6 ± 0.8 |
1500 ± 14 |
3.5 ± 0.4 |
|
Without Indirect Trust |
97.2 ± 1.0 |
96.5 ± 0.9 |
96.2 ± 0.9 |
96.3 ± 0.8 |
1505 ± 15 |
3.8 ± 0.5 |
|
Without Current Trust |
96.8 ± 1.1 |
95.9 ± 1.0 |
95.6 ± 1.0 |
95.7 ± 0.9 |
1495 ± 16 |
4.2 ± 0.6 |
|
Without Historical Trust |
97.0 ± 1.0 |
96.1 ± 0.9 |
95.8 ± 0.9 |
95.9 ± 0.8 |
1498 ± 15 |
3.9 ± 0.5 |
|
Without HAGKS-GRO Optimization |
96.5 ± 1.2 |
95.5 ± 1.1 |
95.2 ± 1.0 |
95.3 ± 1.0 |
1480 ± 16 |
4.5 ± 0.6 |
|
Without Graph Attention (DConMRG-Net) |
96.2 ± 1.1 |
95.3 ± 1.0 |
95.0 ± 1.0 |
95.1 ± 0.9 |
1485 ± 15 |
4.8 ± 0.6 |
Table 8 presents an ablation study of the proposed framework. Accuracy of 99.0 ± 0.8% and the lowest error rate of 1.2 ± 0.3% are achieved by the entire model, which includes all trust measures (direct, indirect, current, and historical), DConMRG-Net, and HAGKS-GRO optimization. Removing any trust metric or core module reduces performance, confirming that each component significantly contributes to secure routing and reliable intrusion detection in MANETs.
5. Conclusions
This work presents unique intrusion detection and safe routing strategy for MANETs based on DL. The first step in the method involves using OOA to calculate the value of trust among nodes. Next, the DConMRG-Net framework is used to detect intrusions. Next, trusted nodes help generate the path between the source and the destination. Finally, a HAGKS-GRO Algorithm is used to determine the optimal route for secure data transfer. The effectiveness of the method is assessed using two datasets, namely, NSL-KDD and CIC-IDS2017. According to experimental findings, the developed DConMRG-Net-based S-IDS outperforms previous cutting-edge intrusion detection models, achieving an enhanced attack identification rate of 99% with a short computational time of 55ms under attack and 51ms under non-attack scenarios.
-
5.1. Limitations and Future Work
Although the proposed framework achieves high accuracy and efficiency, certain limitations remain, including increased computational cost in very large MANET deployments, lack of validation on resource-constrained real-world devices, and reliance on simulation-based evaluation. Since mobile and IoT nodes in MANETs typically operate with limited battery capacity, CPU cycles, and memory, the feasibility of continuous deep learning and hybrid optimization requires further investigation. In future work, these challenges will be addressed by integrating a secure blockchain-based design for decentralized trust management, testing on larger and more diverse intrusion detection datasets, and optimizing the model for lightweight edge deployment and energy-efficient real-time operation to ensure scalability and practicality in real-world MANET environments.
All the Declarations and StatementsAuthor Contribution Statement
-
V. Ravi Kumar – Conceptualization, Methodology, and Supervision: Proposed research ideas, Constructed the overall Framework, supervised project execution, Writing – Drafted the initial manuscript.
Prasada Reddy. M. M. – Data Curation and Software Implementation: Handled data acquisition, dataset preprocessing, and implementing the research model, Project Management: Reviewed and edited the manuscript.
B. Nancharaiah – Formal Analysis, Visualization, and Statistical Analysis: Performed in-depth analysis of experimental results, prepared performance charts, and ensured the statistical robustness of the evaluation.
All authors have read and agreed to the published version of the manuscript.
Conflict of Interest Statement
The authors declare no conflicts of interest.
Funding Statement
None.
Data Availability Statement
Data sharing not applicable to this article.
Ethical Declaration
None.
Declaration of Generative AI IN Scholarly Writing
AI tools were used only for minor grammar checking and language refinement. All methodological development, analysis, and technical content were entirely carried out by the authors without AI assistance.
Acknowledgments
None.
Abbrevation
The following abbreviations are used in this manuscript:
AGKSO - Adaptive Genghis Khan Shark Optimization
DConMRG - Net-Dilated Convolutional Multi-Relational Graph Attention Network
DL - deep learning
FL - IDS-federated learning
GRO - Gold Rush Optimization
HAGKS-GRO - Hybrid Adaptive Genghis Khan Shark Gold Rush Optimization
IDS- Intrusion Detection System
MANETs - Mobile Ad hoc Networks
ML - machine learning
NSL - KDD - Network Security Laboratory Knowledge Discovery
OMCFR - Optimized Maximum Correlation based Feature Reduction
OOA - Osprey Optimization Algorithm
