Visual discrete format: an alternative to Likert-type formats of survey items sensitive enough to measure small changes in stable constructs such as self-concept in science

Author: Daniel Solis, David Hutchinson, Nancy Longnecker
Journal: International Journal of Cognitive Research in Science, Engineering and Education @ijcrsee
Section: Original research
Article in issue: 2 vol.10, 2022.
Free access
A visual discrete format was developed for use in surveys as an alternative to a Likert-type format to measure changes in a relatively stable construct before and after an intervention. Visitors to a science centre ranging in age from 8 years old upwards were asked to complete surveys that included a seven-item questionnaire scale on self-concept in science using either the Likert-type format (n=446) or the visual discrete format (n=375), before and after their visit. A new set of statements to assess self-concept in science were developed and validated so they could be conducted on either format. Matched responses were used to calculate internal consistency, standard deviation, confidence interval and percentage of missing values; these were all similar for both formats. In the visual discrete format, text labels were replaced by visual labels with a single image of different size for each response option. While a Likert-type format describes a level of agreement/disagreement with a specific item, the visual discrete format relates more to choosing the best reflection of the self in relation to that item. The Likert-type format included a set of emoji in its descriptions to appeal to younger participants. The visual discrete questionnaire scale detected a small increase with medium effect size in self-concept in science after the visit to the science centre while the Likert-type questionnaire scale did not detect any change. This suggests the proposed new format can not only be a viable and useful alternative, but potentially more sensitive under certain conditions.
Likert-type scale, visual discrete scale, visual discrete format, self-concept in science, scientific literacy, questionnaire
Short address: https://sciup.org/170198656
IDR: 170198656 | UDC: 001.891:519.252 | DOI: 10.23947/2334-8496-2022-10-2-01-16
Text of the scientific article Visual discrete format: an alternative to Likert-type formats of survey items sensitive enough to measure small changes in stable constructs such as self-concept in science
While learning is traditionally defined in terms of knowledge acquisition ( Illeris, 2018 ), it also comprises changes in understanding, feelings, and attitudes ( Illeris, 2018 ; Krishnamurthi and Rennie, 2012 ), self-related cognitions, interests, expectations, behaviours, and life-skills ( Organisation for Economic Cooperation and Development, 2009 ). Perceived self-identity is a vital factor in whether and how a person engages with new information which can be obtained through many channels in life-long learning ecosystems ( Longnecker, 2016 ).
To measure these constructs, it is often assumed that an honest respondent is enough for an accurate self-report ( Paulhus and Vazire, 2007 ), and questionnaires are a popular method of data collection in informal settings ( Diamond, Horn and Uttal, 2016 ; Fowler, 2013 ; Longnecker, Elliot and Gondwe, 2014 ; National Research Council, 2009 ).
However, questionnaires themselves are not only a method to elicit information, but a source of information that respondents use to determine their answer as well ( Schwarz, 1999 ). Common method

© 2022 by the authors. This article is an open access article distributed under the terms and conditions of the Creative Commons Attribution (CC BY) license .
bias refers to the variance (both random and systematic) attributable to the measurement method, rather than to the construct. It is one of the main sources of measurement error ( Podsakoff et al., 2003 ).
Likert-type formats are almost ubiquitous when surveying personal attitudes, including those about science. Despite how extensively used the Likert-type scales are as a measurement method, they can also be problematic ( McLeod, Pippin and Wong, 2011 ).
This paper describes the development and testing of an alternative visual discrete format for items used in a questionnaire scale. To compare this new visual discrete format to the more familiar Likert-type format, we used both to survey young people’s self-concept in science in a matched questionnaire before and after a visit to a science centre.
Self-concept in science is an important component of scientific literacy ( Wilkins, 2004 ); it is relatively stable ( Bong and Skaalvik, 2003 ; Lee, 1998 ) and may influence career aspirations in science ( Nagengast et al., 2011 ). A more complete discussion on the choice of self-concept as the construct used in this comparison is presented in a later section.
Terminology
Terms related to rating scales are sometimes ambiguous or vaguely defined. For example, ‘scale’ is often linked to both an item and a questionnaire. Table 1 provides definitions of terms as used in this study.
Table 1
Terminology used in this study, as defined by the authors
Term Definition
Item Individual question or statement to elicit information about an attribute.
Item scale Set of ordered response options that represent the level of agreement with an item.
Format The way in which an item scale is arranged and displayed.
Anchor Fixed reference point of a response option on an item scale.
Label Verbal, numerical or visual tag to identify an anchor.
Questionnaire scale Set of items that measure the same underlying construct with the same item scale and format.
Score Sum of responses from all items in a questionnaire scale.
Mean score Average of responses in a questionnaire scale.
Visual Discrete Format as an Alternative to Likert-type FormatsLikert-type Formats
The basic idea in many Likert-type formats is that respondents choose their agreement level with an item or statement from a pool of ordinal options, with response options often ranging from strongly disagree to strongly agree. The Likert-type format has symmetrical disagreement and agreement sides, which may or may not include a neutral mid-point.
Two main differences between Likert-type scales and visual discrete scales are presented below.
Visual Labels Versus Text Labels
One challenge in precision of measurements of attitude with the Likert-type format is that anchors are connected to text labels. Text labels are often recommended as “people respond to the ordinal position of categories as well as to the descriptors” ( Fowler, 2013, p. 89 ). However, the lack of a natural and predefined order in words can make the scale anchors appear non-equidistant to respondents ( Lantz, 2013 ). In other words, respondents may perceive that the interval between Strongly Disagree and Disagree is different from the interval between Disagree and Neither. This was revealed by Munshi ( Munshi, 2014 ), who used a line to allow the user to create their own scale. His analysis showed responses can be clustered, as happens with items used in Likert-type scales. Although such formats can be seen as symmetrical around the neutral point, anchors are not perceived as equally distributed. For instance, the interval from the neutral point to simple agreement seemed to be 25% larger than from simple agreement to strong agreement.
Also, since anchors are connected to text labels, modifying the wording, such as using ‘Somewhat Disagree’ instead of ‘Disagree’, can change the way the item scale is perceived ( Lantz, 2013 ).
The issue of lack of equidistance affects the validity of considering a Likert-type format as an interval format ( Friedman and Amoo, 1999 ), which is crucial assumption to perform parametric statistics
( Field, 2013 ).
It has been proposed that the Likert ‘fast form’, with labels only at the ends, may alleviate the labels issue ( Friborg, Martinussen and Rosenvinge, 2006 ; McLeod, Pippin and Wong, 2011 ). The logic of this approach is that end labels are connected to the fixed 0% and 100% of agreement. However, labels are also language and culture-dependent and may still bias the results, even when placed only at the ends. The more familiar the respondent is with an endpoint’s wording, the more likely they’ll choose that option ( Weijters, Geuens and Baumgartner, 2013 ). For example, ‘Completely agree’ can be more familiar than ‘Strongly agree’ ( Weijters, Geuens and Baumgartner, 2013 ).
Numbered ruler-type scales ( Mellor and Moore, 2013 ), visual analog scales ( van Laerhoven, van der Zaag-Loonen and Derkx, 2004 ), and numeric visual analog scales ( van Laerhoven, van der Zaag- Loonen and Derkx, 2004 ) have been created as alternatives to reduce the equidistance issue in scales using Likert-type formats, but result in less engagement with children ( Mellor and Moore, 2013 ; van Laerhoven, van der Zaag-Loonen and Derkx, 2004 ).
There has been little work done on visual alternatives to Likert-type formats, but Reynolds-Keefer et al. (2009) found no variability in responses of young children when comparing three pictorial Likert-type formats. One used words in capital and small letters (NO, no, yes, YES) and two used emoji sets (traditional smiley faces and sun-smiley faces) varying from angry to happy.
In this research, we created a visual alternative to the Likert-type format. Since familiar images require less cognitive effort to process than their equivalent text stimuli ( Hirschman, 1986 ), the emphasis was transferred from text to visual labels. While a Likert-type format describes a level of agree-ment/ disagreement, the visual discrete format is more about choosing the best reflection of the self in relation to a specific item.
Full Positivity Versus Symmetry
Given that positive integers are easier to understand than zero and negative numbers ( De Cruz, 2006 ), it seems plausible to think that agree responses (analogous to positive integers) are also easier to understand than ‘Neither’ and disagree responses. Not including disagreement responses has been shown to be a more effective method for communicating judgments with young children ( Hall, Hume and Tazzyman, 2016 ). “Usually, researchers will have more reliable, valid, and interpretable data if they avoid the agree-disagree question form” ( Fowler, 2013, p. 91 ).
It is important to note that Likert (1932) developed his format to measure constructs such as attitudes about race relations. A wide range of opinions, from negative to positive attitudes may be expected in controversial constructs. Our format is not intended for use in measuring response to polarizing topics.
Self-concept in Science
Self-concept in science was the construct chosen for measurement and comparison of results using two different formats: visual discrete format and Likert-type format. Self-concept was chosen because it is an important aspect of confidence, is a stable construct, and changes , as influenced by visiting a science centre, have barely been studied.
More specifically, self-concept in science refers to the perception of one’s own ability to do well in science. This self-belief can influence attitudes and behaviour ( Organisation for Economic Cooperation and Development, 2009 ; Wilkins, 2004 ) and is an important component of scientific literacy ( Wilkins, 2004 ). “Most humans, most of the time, tend to act in accordance with the image that they have of themselves [emphasis in original]” ( Miles et al., 1988, p. 25 ). Importantly, self-concept can also influence career aspirations in science ( Nagengast et al., 2011 ; Venville et al., 2013 ).
Although self-concept is heavily influenced by social comparison ( Bong and Skaalvik, 2003 ; Jansen, Schroeders and Lüdtke, 2014 ), it is a fairly stable construct ( Bong and Skaalvik, 2003 ; Jansen, Scherer and Schroeders, 2015 ; Lee, 1998 ). Its importance and its stability make a self-concept construct ideal for comparing scales in a pre-test/post-test design. If changes were large, smaller differences might end up masked by larger changes measured in both scales.
There is little research on the effect of a setting of informal learning on self-concept in science. Most of the relevant research is limited to other related constructs, such as attitudes towards science (Sasson, 2014; §enturk and Ozdemir, 2014), attitudes towards nature and biology topics (Sturm and Bogner, 2010), and self-efficacy in science (Martin et al., 2016; Sasson, 2014).
To our knowledge, only two articles report research about self-concept in science assessed before and after visiting a science centre. A seven-item questionnaire used to measure self-concept in science developed by Kind, Jones, and Barmby (2007) was completed by 932 students (aged 11-14) two weeks before a visit to Lab in a Lorry (a mobile laboratory), and by 668 of those students two weeks after. Not all students who completed the pre-questionnaire visited the laboratory. The mean score of self-concept in science decreased from M=3.4 to 3.2. However, the researchers’ goal was to test the scale, not to measure a pre-post difference, and the questionnaire was not pre-post matched. It is not reported why self-concept decreased, if the difference was significant, nor why some pupils didn’t visit Lab in a Lorry.
The same instrument used by Kind, Jones, and Barmby (2007) for self-concept in science was included by Şentürk and Özdemir (2014) in their six-construct questionnaire to measure attitudes towards science in students 11-14 years old. The number of items used by Şentürk and Özdemir (2014) to measure self-concept in science is not reported, but the original source of the instrument, Kind, Jones, and Barmby (2007) , reports seven.
The questionnaire by Şentürk and Özdemir (2014) was administered before, immediately after, and one week after visiting the Middle East Technical University’s Science Centre (Turkey). The experimental group (N=46) was compared to a control group (N=46) that didn’t visit the science centre and continued with regular activities at their school. Self-concept was reported as minimally changing in the control group. While scores after the visit (M=29.07) and one week after (M=27.93) are reported numerically, the value before the visit appears only plotted (along with the other two values). Graphical interpolation allowed us to calculate M≈25.2 before the visit. Transforming scores into mean scores for ease of comparability (mean scores do not depend on the number of items, scores do), it is possible to see how the experimental group increased from a mean score of approximately 3.6 before the visit to 4.2 immediately after the visit, decreasing afterwards to a still significantly higher 4.0 one week later.
Materials and Methods
Instrument Development
Instruments for the Likert-type format and the visual discrete format were developed to compare responses before and after a visit to a science centre. Given that different wording of the same questions can produce different replies ( Stocklmayer and Bryant, 2012 ), and visitors included children and adults alike (more on this in the Data collection section below), it was decided to use the same survey for children and adults. The items are described further below. The images used in the labels (Figure 1b) were especially designed to appeal to younger visitors. The Likert-type format includes familiar text-based labels from ‘Strongly Disagree’ to ‘Strongly Agree’, but it is also accompanied by icons to simplify context and facilitate children’s responses. The visual discrete format only includes one image repeated in each anchor, but with size scaled accordingly to the best reflection of the self it represents.
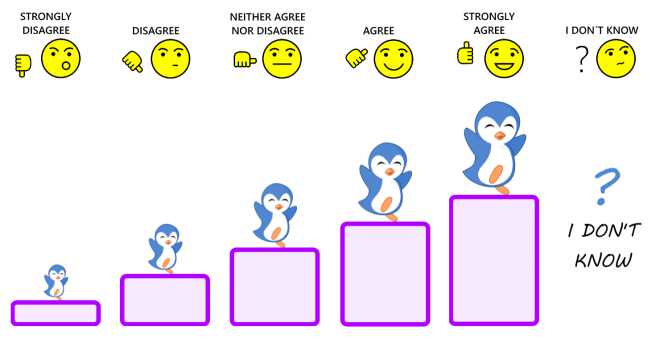
Figure 1. Labels of a) the Likert-type format (top), and b) the visual discrete format (bottom).
Notice that, while the Likert scale was originally designed to measure opinions in polarizing topics through choosing a level of agreement/disagreement, it has been adapted successfully numerous times to fit a wide range of constructs. It is now common to find Likert-type scales not using the traditional agree/disagree format and measuring constructs from brand positioning to self-evaluations. The visual discrete scale was created to determine self-concept in science in visitors to museums, but it can be easily adapted to fit other settings and measurements. While the image size represents the respondent’s visualization of himself/herself regarding science, it is so because the construct measured is self-concept in science. In a broader perspective, the image size relates to a level of agreement.
Visual Labels in the Likert-type Scale
Children process information more slowly than adults and need clearer instructions ( National Research Council, 2009 ). Pictorially augmenting Likert-type scales with smiley faces ( Hall, Hume and Tazzyman, 2016 ) is popular among teachers ( Reynolds-Keefer et al., 2009 ), as this helps children interpret the scale ( Hall, Hume and Tazzyman, 2016 ; Reynolds-Keefer et al., 2009 ). Stange et al. (2018) used eye-tracking to discover that respondents to questions with smiley faces spent less time processing the questions and response options than those answering the version with text-only responses. They also found evidence of respondents with lower literacy relying more on smiley faces than those with higher literacy.
Emoji were used in the Likert-type scale to help younger respondents. However, the selection of smiley faces cannot be arbitrary. While typical sets of emoji range from sad/angry to happy/fun faces, these emoji cannot be applied to all constructs. Sad and angry faces were created to convey sadness and anger, not disagreement. Children hoping to have an enjoyable experience may tend to select only positive ratings ( Hall, Hume and Tazzyman, 2016 ), i.e., the rejection of choosing ‘disagreement’ may actually be the rejection of sadness or anger. To avoid the sad/anger bias, we designed a new set of emoji to better express disa-greement (Figure 1a).
Labels in the Visual Discrete Format
By removing text from labels, text-based bias might be eliminated from the measurement, but image features may influence the sentiment as well ( Siersdorfer et al., 2010 ). Several characteristics of the visuals were considered, including visual attraction, as ‘cuteness’ can be especially important in modern digital culture ( Wittkower, 2012 ).
Unlike other scales where accompanying icons are different for each response option, the visual discrete format uses only one image on all of the visual labels, minimizing the possible bias of one image being more enticing than other. The image was chosen to be a penguin standing on a step. To make the difference among them clear, the size of the penguin and the height (but not the width) of the step, vary proportionally to the level of agreement.
As there is no response that represents a zero or negative value, all of the options in the visual discrete format are positive, minimizing the possible negative versus positive agreement bias. A midpoint is still available (level three), but it’s no longer a ‘Neither’. For the ‘I Don’t Know’ response, the penguin on a step is replaced by a question mark with the ‘I Don’t Know’ text; it is placed at the far-right end.
A New Questionnaire Scale to Measure Self-concept in Science
The Trends in International Mathematics and Science Study (TIMSS) includes a number of questionnaire scales on science and mathematics ( International Association for the Evaluation of Educational Achievement, 2018 ). One of those, a six-item questionnaire scale, measures self-concept in science. However, as a questionnaire scale, it was not suitable for our purposes; for example, the item ‘Science is harder for me than for many of my classmates’ is focused on formal education. There are few questionnaire scales on self-concept in science available, and self-concept is a construct that may be mis-interpreted. Take for instance Kind, Jones and Barmby, (2007) , who include ‘I get good marks in Science’ as one of the items to measure self-concept in science, when that item is not related to a self-belief, but to facts printed on a report card.
It was decided to develop a full questionnaire scale designed for informal learning. It was designed to be as clear as possible to younger respondents, and items were carefully considered so that each one had an equivalent between the Likert-type scale and the visual discrete scale (Table 2).
Table 2
Items to assess self-concept in science are paired between the Likert-type format (left) and the visual discrete format (right).
Likert-type scale (LS) Visual discrete scale (VDS)
"Select the one option for each statement that best "Click on the penguin that best represents yourself in..."
shows what you think"
LS7 is a focal point of the TIMSS scale, as it was used in its earlier studies to measure selfconcept in science with a single question (see International Association for the Evaluation of Educational Achievement, 1998 ). It is the only statement kept verbatim (in the Likert-type item) from TIMSS in our scale.
Reliability, Validity and Trustworthiness
In order to produce robust results and to strengthen confidence, an instrument must be reliable, valid, and trustworthy.
The visual discrete format was piloted in a previous survey (in the same science centre and target population). It consisted of a single item (‘Click on the bunny that best represents yourself in science understanding’) with an image of a bunny rabbit. The images were accompanied by the legends: ‘Brand new’, ‘Beginner’, ‘Capable’, ‘Skilled’, and ‘Expert’, with no ‘I Don’t Know’ option. The pilot (n=224, Mpre=2.88, Mpost=2.97) showed no concerning patterns or issues. The instrument was then further developed to seven items, each with five ordinal options plus a nominal sixth option (‘I Don’t Know’) and text labels were removed. Items were randomized every time by the survey platform, SurveyGizmo®. The bunny was replaced with a penguin because rabbits may be considered negatively as they are an invasive pest in New Zealand. The instrument and methodology were validated by a panel of seven experts in science communication. Data collection began again and no issues were detected.
Data Collection
This research was approved by the Human Ethics Committee of the University of Otago (17/062) and by the Māori Research Advisor of the University of Otago, the Ngāi Tahu Research Consultation Committee (5697_19577). All data were collected by the first author. Participants were informed about the project and signed a written consent form to participate. When participants were children, a second consent form was signed by parents/guardians. All data collected were anonymized and were only categorized by sex/gender and age. These are well-accepted moderating variables. A sex/gender gap in self-concept in science has been reported before, making this variable an important one to study. Knowledge and mental maturity can influence self-concept in science. As both are age-dependent, es-pecially in young people, age was also an important variable.
Sex/gender categories were three: male, female and other. Data of the latter were minimal, and no statistical tests were performed under this category. Age categories were four: Children (8 to 12 years old), Adolescents (13 to 18), Young Adults (19 to 40), and Mature Adults (41+). The category Children was defined based on Piaget’s theory of cognitive development as those in the concrete operational stage. The category Adolescents is described as the age range where people transit from childhood to adulthood. The adult groups are based on generational cohorts. The category Young Adults comprises mainly Millenials, people who are technologically savvy and grew up with personal computers, the internet and social networking. The category Mature Adults contains mainly Baby Boomers and Generation Xers, most of whom can be tech-savvy, but are not digital natives.
For the visual assessment of age and sex/gender of general visitors, the first author trained himself during a trial period. He assessed sex/gender and age category of participants and later compared these data with the reported demographics in the survey. Once the assessment was fairly coinciding with the reported demographics, the actual data collection started. Visually assessing sex/gender and age is quick and unobtrusive, but asking visitors to sign a consent form would be disruptive and inappropriate. The ethics committees mentioned above approved dismissing a consent form in this case. These data were needed because survey demographics are not the demographics of the whole population, and they are needed for comparative reasons.
Pre-test/Post-test Design
A pre-test/post-test design ( Creswell, 2009 ; Friedman, 2008 ; Hernández, Fernández and Baptista, 2014 ) was used to assess changes in visitors’ self-concept in science. The focus reported here compares the performance of a new self-reporting method (the visual discrete format) to a Likert-type format in the case of a stable construct. This study was part of a larger research project ( Solis, 2020 ), and the effect of visiting a science centre in learning is discussed in Solis, Hutchinson and Longnecker (2021) .
Study Context: the Science Centre
The Otago Museum is an institution where nature, science and culture meet. It is located in the city of Dunedin, New Zealand. The importance of this museum to its community is reflected in its 150 years of history and a visitorship of about 350,000 annually ( Otago Museum, 2019 ). The original Otago Museum’s science centre, Discovery World, closed in 2017 for a full renovation. A larger and redeveloped science centre, Tūhura, opened later in 2017. Tūhura received more than 66,000 visits in its first financial year ( Otago Museum, 2019 ).
Sampling Method iPad tablets were used to collect data from visitors 8 years and older before and after their visit to the science centre. Using iPads instead of pencil and paper has advantages, such as being technologically attractive to respondents, allowing for randomization of question order and presentation in a visually uncluttered manner. Instead of crossing or circling a response, tapping with the finger on the response is enough to select it.
All visitors 8 years and older were asked to complete the survey, provided that at least two iPads were available, and there were enough caretakers in the group to look after younger children. A small token (a glow-in-the-dark figure or a fridge magnet in the shape of a butterfly) was given to participants after completing the post-survey. Data with the Likert-type format were collected from May to August 2018, and data with the visual discrete format from July to September 2018.
Respondent demographic data were collected in both surveys. To compare these to the general visitor population demographics and determine if respondents were representative of visitors, demographics of all visitors (both respondents and non-respondents) were visually assessed (Table 3). One third of the general visitor population is under eight years old. Since this demographic is not surveyable, many of their adult guardians were not surveyed either. As a result, fewer 19 to 40 years old visitors were surveyed, and the Children and Adolescents demographics increased their presence. The respondent demographics are different from that of the general population, but far from being an issue, having group sizes more evenly distributed produce more precise estimates of each age stratum in a non-homogeneous population ( Etikan and Bala, 2017 ). In other words, having similar group sizes allows for each group to have enough data for statistical analysis, while if they had resembled the general population distribution, the Young Adults group would have ended with a big sample size and the Adolescents group would have been too small for any analysis.
Table 3
Demographics (%) of all visitors (visually assessed, VA), Likert-type scale (LS) respondents and visual discrete scale (VDS) respondents. Gender is based on N=3301 for all visitors (VA), N=442 for Likert-type scale (LS) and N=372 for visual discrete scale (VDS). Gender in toddlers under two years old was not visually assessed. Age distribution is based on N=3493 for all visitors, N=441 for LS and N=369 for VDS. To compare the demographics of survey respondents with visitors visually assessed, the value in brackets in VA is the equivalent percentage if children <8 years old were not considered.
|
Females |
Males |
<2 |
2-7 |
8-12 |
13-18 |
19-40 |
41 + |
|
|
VA |
56 |
44 |
6 |
26 |
12 (18) |
8(12} |
30 (44) |
18(26) |
|
LS |
sg |
40 |
- |
- |
24 |
18 |
34 |
25 |
|
VDS |
59 |
41 |
- |
- |
26 |
21 |
32 |
21 |
In terms of the comparability between scales, what is more important is that both samples are similarly distributed, supporting the assumption that both were drawn from the same population (Table 3).
Since visitors typically didn’t come individually, but in groups, response rate was calculated by dividing the number of groups that were asked by the number of groups that accepted. Acceptance rate was 76% for surveys containing the Likert-type scale and 80% for surveys with the visual discrete scale.
Data Analysis
Statistical analyses (such as paired t-tests) were conducted using SPSS™ v25. Descriptive statistics (such as means) were obtained from SPSS™ v25 and plotted in Microsoft Excel™ 365.
Five pre-processing steps were taken in order to work only with reliable data. The first four consisted in removing unreliable responses. For example, if three or more answers in a scale were missing, either in the pre- or post-survey, the whole pre/post response was deleted. As a result, 18 responses were eliminated from the Likert scale and 11 from the visual discrete scale. If two or fewer answers in each 7-item set (pre or post) were missing, values were imputed in the last step using Expectation Maximization with SPSS™ v25 (pre and post separately). Missing data were missing at random (MAR). The maximum difference between Cronbach’s alpha before and after missing values imputation in any set was 0.001.
For ease of interpretation, after deleting invalid responses and imputing missing values, scores were converted to mean scores by dividing the scores by the number of items (seven).
Before calculating reliability through Cronbach’s alpha, each of the questionnaire scales (pre and post separately) were tested for unidimensionality using factor analysis by principal components. The minimum variance explained by a single factor in any of the questionnaire scales was 63%. In validation of the use of factor analysis, the minimum Kaiser-Meyer Olkin was .911 and the highest p-value of the Bartlett’s test was below .001. Unidimensionality can clearly be seen in the scree plot of Figure 2.
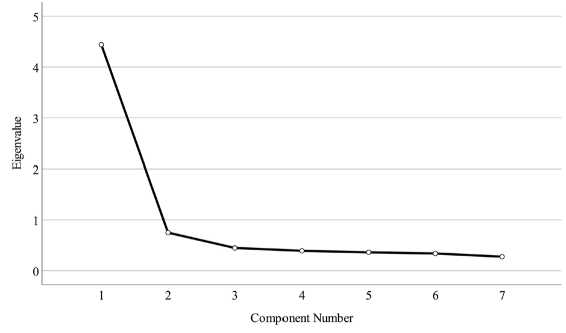
Figure 2. Scree plot of the questionnaire scale using the visual discrete scale (pre). The number of components with eigenvalue over 1 is the number of dimensions (underlying constructs) in the scale.
Results and Discussion
A Small but Significant Difference
Both Likert-type and visual discrete questionnaire scales had similar internal consistency, standard deviation, confidence interval and percentage of missing values (Table 4). An anticipated limitation of the visual discrete format was that it might be more difficult for respondents to understand. Since “missing values seem to occur because the scales are complex, not self-explanatory, and patients are unfamiliar with these tools” ( Phan et al., 2012, p. 506 ), a greater number of missing values in responses to the questionnaire scale with the visual discrete format compared to the one with the Likert-type format would be evidence of perceived complexity. However, there was no difference between the scales in eliminated responses due to missing values.
Table 4
Comparison of pre-post parameters between the Likert scale (LS, N=446) and the visual discrete scale (VDS, N=375). M stands for mean, SD for Standard Deviation, CI for Confidence Interval at 95%, α for Cronbach’s alpha, Elim for percentage of eliminated responses due to an excess of missing values, Skew for skewness, Kurt for kurtosis, d for Cohen’s d, dCI for confidence interval of d.
|
M |
SD |
Cl |
a |
Elim |
Skew |
Kurt |
t-test |
d |
||
|
Pre |
3.69 |
0.81 |
0.08 |
.890 |
-0.520 |
0.165 |
t(445)=1.55; |
d =0.073, |
||
|
LS |
4% |
|||||||||
|
Post |
3.73 |
0.81 |
0.08 |
.919 |
-0.566 |
0.298 |
p=. 123 |
dci=0.067 |
||
|
Pre |
3.46 |
0.84 |
0.08 |
.898 |
-0.346 |
-0.129 |
t(374)=8.33, |
d =0.430, |
||
|
VDS |
3% |
|||||||||
|
Post |
3.66 |
0.79 |
0.08 |
.913 |
-0.468 |
0.031 |
p<.001 |
dci=0.074 |
||
Self-concept in science, both before and after the visit, was not correlated with age (LS: N=441, rs=.016, p=.745; VDS: N=380, rs=-.049, p=.346) or after it (LS: N=441, rs=-.080, p=.094; VDS: N=380, rs=-.013, p=.804).
The Likert-type scale didn’t pick up any changes comparing scores before and after visiting a science centre. This result differs from two studies where self-concept was reported to be significantly influenced by visiting a science centre, either to increase ( Şentürk and Özdemir, 2014 ) or to decrease ( Kind, Jones and Barmby, 2007 ). However, our findings are consistent with the more widely accepted characteristic of self-concept being a fairly stable construct ( Bong and Skaalvik, 2003 ; Jansen, Scherer and Schroeders, 2015 ; Lee, 1998 ) where detecting changes would be particularly challenging.
The new visual discrete scale was able to statistically detect a small increase in visitor’s selfconcept in science after a visit to the science centre, with a medium effect size (Figure 3). The difference in the results of the two instruments is discussed in sections below.
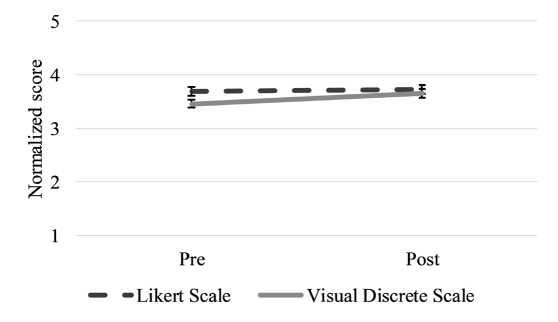
Figure 3. Means of self-concept in science before (Pre) and after (Post) the visit (NLikert scale=446, Nvisual discrete scale=375).
One-size-fits-all Behaviour
Figure 4 shows how mean scores of self-concept in science changed from before a visit to the science centre to after the visit. The difference is presented as percentage, centred around the mean score with value 4 (mean score 4, MS4).
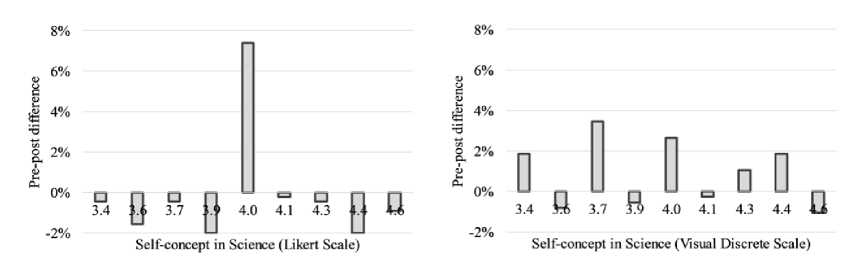
Figure 4. Pre-post changes around M=4.0 in self-concept in science. Percentage changes in the mean scores of self-concept in science from before (pre) to after (post) a visit to the Tūhura science centre around mean score 4: a) Likert-type scale (left), N=446, b) visual discrete scale (right), N=375.
Among these mean scores, there are cases where all responses in the questionnaire scale were 4 (i.e., all responses were ‘Agree’, termed ‘monotone responses’ here). These monotone responses with repeated value of 4 (monotone response 4, MR4) deserve closer attention, as they are related to a phenomenon that cannot be seen from summarized results.
When self-concept was measured with the Likert-type scale, MS4 represented 9% of the mean scores before the visit, from which 5% were MR4. Post-visit responses increased to 16% MS4 and 13% MR4. In other words, non-monotone responses 4 behaved as expected, staying stable (from 4% to 3%), but MR4 more than doubled, from 5% to 13%, representing most of MS4 after the visit. We call this a ‘one-size-fits-all behaviour’ and propose explanations below.
The one-size-fits-all behaviour is clearly smaller in the visual discrete scale. MS4 increased from 7% before to 10% after the visit, and MR4 went from 4% to 8%.
Sponge Effect
The peak in the mean score 3.7 of the visual discrete scale (Figure 4b) cannot be obtained from monotone responses, indicating that an increase in this mean score may be due to something different. Figure 4a shows that, as the monotone responses 4 in the Likert-type scale increased, other mean scores around it decreased. We call this a ‘sponge effect’ because the increase of 3.7 corresponds with decreases in neighbouring mean scores.
Possible Explanations of the One-size-fits-all Behaviour and Sponge Effect
We did not find any mention in the literature about the changed behaviour of answering with a range of options before an intervention, and then answering with a single option for each item in the whole questionnaire scale after an intervention (one-size-fits-all behaviour). The closest cases are a brief mention on choosing a particular column in multiple-choice tests of academic mastery as a peculiar bias ( Osborne and Blanchard, 2011 ), and a discussion on a ceiling effect caused by children rating their mood as highly positive before an intervention when they expect it to be enjoyable ( Hall, Hume and Tazzyman, 2016 ).
Several factors may contribute to the phenomenon. According to the ‘classical test theory’, every measurement (observed score) for a person is a composite of a true score and an error score. Measurements can differ under different conditions and the scores cannot be observed independently ( Brennan and Lee, 2018 ).
In addition, a respondent who experiences overwhelming stimuli may issue a quick, self-reported response to get on with the task ( Paulhus and Vazire, 2007 ). This may have happened in the case of our participants’ visit to the stimulating environment of an interactive science centre.
It is also important to consider that respondent’s confidence is based on the ease with which potential answers come to mind ( Kelley and Lindsay, 1993 ). The ‘testing effect’ postulates that respondents to multiple-choice questions generally improve performance on a later test due to memory ( Kromann et al., 2010 ).
Some respondents may have realized that the questions in the scale were closely related. When filling out the post-survey, they could have remembered that and, to avoid more mental exertion after the visit, they answered them with the one answer that best represented their overall thinking. For instance, 3,4,4,4,4,3,4 and 4,4,4,4,5,4,4 before the visit would both become 4,4,4,4,4,4,4 after the visit. If so, they were not trying to avoid giving thoughtful answers, only to minimize the cognitive workload. This behaviour is likely to be unconscious. This reasoning would explain not only the one-size-fits-all behaviour, but also the sponge effect. To sustain this hypothesis, open questions of respondents with one-size-fits-all be-haviour were examined individually; no skipping behaviour was found, supporting the premise of thoughtful respondents.
One clue as to why these phenomena happened in the Likert-type scale, but not in the visual discrete scale, is that using the same format for all constructs in a questionnaire can produce method bias ( Podsakoff et al., 2003 ) because repetitiveness of items on a questionnaire may decrease a respondent’s motivation ( MacKenzie and Podsakoff, 2012 ). If people have become habituated to Likert-type scales, it may be that they find the format familiar enough to be confident that all the questions can be answered with a single option. Since the visual discrete format is new, visitors may have felt more inclined to read all the items again due to unfamiliarity.
Lastly, cute products can make consumers more indulgent in consumption choices ( Nenkov and Scott, 2014 ). In this case, visitors didn’t spend money, but the cuteness of the penguin in the visual discrete format could have made them more indulgent in spending their time, which could translate into reading the items carefully before and after the visit.
The one-size-fits-all behaviour and the sponge effect phenomena may have not been reported before in the literature because, in order to detect them, the construct being measured needs to be extremely stable, as the phenomenon’s effect is very small. When measuring other constructs, the effect could have easily passed unnoticed.
Description of the Level of Agreement
A fast way to inspect results from five-point Likert-type responses is to report the combined percentage of respondents who ‘Agree’ or ‘Strongly agree’ with the item. A similar interpretation can be obtained with the visual discrete format by considering steps four and five as equivalent to agreement and strong agreement.
Comparability Between the Likert-type Format and the Visual Discrete Format
The Likert-type format was created to register approval and disapproval. Adaptations popularized alternatives for what to measure, such as the level of agreement and disagreement, but have kept the format symmetrical. While Likert-type formats have up to three choices of agreement (disagreement or negative side, agreement or positive side and, if present, neutral), the visual discrete scale is only positive. The absence of symmetry and text-based labels may help diminish the problem of anchors being perceived as unequally distributed (see Munshi, 2014 ; Worcester and Burns, 1975 ). Notwithstanding, the modification might lead someone to incorrectly think the new format is not comparable to the Likert-type format. An explanation of why they are analogous follows.
First, as both formats have the same use, they can be compared. If someone uses a nutcracker and a hammer to crack nuts, it doesn’t matter how different they are, they can be compared in their capability to crack nuts. Likert-type scales have been widely used to measure attitudes about science in science centres (where attitudes of visitors are expected to be more positive than negative). We claim the visual discrete format is an alternative to it, without claiming equivalence of the visual discrete scale and Likert-type scales in polarizing topics.
Something to study further is whether these scales are comparable in a whole range of options or only on the positive side. The visual discrete scale could be more sensitive in capturing positive opinions due to having five levels of agreement versus the only two the Likert-type scale has (‘Agree’ and ‘Strongly Agree’). However, respondents that require the negative side or the neutral point in the Likert-type scale wouldn’t have an option to choose from in the visual discrete scale. Since respondents would not find the option they are looking for in this scenario, one red flag would be a clear increment in missing values (skipped items or selections of ‘I Don’t Know’ responses). However, there was no increase in eliminated responses due to missing values (Table 4).
The other possibility would be an increase in selections of the far-left option (as it would be the closest option to neutral and negative). Figure 5 provides a visualization of what this other possibility would produce. The upper section of the figure shows the expected distribution of Likert-type responses con-sidering most science centre visitors have an optimistic opinion about their self-concept in science (mean and median fall on the positive zone on the Likert-type format). If the negative zone and the neutral point did not have an equivalent in the visual discrete scale, and considering ‘I Don’t Know’ is not selected more frequently, these responses would accumulate in the far-left option, which would be the closest one to their neutral/disagreement opinion. In other words, the Likert-type scale respondents who chose
‘disagree’ options would choose the smaller penguin/step (number 1) in the visual discrete scale. The expected distribution of this case is shown in the lower section of the figure. Visually, that would be seen as a peak on the left-most option and the positive zone would span from two options (A and SA) to five (1 to 5). An easy to detect outcome of the expansion would be a shift in mean and median to the left.
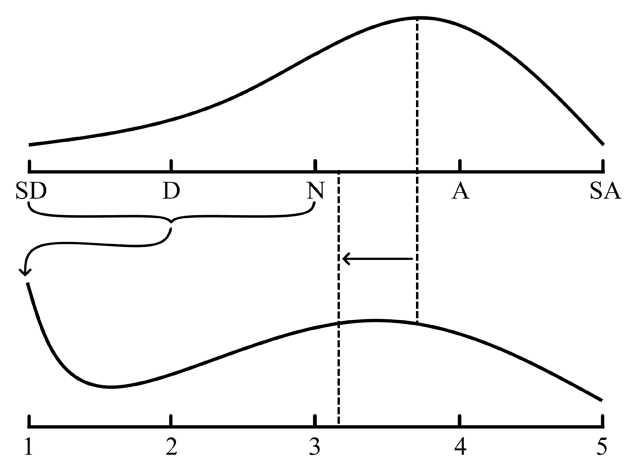
Figure 5. Simulation of what the visual discrete scale would look like if it were the expansion of the positive side of the Likert-type scale. The bracket signals the condensation of the negative and neutral options. The outcome would be a peak in the far-left VDS option and a shift of the mean (dashed lines).
Figure 6 shows actual scores from the post Likert-type questionnaire scale in this study and how these same scores would look like if they came from a visual discrete questionnaire scale behaving as explained above. It also includes the actual scores of the post visual discrete questionnaire scale. It is clear that the actual shape of the visual discrete questionnaire scale is a lot more like the Likert-type shape, and not like the hypothetical shape.
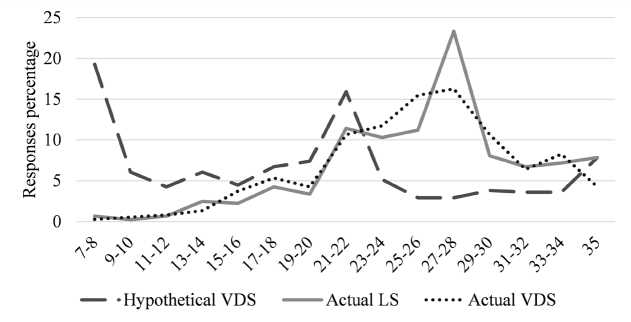
Figure 6. Comparison of actual score distributions of the post Likert-type scale (LS) and the post visual discrete scale (VDS) with hypothetical VDS if it were the expansion of the positive side of the Likert-type scale.
According to the above, both scales can be compared, and they produce similar results, supporting our claim that the visual discrete scale may be equivalent the Likert-type scale, and more sensitive, at least for stable constructs with a tendency for positive responses.
Limitations and Future Work
The first limitation of these findings is that the visual discrete format cannot be applied to all situations. It was designed as an alternative to Likert-type formats, but for when respondents assess themselves regarding a non-controversial construct. A Likert-type format may be expected to outperform the visual discrete format when measuring polarizing topics, such as climate change, but further investigation is needed.
Another limitation to this and other studies is that pre-testing poses a risk of sensitizing and ‘cueing’ the user, affecting the outcomes ( Friedman, 2008 ). However, there is no direct replacement, and matching pre and post responses is a widely-used experimental design that allows for changes to be detected in the same population ( Creswell, 2009 ; Friedman, 2008 ; Hernandez, Fernandez and Baptista, 2014 ).
The one-size-fits-all behaviour and sponge effect deserve closer examination to determine what conditions produce them, how common they are and how strong their effect can be. The main characteristic of the visual discrete format may be its own limitation. Eliminating labels has the advantage of eliminating label-related issues, but the total absence of text labels can be cognitively more complex for respondents who are used to being given text-based instructions ( Friborg, Martinussen and Rosenvinge, 2006 ). Children especially require clear instructions ( National Research Council, 2009 ), tending to respond better to scales where each point is labelled ( Borgers, Hox and Sikkel, 2003 ). Children from the age of 11 have significantly improved capacity to handle complex questionnaires ( Scott, Bryninand Smith, 1995 ), but the visual discrete scale may have been more difficult for the younger children in this study; perhaps no issue was detected due to parental assistance. Further study with young respondents is advisable.
The Likert-type scale used in this study contained a new set of emoji that has not yet been independently tested. We posit that this set of emoji outperforms the sad/angry-to-happy/fun sets. Testing the performance of the new set was beyond the scope of the current research project. This needs to be tested more broadly. We hope that other researchers will find value in this format and test it in different contexts.
Conclusions
Going fully visual and positive in questionnaire instruments have not been widely studied. Making images vary in size proportionally to the level of agreement instead of changing the corresponding image is, to our best knowledge, new.
The visual discrete scale is sensitive enough to measure small changes in stable constructs, such as self-concept in science. It is expected that it will perform satisfactorily in measuring constructs related to the self that are influenced more rapidly, such as self-efficacy or scientific fluency. It is also expected that adaptations of the visual discrete scale can reliably measure opinions about science when the topic is not polarizing.
Since variation of scale properties is an effective remedy for controlling method bias ( Podsakoff, MacKenzie and Podsakoff, 2012 ), the visual discrete format is a promising alternative to Likert-type formats. It is not necessarily a replacement, but potentially a suitable alternative.
Acknowledgements
This work was supported by the Instituto Politécnico Nacional under Grants Licencia con Goce de Sueldo CPE/COTEBAL/105/2016, CPE/COTEBAL/100/2017, CPE/COTEBAL/71/2018 and CPE/ COTEBAL/67/2019; the University of Otago’s Doctoral Scholarship; and the Dodd–Walls–Centre for Photonic and Quantum Technologies.
Conflict of interests
We declare that Professor Hutchinson has been a member of Otago Museum’s Trust Board since 2008 and was Chairman of the Board during the research. Professor Longnecker joined the Otago Museum’s Board in 2019, after this study was conducted. The Otago Museum granted freedom to collect data, but there is no conflict of interest as there was no financial support from the Otago Museum, nor influences on the outcome of the study.
References Visual discrete format: an alternative to Likert-type formats of survey items sensitive enough to measure small changes in stable constructs such as self-concept in science
- Bong, M., & Skaalvik, E. M. (2003). Academic self-concept and self-efficacy: How different are they really? Educational psychology review, 15(1), 1-40. https://doi.org/10.1023/A:1021302408382
- Borgers, N., Hox, J., & Sikkel, D. (2003). Response quality in survey research with children and adolescents: the effect of labeled response options and vague quantifiers. International Journal of Public Opinion Research, 15(1), 83-94. https:// doi.org/10.1093/ijpor/15.1.83
- Brennan, R. L., & Lee, W.-C. (2018). True Score. In B. B. Frey (Ed.), The SAGE Encyclopedia of Educational Research, Measurement, and Evaluation (pp. 1724-1728). Thousand Oaks, CA: SAGE Publications. https://dx.doi. org/10.4135/9781506326139
- Creswell, J. W. (2009). Research Design: Qualitative, Quantitative, and Mixed Methods Ap-proaches. Thousand Oaks, CA: SAGE Publications.
- De Cruz, H. (2006). Why are some numerical concepts more successful than others? An evolu-tionary perspective on the history of number concepts. Evolution and Human Behavior, 27(4), 306-323. https://doi.org/10.1016/j. evolhumbehav.2006.02.001
- Diamond, J., Horn, M., & Uttal, D. H. (2016). Practical evaluation guide: Tools for museums and other informal educational settings. Lanham, MD: Rowman & Littlefield.
- Etikan, I., & Bala, K. (2017). Sampling and sampling methods. Biometrics & Biostatistics International Journal, 5(6), 00149. https://doi.org/10.15406/bbij.2017.05.00149
- Fenichel, M., & Schweingruber, H. (2010). Surrounded by Science: Learning science in informal environments. Washington, DC: The National Academies Press. https://doi.org/10.17226/12614
- Field, A. (2013). Discovering Statistics Using IBM SPSS Statistics. Los Angeles, CA: SAGE Publications.
- Fowler, F. J., Jr. (2013). Survey research methods (5th ed.) Los Angeles, CA: SAGE Publications.
- Friborg, O., Martinussen, M., & Rosenvinge, J. H. (2006). Likert-based vs. semantic differen-tial-based scorings of positive psychological constructs: A psychometric comparison of two versions of a scale measuring resilience. Personality and Individual Differences, 40(5), 873-884. https://doi.org/10.1016/j.paid.2005.08.015
- Friedman, A. J. (Ed.) (2008). Framework for Evaluating Impacts of Informal Science Education Projects. National Science Foundation. Retrieved from https://www.informalscience.org/framework-evaluating-impacts-informal-science-education-projects
- Friedman, H. H., & Amoo, T. (1999). Rating the rating scales. Journal of Marketing Management, 9(3), 114-123. Retrieved from https://ssrn.com/abstract=2333648
- Hall, L., Hume, C., & Tazzyman, S. (2016). Five degrees of happiness: Effective smiley face likert scales for evaluating with children. Paper presented at the Proceedings of the The 15th International Conference on Interaction Design and Children, New York, NY. https://doi.org/10.1145/2930674.2930719
- Hernández, S., Fernández, C., & Baptista, P. (2014). Metodología de la Investigación [Investigation Methodology] (6th ed.). Mexico City, Mexico: McGraw-Hill.
- Hirschman, E. C. (1986). The effect of verbal and pictorial advertising stimuli on aesthetic, utilitarian and familiarity perceptions. Journal of Advertising, 15(2), 27-34. https://doi.org/10.1080/00913367.1986.10673002
- Illeris, K. (2018). Contemporary theories of learning: learning theorists... in their own words. London, UK: Routledge. https:// doi.org/10.4324/9781315147277
- International Association for the Evaluation of Educational Achievement. (1998). IEA Third International Mathematics and Science Study - Repeat: Student questionnaire main survey. Retrieved from https://timssandpirls.bc.edu/timss1999i/ pdf/BM2_StudentG.pdf
- International Association for the Evaluation of Educational Achievement. (2018). IEA Trends in International Mathematics and Science Study 2003: Main survey student questionnaire grade 4. Retrieved from https://nces.ed.gov/timss/pdf/T19_ GR4_StudentQ_USA_Questionnaire.pdf
- Jansen, M., Scherer, R., & Schroeders, U. (2015). Students’ self-concept and self-efficacy in the sciences: Differential relations to antecedents and educational outcomes. Contemporary Educational Psychology, 41, 13-24. https://doi.org/10.1016/j. cedpsych.2014.11.002
- Jansen, M., Schroeders, U., & Lüdtke, O. (2014). Academic self-concept in science: Multidimen-sionality, relations to achievement measures, and gender differences. Learning and Individual Differences, 30, 11-21. https://doi. org/10.1016/j.lindif.2013.12.003
- Kelley, C. M., & Lindsay, D. S. (1993). Remembering mistaken for knowing: Ease of retrieval as a basis for confidence in answers to general knowledge questions. Journal of Memory and Language, 32(1), 1-24. https://doi.org/10.1006/ jmla.1993.1001
- Kind, P., Jones, K., & Barmby, P. (2007). Developing attitudes towards science measures. International Journal of Science Education, 29(7), 871-893. https://doi.org/10.1080/09500690600909091
- Krishnamurthi, A., & Rennie, L. J. (2012). Informal science learning and education: definition and goals. Retrieved from https:// resources.informalscience.org/informal-science-learning-and-education-definition-and-goals
- Kromann, C., Bohnstedt, C., Jensen, M., & Ringsted, C. (2010). The testing effect on skills learning might last 6 months. Advances in Health Sciences Education, 15(3), 395-401. https://doi.org/10.1007/s10459-009-9207-x
- Lantz, B. (2013). Equidistance of Likert-type scales and validation of inferential methods using experiments and simulations. The Electronic Journal of Business Research Methods, 11(1), 16-28. Retrieved from https://academic-publishing.org/ index.php/ejbrm/article/view/1299/1262
- Lee, J. D. (1998). Which kids can “become” scientists? Effects of gender, self-concepts, and perceptions of scientists. Social psychology quarterly, 61(3), 199-219. https://doi.org/10.2307/2787108
- Likert, R. (1932). A technique for the measurement of attitudes. Archives de Psychologie [Archives of Psychology](140), 1-55.
- Longnecker, N. (2016). An integrated model of science communication. Journal of Science Communication, 15, 1-12. https:// doi.org/10.22323/2.15050401
- Longnecker, N., Elliot, J., & Gondwe, M. (2014). Inspiring Australia: An evaluation tool for science engagement activities. https://doi.org/10.13140/RG.2.1.3477.9683
- MacKenzie, S. B., & Podsakoff, P. M. (2012). Common method bias in marketing: causes, mechanisms, and procedural remedies. Journal of retailing, 88(4), 542-555. https://doi.org/10.1016/j.jretai.2012.08.001
- Martin, A. J., Durksen, T. L., Williamson, D., Kiss, J., & Ginns, P. (2016). The role of a muse-umbased science education program in promoting content knowledge and science motivation. Journal of Research in Science Teaching, 53(9), 1364-1384. https://doi.org/10.1002/tea.21332
- McLeod, A., Pippin, S., & Wong, J. A. (2011). Revisiting the Likert scale: can the fast form ap-proach improve survey research? International Journal of Behavioural Accounting and Finance, 2(3-4), 310-327. https://doi.org/10.1504/ IJBAF.2011.045019
- Mellor, D., & Moore, K. A. (2013). The use of Likert scales with children. Journal of pediatric psychology, 39(3), 369-379. https:// doi.org/10.1093/jpepsy/jst079
- Miles, R. S., Alt, M., Gosling, D., Lewis, B., & Tout, A. (Eds.). (1988). The Design of Educational Exhibits (2nd ed.). New York, NY: Routledge. https://doi.org/10.1111/j.2151-6952.1985.tb01634.x
- Munshi, J. (2014). A method for constructing Likert scales. SSRN Electronic Journal, 1-12. http://dx.doi.org/10.2139/ ssrn.2419366
- Nagengast, B., Marsh, H. W., Scalas, L. F., Xu, M. K., Hau, K.-T., & Trautwein, U. (2011). Who took the “×” out of expectancy-value theory? A psychological mystery, a substantive-methodological synergy, and a cross-national generalization. Psychological science, 22(8), 1058-1066. https://doi.org/10.1177/0956797611415540
- National Research Council. (2009). Learning science in informal environments: People, places, and pursuits (Vol. 32). Washington, DC: National Academies Press. https://doi.org/10.17226/12190
- Nenkov, G. Y., & Scott, M. L. (2014). “So cute I could eat it up”: Priming effects of cute products on indulgent consumption. Journal of Consumer Research, 41(2), 326–341. https://doi.org/10.1086/676581
- Organisation for Economic Cooperation and Development. (2009). PISA 2006 Technical Report. https://doi. org/10.1787/9789264048096-en
- Osborne, J. W., & Blanchard, M. R. (2011). Random responding from participants is a threat to the validity of social science research results. Frontiers in Psychology, 1, 220. https://doi.org/10.3389/fpsyg.2010.00220
- Otago Museum. (2019). Annual report 2018-2019. Retrieved from https://otagomuseum.nz/assets/Otago-Museum-Annual- Report-2018-19-low-res-25.11.19.pdf
- Paulhus, D. L., & Vazire, S. (2007). The self-report method. In R. W. Robins, R. C. Fraley, & R. A. Krueger (Eds.), Handbook of research methods in personality psychology (pp. 224-239). New York, NY: Guilford Press.
- Phan, N. Q., Blome, C., Fritz, F., Gerss, J., Reich, A., Ebata, T., . . . Ständer, S. (2012). As-sessment of pruritus intensity: prospective study on validity and reliability of the visual analogue scale, numerical rating scale and verbal rating scale in 471 patients with chronic pruritus. Acta dermato-venereologica, 92(5), 502-507. https://doi.org/10.2340/00015555- 1246
- Podsakoff, P. M., MacKenzie, S. B., Lee, J.-Y., & Podsakoff, N. P. (2003). Common method bi-ases in behavioral research: A critical review of the literature and recommended remedies. Journal of Applied Psychology, 88(5), 879-903. https://doi. org/10.1037/0021-9010.88.5.879
- Podsakoff, P. M., MacKenzie, S. B., & Podsakoff, N. P. (2012). Sources of method bias in social science research and recommendations on how to control it. Annual Review of Psychology, 63, 539-569. https://doi.org/10.1146/annurev-psych-120710-100452
- Reynolds-Keefer, L., Johnson, R., Dickenson, T., & McFadden, L. (2009). Validity issues in the use of pictorial Likert scales. Studies in Learning, Evaluation, Innovation and Development, 6(3), 15-25.
- Sasson, I. (2014). The role of informal science centers in science education: attitudes, skills, and self-efficacy. JOTSE, 4(3), 167-180. https://dx.doi.org/10.3926/jotse.123
- Schwarz, N. (1999). Self-reports: how the questions shape the answers. American Psychologist, 54(2), 93-105. https://doi. org/10.1037/0003-066X.54.2.93
- Scott, J., Brynin, M., & Smith, R. (1995). Interviewing children in the British household panel survey. In I. Stewart & R. Vaitilingam (Eds.), Advances in family research (pp. 259-266). Essex, UK: University of Essex.
- Şentürk, E., & Özdemir, Ö. F. (2014). The effect of science centres on students’ attitudes towards science. International Journal of Science Education, Part B, 4(1), 1-24. https://doi.org/10.1080/21548455.2012.726754
- Siersdorfer, S., Minack, E., Deng, F., & Hare, J. (2010). Analyzing and predicting sentiment of images on the social web. Paper presented at the 18th ACM international conference on multimedia, Firenze, Italy. https://doi. org/10.1145/1873951.1874060
- Solis, D. H. (2020). Exploration and discovery: learning at a science centre. (Doctor of Philosophy), University of Otago, New Zealand. Retrieved from https://ourarchive.otago.ac.nz/handle/10523/10160
- Solis, D. H., Hutchinson, D., & Longnecker, N. (2021). Formal Learning in Informal Settings—Increased Physics Content Knowledge After a Science Centre Visit. Frontiers in Education, 6(322). https://doi.org/10.3389/feduc.2021.698691
- Stange, M., Barry, A., Smyth, J., & Olson, K. (2018). Effects of smiley face scales on visual processing of satisfaction questions in web surveys. Social Science Computer Review, 36(6), 756-766. https://doi.org/10.1177/0894439316674166
- Stocklmayer, S. M., & Bryant, C. (2012). Science and the public—What should people know? International Journal of Science Education, Part B, 2(1), 81-101. https://doi.org/10.1080/09500693.2010.543186
- Sturm, H., & Bogner, F. X. (2010). Learning at workstations in two different environments: A museum and a classroom. Studies in Educational Evaluation, 36(1-2), 14-19. https://doi.org/10.1016/j.stueduc.2010.09.002
- van Laerhoven, H., van der Zaag-Loonen, H., & Derkx, B. H. (2004). A comparison of Likert scale and visual analogue scales as response options in children’s questionnaires. Acta paediatrica, 93(6), 830-835. https://doi. org/10.1111/j.1651-2227.2004.tb03026.x
- Venville, G., Rennie, L. J., Hanbury, C., & Longnecker, N. (2013). Scientists reflect on why they chose to study science. Research in Science Education, 43(6), 2207-2233. https://doi.org/10.1007/s11165-013-9352-3
- Weijters, B., Geuens, M., & Baumgartner, H. (2013). The effect of familiarity with the response category labels on item response to Likert scales. Journal of Consumer Research, 40(2), 368-381. https://doi.org/10.1086/670394
- Wilkins, J. L. (2004). Mathematics and science self-concept: An international investigation. The Journal of Experimental Education, 72(4), 331-346. https://doi.org/10.3200/JEXE.72.4.331-346
- Wittkower, D. E. (2012). On the origins of the cute as a dominant aesthetic category in digital culture. In T. W. Luke & J. Huninger (Eds.), Putting Knowledge to Work and Letting Information Play (pp. 167-175). Rotterdam, The Netherlands: Sense Publishers. https://doi.org/10.1007/978-94-6091-728-8_13
- Worcester, R. M., & Burns, T. R. (1975). Statistical examination of relative precision of verbal scales. Journal of the Market Research Society, 17(3), 181-197.
