X-ray spectral methods for measuring the degree of ordering of carbon nanoparticles

Author: Letenko D.G., Pukharenko Yu.V., Aubakirova I.U.
Journal: Nanotechnologies in Construction: A Scientific Internet-Journal @nanobuild-en
Section: Application of nanomaterials and nanotechnologies in construction
Article in issue: 2 Vol.13, 2021.
Free access
Methods for the quantitative assessment of the content of ordered structures in the products of synthesis of fulleroid materials based on the spectra of characteristic X-ray radiation and X-ray diffraction are considered. The introduction shows that the use of carbon fulleroid materials (fullerenes, fullerenols and their compounds, fulleroid nanoparticles) as modifiers of the properties of various structural materials and plasticizers of concrete mixes is currently one of the most rapidly developing areas in the field of nanotechnology in construction. Methods and materials. In this work, the following analytical control methods were used: scanning microscopy, local X-ray spectral analysis and X-ray diffractometry. The products of synthesis of fulleroid materials were studied: samples of fullerene-containing soot collected at different distances from the arc synthesis zone. Results. Raster images of the synthesis products with various magnifications are shown, as well as the X-ray fluorescence spectra and the elemental composition of the synthesis products. The X-ray phase analysis of the synthesis products was carried out. It is shown that the analysis of the amorphous component of the composition, which is one of the products of the yield, will make it possible to control the synthesis at each stage and under various conditions of its implementation. Analysis of a nonlinear dynamic system. To construct an attractor of a dynamic system, the correlation dimension, the dimension of the phase space and the fractal dimension of the process under study were calculated. The correlation dimension and the dimension of the phase space were calculated using the Takens’ method. The fractal dimension is calculated using the Hurst exponent. Conclusions. To study the dynamics of chemical reactions occurring during arc synthesis, the system of differential Rössler attractor is used. A solution to this system is obtained – Rössler attractor – an attracting set of trajectories in the phase space, which is identical in appearance to the process under study, which makes it possible to estimate, relying on attractors characteristic of each sample (synthesis material), at what stage the synthesis process occurs, and by making differential model, to organize the control to improve the quality of output products. Thus, the possibility of evaluating the efficiency of the synthesis of fulleroids used for the modification of building materials is demonstrated.
Fulleroids, X-ray spectral analysis, diffractometry, attractor, Hurst exponent, phase space, fractal dimension, dynamic system, Rössler model
Short address: https://sciup.org/142226914
IDR: 142226914 | DOI: 10.15828/2075-8545-2021-13-2-52-62
Text of the scientific article X-ray spectral methods for measuring the degree of ordering of carbon nanoparticles
A t present one of the most dynamically developing areas in the field of nanotechnology in construction is the use of carbon fulleroid materials (fullerenes, fullerenols and their compounds, fulleroid nanoparticles) as modifiers of the properties of various building materials and plasticizers of concrete mixes [1–4].
In the production of fulleroid materials by the arch synthesis method [5], the synthesis product is the carbon powder, which mainly consists of the amorphous carbon, represented by a loose globular structure. The useful components of the synthesis product fullerenes and fulleroid nanoparticles have an ordered structure. When solving some material science problems, amorphous carbon is not an interfering component; however, to use
APPLICATION OF NANOMATERIALS AND NANOTECHNOLOGIES IN CONSTRUCTION the mix it is necessary to know the quantitative composition of the amorphous phase exactly [6–8]. In addition, when checking the synthesis process, it is necessary to control the yield of fulleroid materials promptly, which is a complex analytical problem.
During the synthesis of fulleroid materials, dissipative spatial and temporal structures that appear far from the equilibrium form a non-equilibrium order. In chemical dissipative systems, this order includes the manifestation of oscillations and waves of matter density [9].
In the processes of chemical synthesis, the destruction and the emergence of any structures means that fluctuations characteristic of the ongoing chemical reaction has to play the role of “noise” and turn into a factor of creating the ordered reaction products – a dynamic system appears, so the study in the processes of chemical synthesis, the destruction and the emergence of any structures means that fluctuations characteristic of the ongoing chemical reaction cease to play the role of “noise” and turn into a factor of creating ordered reaction products – a dynamic system appears, thus this work is devoted to the study of the properties of the dynamic system.
As the useful components of the synthesis are represented by the particles with an ordered structure located in amorphous carbon globules, it is advisable to apply X-ray structural and local X-ray fluorescence research methods for this study.
METHODS AND MATERIALS
The following analytical control methods were used in this experiment: scanning microscopy, local X-ray spectral analysis, and X-ray diffractometry.
Research of the products of fulleroid materials synthesis was carried out: Sample С1÷С5 – samples of fullerene-containing soot collected at different distances from the arc synthesis zone by the method described in [10].
Several analytical measurements were made using the following devices to define the structures formed during the synthesis:
-
1. The microstructure of the obtained samples was studied by the scanning electron microscope TESCAN VEGA 3SEM (Czech Republic)
-
2. The X-ray fluorescence spectra and the elemental composition of the synthesis products were studied using the X-ray fluorescent attachment PentaFET Precision (Oxford Instruments, GB), and the INCA package, which allows determining the elemental composition of the synthesis products and their mass amount. (CONDITIONS OF MEASUREMENT: HV = 20.000e3, SpecimenCurrent = 681.611721612e-12, SpotSize = 272.683916892e-9) Calculations of the elements concentrations included in the analyzed products were made by the method of fundamental parameters.
-
3. The X-ray phase analysis of the synthesis products was performed using a D2 PHASER diffractometer (Bruker, Germany).
RESULTS
Figure 1 shows raster images of the synthesis products at various magnifications. The scale factor in Figure 1, image a is 60 µm, for images b and c – 5 µm, image a is the general structure of the synthesis products, images b and c are individual globules of amorphous carbon and carbon nanotubes.
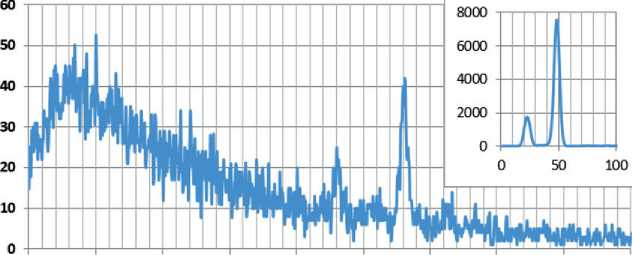
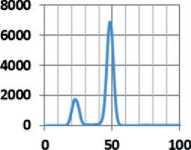
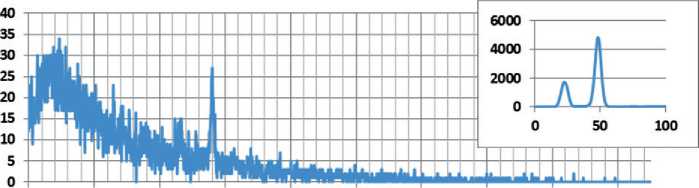
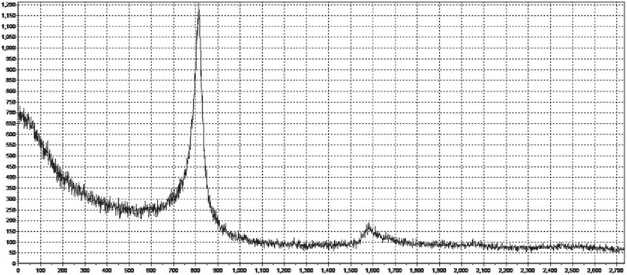
The X-ray fluorescence spectra and the elemental composition of the synthesis products are shown in Figure 2 and Table 1.
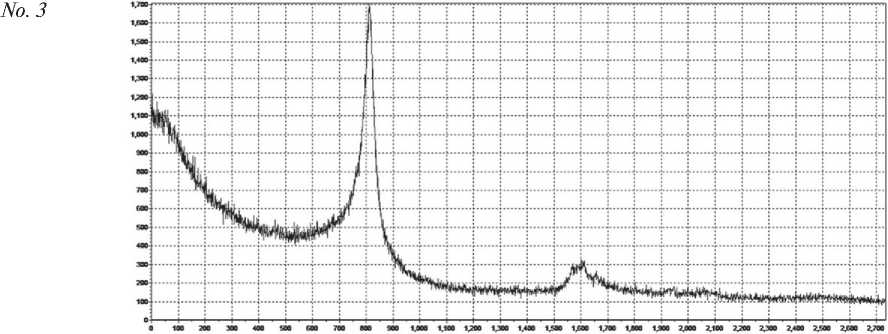
In Fig. 3, the spectra of the products are compared, which makes it possible to compare the composition of elements for further transformations.
To identify the structure, the X-ray phase analysis of the synthesis products was carried out, the results of which are shown in Figure 4. It is obvious that the amorphous globules strongly influence the formation of the X-ray spectrum and complicate the phase identification. At the same time, the analysis of the amorphous component of the composition, which is one of the output products, will make it possible to control the synthesis at each stage and under various conditions of its use.
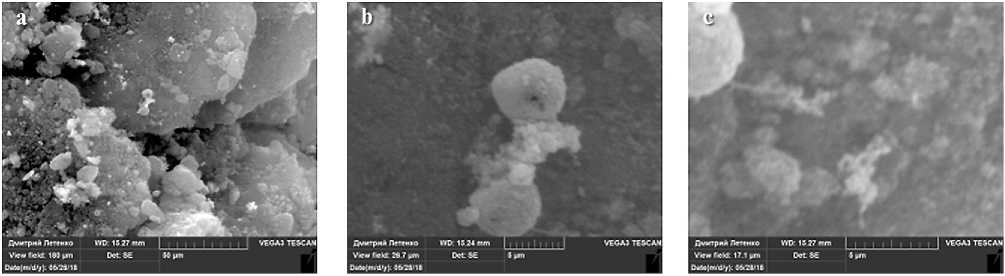
Fig. 1. Bitmaps of synthesis products
Sample 1
APPLICATION OF NANOMATERIALS AND NANOTECHNOLOGIES IN CONSTRUCTION
200 300
Sample 2
400 500 600 700 800 900 1000
|
80 |
— |
8000 |
T- |
||||||||||||||||||||
|
6000 |
|||||||||||||||||||||||
|
4000 |
|||||||||||||||||||||||
|
1 |
|||||||||||||||||||||||
|
30 |
। "Л |
Til |
2000 |
||||||||||||||||||||
|
IUL.1 |
1/ |
0 |
|||||||||||||||||||||
|
ki£ |
DU |
1UU |
|||||||||||||||||||||
|
0 |
|||||||||||||||||||||||
Sample 3
Sample 4
100 200 300 400 500 600 700 800 900 1000
Sample 5
|
A. |
||
100 300 500 700 900 1100 1300 1500 1700 1900
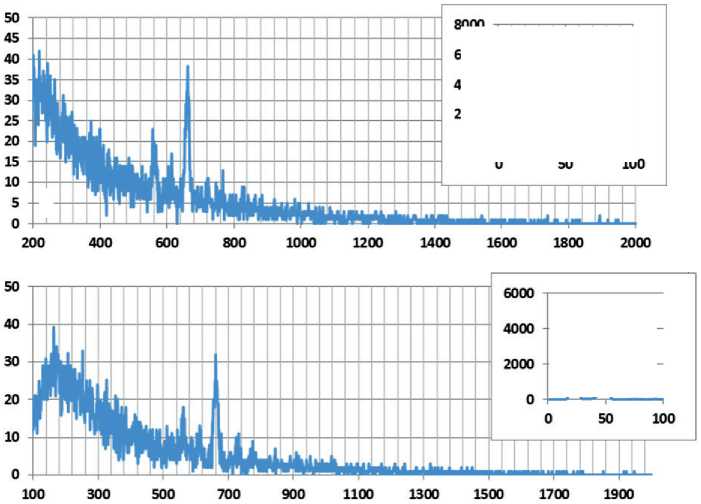
Fig. 2. Energy-scaled X-ray fluorescence spectra of the studied samples
APPLICATION OF NANOMATERIALS AND NANOTECHNOLOGIES IN CONSTRUCTION
Table 1
Results of X-ray fluorescence analysis
|
Sample |
Concentrations of the detected elements |
||||||||
|
C |
O |
Si |
Ni |
Cr |
Mn |
Fe |
Ni |
Cu |
|
|
C1 |
97.54 |
2.46 |
– |
– |
– |
– |
– |
– |
– |
|
C2 |
96.93 |
1.67 |
– |
– |
0.26 |
– |
1.14 |
– |
– |
|
C3 |
95.98 |
2.63 |
– |
– |
0.37 |
– |
1.02 |
– |
– |
|
C4 |
80.54 |
6.81 |
0.27 |
1.11 |
1.42 |
0.41 |
6.83 |
0.99 |
7.62 |
|
C5 |
96.3 |
2.14 |
– |
– |
– |
– |
0.6 |
– |
0.95 |
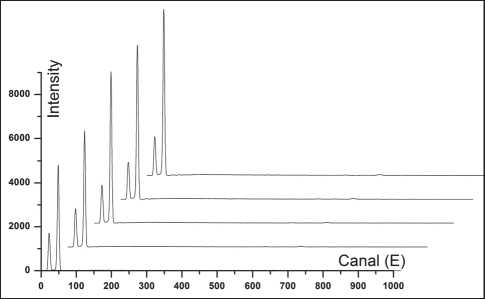
Fig. 3. Comparison of X-ray fluorescence spectra of samples of synthesis products
DISCUSSION
subset of the phase space of a dynamical system, all trajectories of which tend to it with increasing time of the process. For dynamic systems with nonlinear properties, an attractor is a point or a set of points (closed curve) towards which the parameters of the state of the dissipative system tend, that is, the attractor determines the final state of the dissipative system [12, 14].
To construct an attractor of a dynamic system, it is necessary to calculate the correlation dimension, the dimension of the phase space and the fractal dimension of the process under study. The correlation dimension and the dimension of the phase space are calculated using the Takens’ method. The fractal dimension is calculated using the Hurst exponent, which corresponds to random processes with independent increments [15], which is typical for chemical synthesis systems.
The Hurst exponent is calculated as follows
R/S = (ατ) H , (1)
Structural and fluorescence spectra do not give an unambiguous answer for the composition of the synthesis products. This is clearly shown in Figures 2, 3 and 4. At the same time, the research results given in Table 1 show the difference in the elemental composition of each sample, and Figure 4 indicates the presence of different amorphous structures.
The synthesis process, the formation of products of various structures have the properties of nonlinear dynamic systems, which are characterized by temporal nonlocality, non-marking, heredity and ergodicity [11, 12]. The measure of the self-similarity of the synthesis products is the Hurst exponent, which shows the direction of the formation of an amorphous and ordered phase [13].
Analysis of a nonlinear dynamic system
A nonlinear dynamic system is fully characterized by an attractor – a compact where α – the constant Hurst coefficient equal to 1, τ – the number of measured values, R – the range of deviations of the number series, S – the standard deviation of the number series, H – the Hurst exponent.
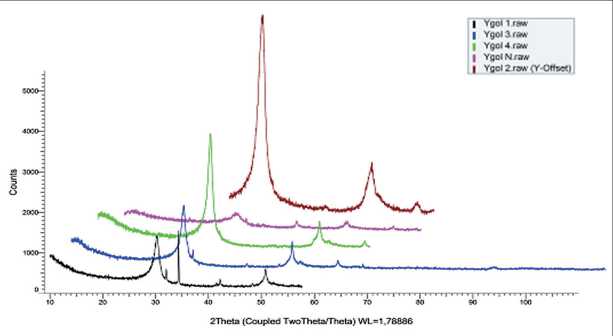
Fig. 4. X-ray spectra of synthesis products
APPLICATION OF NANOMATERIALS AND NANOTECHNOLOGIES IN CONSTRUCTION
If the Hurst exponent H = 0.5, then the increments characteristic of the process of obtaining some structures do not depend on the prehistory. If the inequality 0.5 ≤ H < 1 holds, then the process under study is characterized by a long-term “memory”. At 0 ≤ H <0.5, the process is characterized by short-term “memory”. If H > 1, then a subballistic development of the process takes place. That is, the Hurst exponent determines the measure of persistence – the propensity of the process to trends – fading, unstable equilibrium or to development [12]. It should be noted that the fractal dimension of the attractor (phase space) is calculated from the Hurst exponent as: D = 2– H .
The basis for the procedure for constructing an attractor is Takens’ theorem for set embedding operations. According to Takens’ theorem, for almost all smooth dynamical systems, based on the measured realization of the observed dynamical variable, one can construct an attractor whose properties will be identical to the original phase trajectory. To calculate the characteristics of the attractor, it is necessary to have a set of points M defined in the phase space of dimension n : M ≥ Mmin = 10 2+0 ,D , where D is the fractal dimension of the attractor [12, 14].
To calculate the characteristics of an attractor of a real dynamic system, the model and dimension of the phase space of which are unknown, it is necessary to know data about the behavior of the dynamic variable. In our case, this is the change in the intensity of the secondary X-ray radiation, which depends on the fluorescence energy, and the dependence of the intensity of scattering of the radiation of the X-ray tube on the Bragg angle.
For experimental data, the dimension of the phase space is, as a rule, unknown, while the correlation dimension of the attractor Dcor first increases and then reaches a constant level. The correlation dimension is related to the dimension of the phase space as follows [14]:
n
D^ - Dph + ^^-Lj, (2)
where ε = r/rmax is the normalized range, σ – the noise level (standard deviation), erf (ε/2σ) – the integral of the errors (tabulated).
The important consequence of the analytical result is that even at ε = 3σ, the correlation dimension grows with an increase in the embedding dimension.
Table 2 and Figure 5 show the calculation results for the X-ray fluorescence spectra obtained by the Takens’ and Hurst methods.
Table 2
Dimensional characteristics of X-ray fluorescence spectra
|
Sample |
Correlation dimension |
Phase space dimension |
Hurst exponent |
Fractal dimension |
|
Sample 1 |
1.68 |
6 |
0.65 |
1.34 |
|
Sample 2 |
1.61 |
4 |
0.66 |
1.33 |
|
Sample 3 |
0.34 |
1 |
0.62 |
1.38 |
|
Sample 4 |
0.33 |
1 |
0.62 |
1.37 |
|
Sample 5 |
0.36 |
1 |
0.63 |
1.37 |
No. 1
No. 2
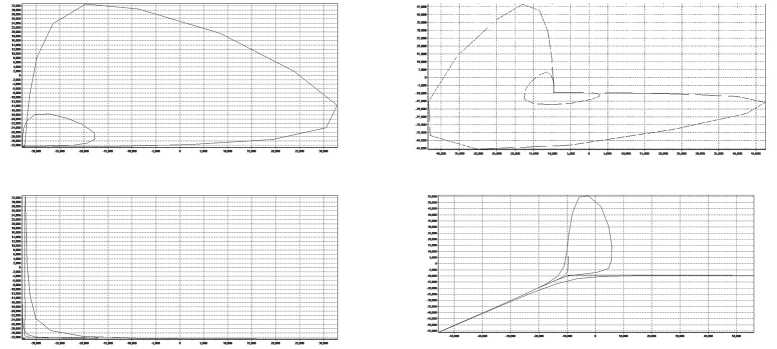
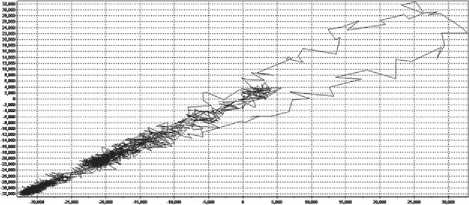
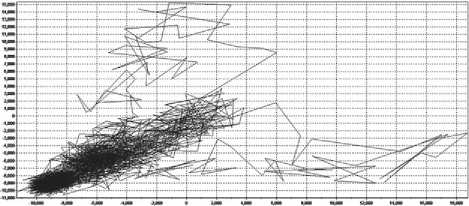
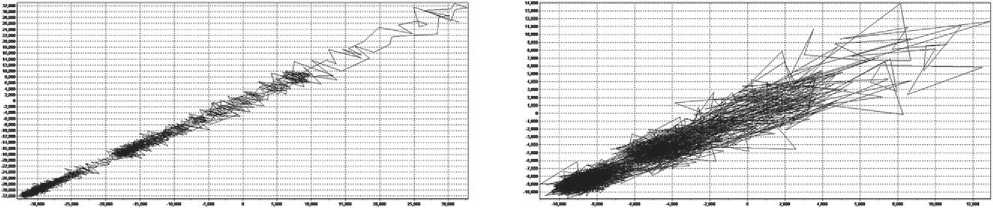
Fig. 5. Attractors of samples 1–5 constructed according to the results of X-ray fluorescence measurements
No. 3
APPLICATION OF NANOMATERIALS AND NANOTECHNOLOGIES IN CONSTRUCTION
End of fig. 5. Attractors of samples 1–5 constructed according to the results of X-ray fluorescence measurements
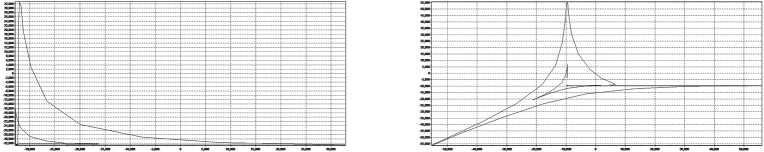
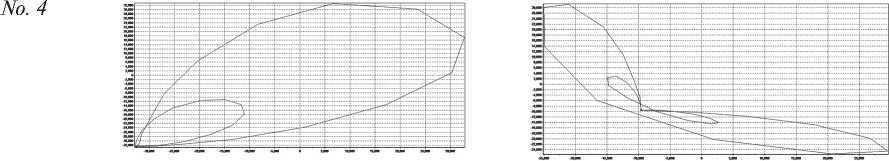
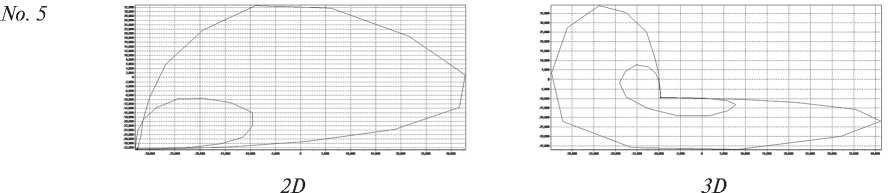
Table 3 and Figure 6 show the results of calculations for the structural spectra obtained by the Takens’ method and the Hurst method.
The attractors were constructed using the FRACTAN 4.4 software based on the measurement results without preliminary processing.
Comparing images 2 and 3, it can be seen that the calculated attractor and its dimensional characteristics both for the X-ray fluorescence and for the structural spectrum make it possible to expand the information content of the identification of synthesis products.
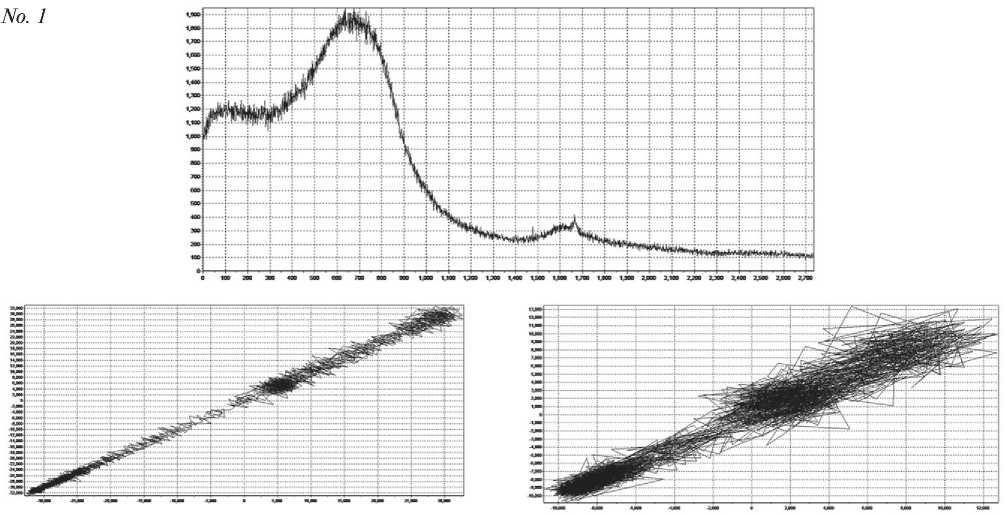
Fig. 7 shows a comparison of the initial spectra of fluorescence and structural analysis and their 2D and 3D attractors, constructed according to the calculations from Tables 2 and 3, respectively.
CONCLUSIONS
In the study of the dynamics of chemical reactions occurring in mixtures with stirring, the system of Rössler differential equations corresponding to a linear oscillator with a negative damping coefficient and feedback is actively used: The differential Rössler model serves as an example of multidimensional systems, the dynamics of which can be approximated by a one-dimensional mapping. The solution of the Rössler model for certain parameters is the Rössler attractor – an attracting set of trajectories on the phase space, which in its form is identical to the process under study [14, 16].
The Rössler attractor is generated by stochastic selfoscillations, which are supported in a dynamic system by
Table 3
The dimensional characteristics of the structural spectra
|
Sample |
Correlation dimension |
Phase space dimension |
Hurst exponent |
Fractal dimension |
|
Sample 1 |
6.4 |
9 |
1.14 |
0.854 |
|
Sample 2 |
7.9 |
12 |
1.011 |
0.988 |
|
Sample 3 |
7.3 |
10 |
1.059 |
0.941 |
|
Sample 4 |
6.9 |
10 |
1.024 |
0.897 |
|
Sample 5 |
6.9 |
8 |
1.038 |
0.961 |
APPLICATION OF NANOMATERIALS AND NANOTECHNOLOGIES IN CONSTRUCTION
2D
3D
2D
3D
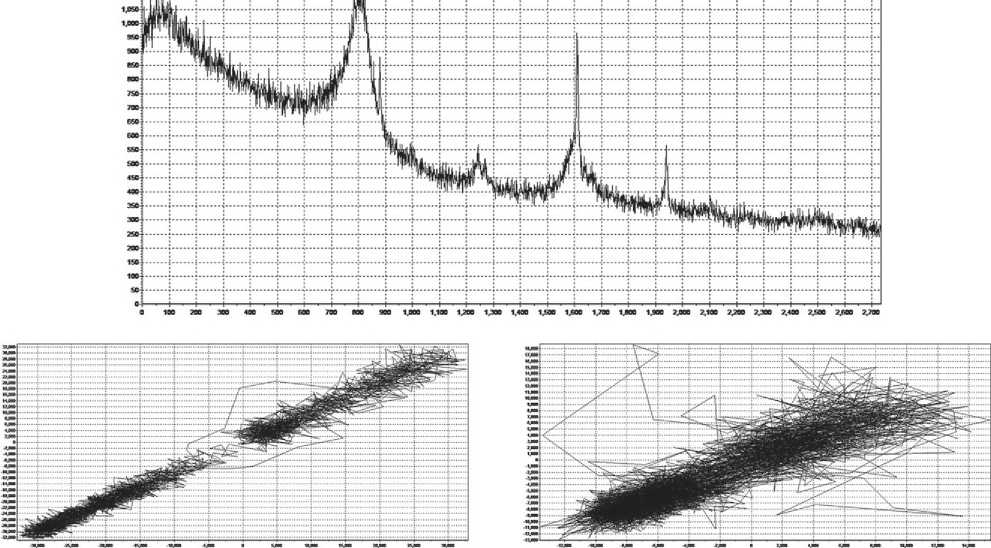
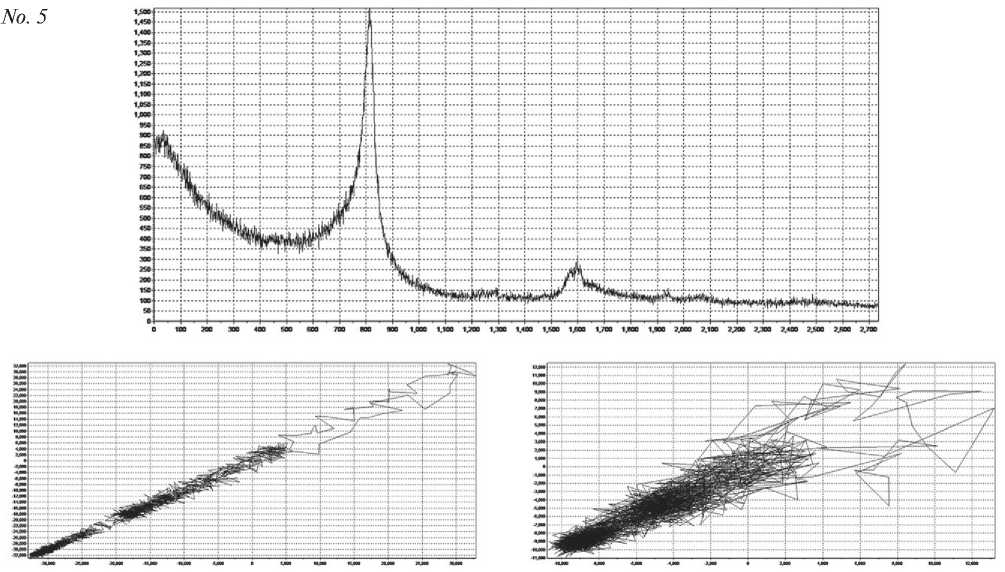
Fig. 6. Attractors of samples 1–5 built from the results of structural measurements
APPLICATION OF NANOMATERIALS AND NANOTECHNOLOGIES IN CONSTRUCTION
2D
3D
No. 4
2D
3D
Continuation of fig. 6. Attractors of samples 1–5 built from the results of structural measurements
APPLICATION OF NANOMATERIALS AND NANOTECHNOLOGIES IN CONSTRUCTION
2D
3D
End of fig. 6. Attractors of samples 1–5 built from the results of structural measurements
Sample 2
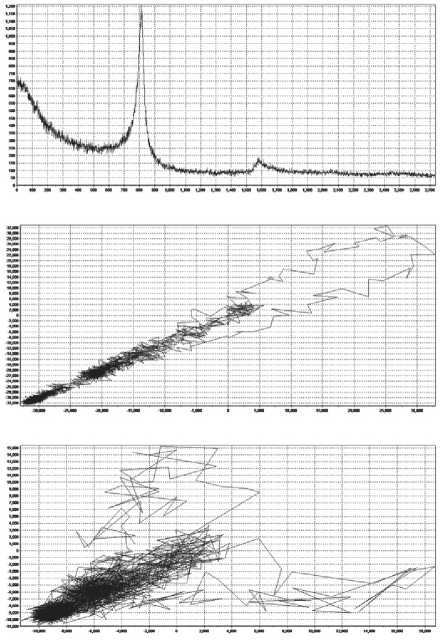
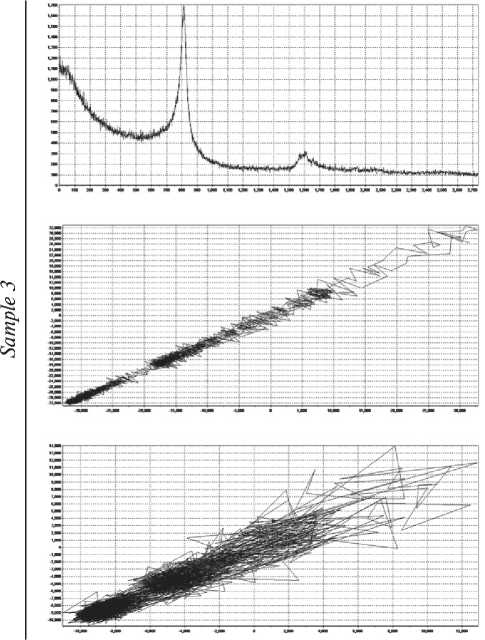
Fig. 7. Comparison of spectra and attractors of samples 2 and 3. Structural spectra
APPLICATION OF NANOMATERIALS AND NANOTECHNOLOGIES IN CONSTRUCTION
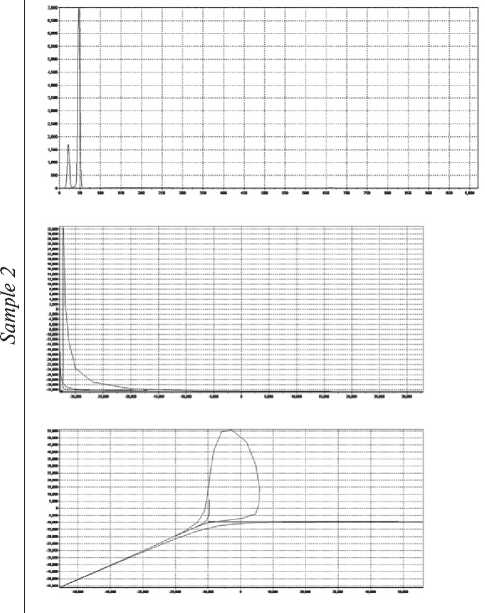
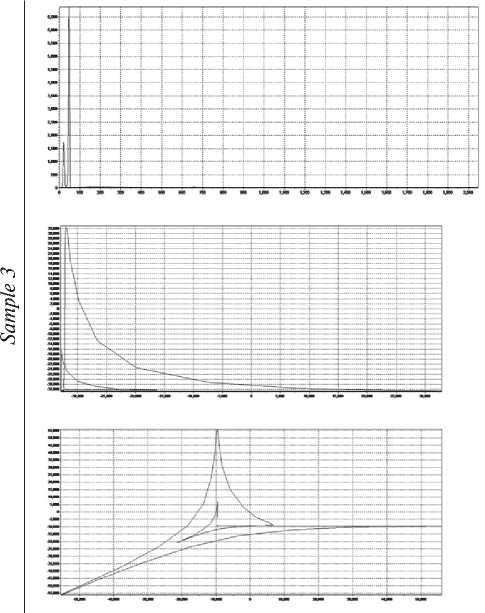
End of fig. 7. Comparison of spectra and attractors of samples 2 and 3. X-ray fluorescence spectra an external source, in the case of synthesis – the addition of necessary components and products obtained as a result of reactions. The physical meaning of the Rössler model describes the transition of laminar fluid motion to turbulent motion.
The system of differential equations, the solution of which leads to the Rössler attractor, has the form:
x· = –y–z, y· = x+ay, z· = b+z(x+µ).
The model Rössler attractor has the form shown in Figure 8. 3D sections of attractors obtained on the basis of X-ray fluorescence spectra are close to the form of the Rössler phase trajectory. Accordingly, it is possible to estimate, relying on attractors characteristic for each sample (synthesis material), at what stage the synthesis process is, and, let us build a differential model, to exercise controls to improve the quality of the output products.
Attractors based on structural measurements have a slightly different meaning. When comparing samples 2 and 3, it can be seen that the process of the formation
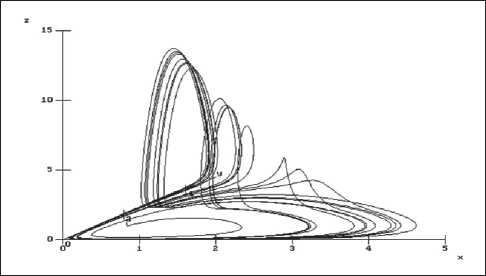
Fig. 8. The model Rössler attractor of crystal structures is in the development stage with a clear change in the amorphous phase.
Thus, the use of methods for describing nonlinear dynamic systems in the interpretation of X-ray spectral and X-ray phase analysis data makes it possible to quantitatively assess the degree of ordering of carbon nanoparticles, which determines their effectiveness as modifiers of building materials.

APPLICATION OF NANOMATERIALS AND NANOTECHNOLOGIES IN CONSTRUCTION
References X-ray spectral methods for measuring the degree of ordering of carbon nanoparticles
- Pukharenko Y.V., Magdeev U.X, Bazhenov Y.M., Morozov V.I. Scientific and practical results of nanostructural modification of cement concretes. Fundamental research by RAASN on the scientific provision of architecture, urban planning and construction industry of the Russian Federation in 2009. Moscow – Ivanovo, 2010;2:111–116.
- Pukharenko Y.V., Ryzhov D.I. On the effect of carbon fulleroid nanoparticles on the thermal output of the cement past. Bulletin of Civil Engineers. 2013;4(39):156–161.
- Pukharenko Y.V., Kharitonova T.V. Lime based dry mixes with carbonate aggregates International. Journal of Innovative Technology and Exploring Engineering. 2019;8(11):3289–3292.
- Aubakirova I.U. Nanomodified steel-fibrobeton for bridge structures. Journal of Science and Education of North-West Russia. 2017;3(4):13–20.
- Kratschmer W., Lamb L.D., Fostiropoulos K., Huffman D.R. Solid C60: A new form of carbon. Nature. 1990;347:354–359.
- Letenko D.G., Nikitin V.A., Menshicova A.Yu., Puharenko Ju.V., Charykov N.A. Physical and chemical properties of aqueous dispersions of the hybrid fulleroide nano-carbon material (Part I). Bulletin of Civil Engineers. 2010;2(23):131–138.
- Letenko D.G., Ivanov A.S., Matuzenko M.Yu., Nikitin V.A., Pukharenko Yu.V., Charykov N.A. Physical and chemical properties of aqueous dispersions of the hybrid fulleroide nano-carbon material (Part 2). Bulletin of Civil Engineers. 2010;3(24):117–122.
- Letenko D.G., Semenov K.N., Charykov N.A., Keskinov V.A., Kulenova N.A., Saf’yannikov N. M., Duryagina N.N., Garamova P.V, Klepikov V.V., Zolotarev A.A., Ivanov A.S. Solubility, Thermal Analysis and Association in Water Solutions of the Adducts of Fullerene C60 with Lysine, L-Threonine, L-Hydroxiproline. Smart Nanocomposites. 2017;8(1):1–12.
- Pavlov A.N., Ziganshin A.R., Anishchenko V. S. Multifractal analysis of time series. News of the universities “ANM”. 2001;9(3):39–52.
- Letenko D.G., Nikitin V.A., Charykov N.A., Semenov K.N., Pukharenko Ju.V. Synthesis of carbon nanostructures from waste products of chemical industry. Bulletin of Civil Engineers. 2010;1(22):108–118.
- Takens F. Detecting strange attractors in turbulence. In: Rand D.A., Young L.-S. Dynamical Systems and Turbulence. Lecture Notes in Mathematics. Springer-Verlag. 1981;898:366–381.
- Hegger R., Kantz H., and Schreiber T. Practical implementation of nonlinear time series methods. The TISEAN package, CHAOS 9;1999;413.
- Mandelbrot B.B. Fractals. Encyclopedia of Physical Science and Technology. 1987;5:579–593.
- Ruelle D., Takens F. On the nature of turbulence. Comm. Math. Phys. 1971;20:167.
- Alligood K.T., Sauer T.D., Yorke J.A. Chaos: an Introduction to Dynamical Systems. Springer; 1997;XVIII:603 p.
- Takens F. Detecting strange attractors in turbulence. In: Rand D.A., Young L.S. (eds.) Dynamical Systems and Turbulence: Lecture Notes in Mathematics. Heidelberg: Springer-Verlag; 1981;366–381.
