A Genetic Algorithm for Allocating Project Supervisors to Students

Author: Hamza O. Salami, Esther Y. Mamman
Journal: International Journal of Intelligent Systems and Applications(IJISA) @ijisa
Article in issue: 10 vol.8, 2016.
Free access
Research projects are graduation requirements for many university students. If students are arbitrarily assigned project supervisors without factoring in the students' preferences, they may be allocated supervisors whose research interests differ from theirs or whom they just do not enjoy working with. In this paper we present a genetic algorithm (GA) for assigning project supervisors to students taking into account the students' preferences for lecturers as well as lecturers' capacities. Our work differs from several existing ones which tackle the student project allocation (SPA) problem. SPA is concerned with assigning research projects to students (and sometimes lecturers), while our work focuses on assigning supervisors to students. The advantage of the latter over the former is that it does not require projects to be available at the time of assignment, thus allowing the students to discuss their own project ideas/topics with supervisors after the allocation. Experimental results show that our approach outperforms GAs that utilize standard selection and crossover operations. Our GA also compares favorably to an optimal integer programming approach and has the added advantage of producing multiple good allocations, which can be discussed in order to adopt a final allocation.
Genetic Algorithm, Student Projects, Project Supervisors, Student Project Allocation
Short address: https://sciup.org/15010866
IDR: 15010866
Text of the scientific article A Genetic Algorithm for Allocating Project Supervisors to Students
Published Online October 2016 in MECS
For undergraduate and postgraduate students in higher institutions of learning, research projects are a graduation requirement which usually have high credit units. Project supervisor allocation is a resource allocation problem that needs to be solved for students and lecturers. In order to ensure that the research project is enjoyable and fruitful for the students, there is need to consider their preferences for supervisors. Lecturers do not usually have an input in the choice of students because they are most likely to select the bright students, causing the less-than-average students to be disadvantaged [1]. In achieving a suitable solution, constraints such as number of students per lecturer, the number of lecturers per student, or the number of students per project topic need to be considered [2].
When students are requested to rank potential supervisors, they are likely to favorably rank lecturers whose courses they enjoyed taking or those whose areas of research interest they like. Thus, it is possible that some popular lecturers are oversubscribed. On the part of the lecturers, they may have a fixed number of slots for project students, based on their workloads. A head of department/ departmental chair as well as professors having many graduate students may be required to supervise fewer undergraduates than other lecturers. However hard the research project coordinator tries, it is difficult, if not impossible, to manually match supervisors to students such that all parties feel that they have been treated fairly.
This paper proposes assigning supervisors to students. The advantage of allocating supervisors to students, rather than research projects to students is that projects are not required to be available at the time of allocation, and students can discuss their project ideas/topics with supervisors after the allocation.
The remainder of this paper is organized as follows: Section II discusses related works while Section III describes the supervisor allocation problem (SAP). A detailed description of a GA for solving the SAP is provided in Section IV. Experimental results are discussed in Section V. Finally, the paper is concluded in section VI.
-
II. R ELATED W ORKS
The basic Student Project Allocation (SPA) problem seeks to allocate projects to students, taking into account the students’ preferences for projects. There are many variations of the SPA. Sometimes, lecturers are additionally assigned to projects. These lecturers may have preferences over the students and/or the projects. Projects may have capacities, i.e., the number of students that can participate in each project; similarly, lecturers’ capacities refer to the number of projects each lecturer may be involved in.
Ref. [3] designed algorithms to solve the SPA problem in which each student can be assigned to at most one project and there are constraints on the maximum number of students that can be assigned to each project and lecturer. The model takes into consideration lecturer upper and lower quotas. The optimal solution was obtained by applying the Ford-Fulkerson algorithm for finding the maximum flow in a network.
Ref. [4] described a SPA problem in which students have preferences over available projects and lecturers have preferences over students. The allocation is based on preference lists and capacity constraints. A linear-time algorithm was devised for finding a student-optimal stable matching using a sequence of apply operations.
The SPA problem discussed in [5] allows students’ preferences over projects and lecturers ’ preferences over students, as well as lecturers’ and projects’ capacity constraints. Two algorithms based on constraint programming technique were presented for finding stable matchings. The outcome of the first algorithm is a student-optimal stable matching, such that each student obtains the best project that is available in any stable matching while the outcome of the second algorithm is a lecturer-optimal stable matching in which each lecturer obtains the best students that are available in any stable matching.
Ref. [6] studied the SPA problem in which students and lecturers have preferences over projects. The authors demonstrated that finding a maximum stable matching is NP-hard. An approximation algorithm having a performance guarantee of 2 compared to an optimal stable matching algorithm was developed. Authors in [7] improved the performance ratio of Ref [6] by developing an approximation algorithm whose performance guarantee ranges from 1.11 to 1.50.
Ref. [8] proposed a genetic algorithm for assignment of projects to students. A list of projects is made available where the students indicate their preferred choices. Several fitness functions were defined for the genetic algorithm and a comparison was made with an optimal integer programming solution. The genetic algorithm produced fitness values of between 85% and 93% of the optimal solution.
Ref. [9] proposed an artificial immune algorithm for solving the SPA subject to students’ preferences over projects. Their results showed that artificial immune algorithm found better quality solutions compared to GA, even though the former algorithm required more time than the latter.
Goal programming (GP) was used to handle the assignment of projects for an undergraduate course in the department of mathematics at the University of Hong Kong [10]. The students and lecturers had preferences over available projects. The goal of the research was to allocate the maximum number of acceptable projects to students with high grade point average (GPA). A comparison was made with the manual solution provided by the department as well as that of a greedy algorithm. It was observed that with GP, all the students were allocated either their first or second choices with nearly 90% of the students being allocated their first choices. Even though the average GPA of the students who were allocated projects using GP was slightly lower than those of the greedy algorith m and the manual solution provided by the department, the student preferences were better met.
Unlike in the SPA which is concerned with assigning research projects to students (and sometimes lecturers), this work focuses on assigning supervisors to students. The advantage of the latter over the former is that it does not require projects to be available at the time of assignment, thus allowing the students to discuss their own project ideas/topics with supervisors after the allocation. The two inputs required in order to assign supervisors to students are the student preferences for lecturers and lecturer capacities. The former is based on how students have ranked their potential supervisors, while the latter indicates the number of students who should be assigned to each lecturer.
-
III. S UPERVISOR A LLOCATION P ROBLEM
The SAP is concerned with allocating project supervisors to students taking into account the students’ preferences for lecturers as well as lecturer supervision capacities. For example, the head of department could have a supervision capacity of three students due to the responsibilities of his/her office, while a visiting lecturer could have a capacity of two students. All other lecturers may have supervision capacities of say, five students each. The students rank the lecturers according to preference; a ranking of 1 for a lecturer indicates that the lecturer is the most preferred supervisor for a given student, a ranking of 2 shows that a lecturer is the second most preferred for a given student, and so on. A lecturer can supervise several students, but each student can be supervised by only one lecturer. Conflicts arise when the number of students who have a given lecturer as their first choice exceeds the lecturer’s supervision capacity.
Students
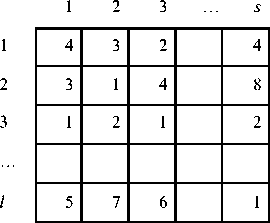
Fig.1. A Students’ Preference Matrix with l Lecturers and s Students
1 2 3 … l
|
4 |
3 |
1 |
2 |
3 |
Fig.2. A Lecturer Workload Vector with l Lecturers
Let S = {1, 2, 3 … s} be a set of students and let L = {1, 2, 3 … l} be a set of lecturers. The students’ preferences for lecturers are stored in an l x s student preference matrix P. The entry Pij is the preference given by student j to lecturer i. A sample of the student preference matrix is shown in Fig. 1. From the second column of the matrix, it can be observed that the best three choices for the second student are the second, third and first lecturers, in that order. Furthermore, from row three of the matrix, the third lecturer is the most preferred supervisor for the first and third students, as well as the second most preferred supervisor for the second student. The lecturer workload vector W specifies how many students each lecturer is expected to supervise. Fig. 2 shows a hypothetical lecturer workload matrix. It can be noticed from the figure that the first and second lecturers are required to supervise four and three students, respectively.
The SAP is a special case of the generalized assignment problem [11], which seeks the minimum cost of assigning jobs to agents subject to the agents’ capacities. Even though an optimal solution to the SAP can be found when the classical integer programming approach is applied to the generalized assignment problem, the advantage of using genetic algorithm (GA) is that GA can produce different allocations which may enable discussion on the merits of each allocation [8]. Being a special case of the generalized assignment problem, the SAP can be formulated as a linear programing problem as follows:
ls
Minimize XXPjXj(1)
i = 1 j = 1
Subject to:
s
X Xj = Wi, ie L(2)
j = 1
l
X X 1, j e 5(3)
i = 1
Xj = 0 or1, i e L, j e 5(4)
Where l= number of lecturers, s = number of students, Wi = number of students the ith supervisor can take, Pij = cost of assigning ith lecturer to the jth student and its value can be read from the entry in the ith row and jth column of the student preference matrix. Xij is the assignment variable whose value is sought. If Xij = 1, the ith lecturer is assigned to the jth student.
Since lower values of student rankings indicate better preference, the objective function in (1) is to be minimized. The constraint in (2) ensures that the number of students each lecturer supervises matches the lecturer’s workload capacity.
Each student should be assigned only one lecturer, as presented in (3). The constraint in (4) complements that of (3). Both constraints ensure that each student is assigned to exactly one supervisor; in other words, there is no provision for co-supervision.
-
IV. G ENETIC A LGORITHM
Genetic Algorithms are biologically-inspired optimization algorithms that can be used to solve problems involving large search spaces. They are based on natural genetics and natural selection [12]. GAs begin with a randomly generated set of candidate solutions or chromosomes which form a population. Each chromosome is made up of smaller units referred to as genes. A fitness function is used to evaluate how fit/good a chromosome is. Fitter parents have better chances of being selected for crossover/reproduction, during which parts of parents are combined to form offspring. With a small probability, some chromosomes are mutated by making random changes in their genes. Mutation helps to prevent the search from being stuck in a local optimum. GA goes through several generations, comprising operations such as selection, crossover and mutation. The GA stops when a termination criterion is satisfied.
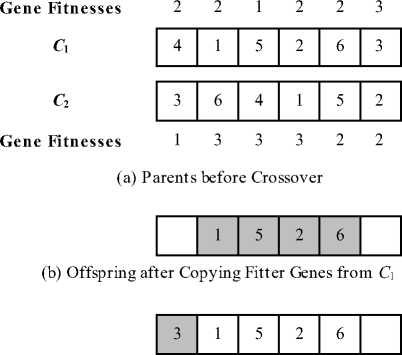
A detailed description of a GA for finding suitable assignment of supervisors to students is provided in the reminder of this section. The GA is adopted from [13], and we have successfully used its variants in [14, 15]. The inputs to the GA are an l x s student preference matrix P and a row vector W of length l which holds the workload for each lecturer. Recall that l and s represent the number of lecturers and students, respectively. The output of the GA is a row vector indicating the lecturer that has been assigned to each student. Fig. 3 shows hypothetical matrices P and W as well as two chromosomes C 1 and C 2, which will be used to illustrate the concepts in this section.
Students 1 2 3 4 5 6
|
2 |
1 |
1 |
2 |
3 |
3 |
|
1 |
3 |
2 |
3 |
1 |
1 |
|
3 |
2 |
3 |
1 |
2 |
2 |
1 2 3 4 5 6 1
4 1 5 2 6 3 3
(c) Chromosome C 1
(a) Students Preference Matrix P
-
1 23
-
2 13
-
(b) Lecturer Workload Matrix W
2 3 4 56
6 4 1 52
-
(d) Chromosome C 2
Fig.3. Values Used in Illustrative Example
1 2 3 4 5 6
4 1 5 2 63
Н—V'—i1
W = 2 W = 1W = 3

4th and 1st students are supervised by 1 st lecturer
5th student is supervised by 2nd lecturer
-
• 2 nd , 6th and 3rd students are supervised by 3rd
lecturer
-
Fig.4. A Chromosome and its Interpretation
-
A. Chromosome Representation
Each chromosome is a row vector having s genes. The values in the first W 1 genes indicate which students will be supervised by the first lecturer, values in the next W 2 genes indicate which students will be supervised by the second lecturer, the values in the next W 3 genes indicate which students will be supervised by the third lecturer, and so on. Because each student can only be assigned to one supervisor, the values in the chromosome are a permutation of the numbers 1, 2 … s . It is noteworthy that this chromosome representation ensures that lecturers’ workload constraints are always satisfied. Fig. 4 shows how supervisors are assigned to students based on the workload matrix and chromosome of Fig. 3(b) and 3(c), respectively.
-
B. Fitness Values
The fitness value of any gene in a chromosome can be determined from matrix P . Assume that the i th lecturer should supervise the student whose value is in the k th gene (as described in Section IV-A). If the value of the k th gene is j , then the fitness value of the gene is P i, j . For example, the fitness value of the first gene shown in Fig. 3(c) is 2. Note that the first lecturer is to supervise the students in the first two genes. Since the value of the first gene is 4, and P 1,4 = 2, the fitness value of that gene is 2. Similarly, the value of the third gene is 5 and the fifth student should be supervised by the second lecturer. Since P2,5 is 1, the fitness value of the third gene is 1.
The fitness value of a chromosome is the sum of the fitness values of its genes. Thus, the fitness value of the chromosome of Fig. 3(c) is P 1,4 + P 1,1 + P 2,5 + P 3,2 + P 3,6 + P 3,3 = 2 + 2 + 1 + 2 + 2 + 3 = 12. Similarly, the fitness value of the chromosome of Fig. 3(d) is P 1 , 3 + P 1 , 6 + P 2 , 4 + P3,1 + P3,5 + P3,2 = 1 + 3 + 3 + 3 + 2 + 2 = 14. It should be noted that since the supervisor allocation problem is a minimization problem, the lower the fitness value for a gene/chromosome, the fitter the gene/chromosome.
-
C. Population Initialization
At the beginning of the GA, each of the n chromosomes in the population is generated as a random permutation of the numbers 1, 2 … s .
-
D. Selection
Every individual in the population is selected for crossover. 2*n individuals are selected for crossover since a crossover of two parents produces only one offspring. The n individuals of the population are sorted in increasing order of fitness values. The crossover operator is applied to the ith and (i+1)th individuals (1 ≤ i < Гn/21) resulting in Гn/21 individuals of the next population. In addition, the crossover operator is applied to the jth and (n + 1 - j)th individuals (1 < j < Ln/2j) to generate the remaining Ln/2j individuals of the next population. This manner of selection results in the production of individuals with better fitness values, and likely leads to a better average fitness value for the next generation [13].
-
E. Crossover
Let the two parents selected for crossover be C 1 and C 2, where C 1 ’s fitness value is better (i.e., lower) or equal to C 2’s fitness value. The genes of the new offspring are formed as follows. First, all genes in which C 1 has a better (or equal) fitness value than the corresponding gene in C 2 are copied to the offspring. Next, the genes from C 2 having better fitness values than corresponding genes of C 1 are copied to the offspring, provided that the gene has not been copied from C 1 in the first step. Finally, the remaining genes of the offspring are filled by randomly choosing one of the values that does not already appear in the offspring. This crossover operation likely results in a fitter offspring, because the offspring combines as many good characteristics (genes) of the parents as possible. In order to ensure that the fitness value of an offspring is at least as good as those of its parents, the newly generated offspring is discarded and replaced by C 1 if the offspring is not as fit as C 1 [13]. It is worth mentioning that this crossover never results in invalid chromosomes, that is, those in which gene values are duplicated. The crossover operation is illustrated in Fig. 5. The grey colored cells indicate genes that are formed in the offspring at each stage. As stated in Section IV-B, the fitness values of C 1 and C 2 are 12 and 14, respectively. The fitness value of the offspring in Fig. 5(d) is 1 + 2 + 1 + 2 + 2 + 1 = 9. The offspring is retained since it is fitter than its parents.
-
F. Mutation
In order to ensure diversity of the population and prevent GA from being trapped in a local optimum, there is a small probability that each gene in the population is mutated. Mutation involves swapping a gene with another randomly selected gene in the same chromosome.
-
G. Uniqueness of individuals in the population
At the end of each generation, duplicate individuals in the population are eliminated by repeatedly mutating one of the replicas until it becomes distinct from all other individuals. Identical individuals sometimes emerge in the population because at the end of crossover, the fitter parent ( C 1 ) replaces the offspring if the latter is not as fit as the former. Because the fittest parents are selected for crossover twice, it is possible that a very fit parent is returned as the offspring after both crossover operations.
-
H. Termination conditions
The GA terminates when a pre-set maximum number of iterations is reached or the best fitness value of the population does not improve during a given number of generations.
(c) Offspring after Copying Fitter Genes from C 2 that Have not Being Used in the Offspring
|
3 |
1 |
5 |
2 |
6 |
4 |
Gene Fitnesses 1 2 1 2 2 1
(d) Offspring after Randomly Filling Remaining Positions with Unused Genes
-
Fig.5. Crossover Operation
-
V. E XPERIMENTAL R ESULTS
This section discusses results obtained from experimental validation of the proposed GA. The GA was implemented using the MATLAB® simulation tool. The fitness values and running times of the developed GA were compared to those obtained using MATLAB’s binary integer programming function named bintprog, as well as those of GAs that utilize standard selection and crossover operators.
-
A. Experimental Dataset
Part of the experimental data was obtained from the final year undergraduate students of five departments in the Federal University of Technology, Minna, Nigeria. It comprises of the number of students, the number of lecturers and the number of students assigned to each lecturer. The latter values were used as the lecturer workload matrix W for each department. However, the student preference matrix was randomly generated for each department because supervisors had already been assigned to students for the current year when this research started. Table 1 presents the number of students as well as the number of lecturers who are available for supervision in the five departments. For example, computer science department has 8 supervisors to be allocated to 38 students. Table 2 shows the workload or supervision capacity of the lecturers in each department. It can be seen from the table that the first lecturers in computer science and cyber security science departments should supervise six and three students, respectively. The student-preference matrix for Department of Telecommunication Engineering (TEL) is presented in Table 3. The entry underlined in each column of the matrix highlights which of the 11 lecturers is the most preferable supervisor for each of the 26 students.
Table 1. Number of Students and Lecturers in the Five Departments
|
Department |
Number of Students |
Number of Lecturers |
|
Computer Science (CPT) |
38 |
8 |
|
Computer Engineering (CPE) |
28 |
10 |
|
Cyber Security Science (CSS) |
32 |
7 |
|
Telecomm. Engineering (TEL) |
26 |
11 |
|
Information & Media Tech. (IMT) |
29 |
8 |
|
Table 2. Lecturer Capacity for the Five Departments |
||
|
Lecturers CPT CPE |
CSS TEL |
IMT |
|
1 6 2 |
3 2 |
4 |
|
2 3 2 |
4 2 |
7 |
|
3 4 3 |
5 2 |
7 |
|
4 5 3 |
5 2 |
2 |
|
5 5 3 |
5 2 |
2 |
|
6 5 3 |
5 2 |
3 |
|
7 5 3 |
5 2 |
2 |
|
8 5 3 |
3 |
2 |
|
9 3 |
3 |
|
|
10 3 |
3 |
|
|
11 |
3 |
|
Table 3. Students’ Preference Matrix for Department of Telecommunication Engineering
Students
|
1 |
2 |
3 |
4 |
5 |
6 |
7 |
8 |
9 |
10 |
11 |
12 |
13 |
14 |
15 |
16 |
17 |
18 |
19 |
20 |
21 |
22 |
23 |
24 |
25 |
26 |
|
|
1 |
1 |
3 |
1 |
6 |
9 |
8 |
11 |
4 |
8 |
11 |
6 |
7 |
11 |
2 |
6 |
7 |
4 |
8 |
10 |
10 |
6 |
9 |
10 |
9 |
1 |
1 |
|
2 |
11 |
10 |
2 |
7 |
1 |
1 |
5 |
1 |
1 |
2 |
9 |
8 |
7 |
1 |
8 |
3 |
8 |
6 |
7 |
5 |
4 |
7 |
8 |
11 |
3 |
5 |
|
3 |
4 |
5 |
4 |
8 |
11 |
3 |
3 |
3 |
5 |
5 |
10 |
1 |
6 |
3 |
1 |
5 |
5 |
2 |
9 |
7 |
5 |
8 |
7 |
8 |
6 |
4 |
|
4 |
3 |
1 |
8 |
9 |
7 |
10 |
8 |
8 |
10 |
3 |
4 |
9 |
1 |
4 |
7 |
9 |
11 |
4 |
1 |
1 |
9 |
6 |
1 |
4 |
8 |
2 |
|
5 |
10 |
9 |
10 |
4 |
2 |
5 |
1 |
9 |
4 |
9 |
8 |
3 |
10 |
6 |
3 |
10 |
1 |
7 |
11 |
2 |
2 |
10 |
11 |
3 |
11 |
9 |
|
6 |
6 |
4 |
3 |
3 |
4 |
2 |
7 |
10 |
11 |
1 |
11 |
10 |
5 |
8 |
11 |
8 |
9 |
11 |
5 |
11 |
11 |
11 |
3 |
7 |
4 |
11 |
|
7 |
7 |
8 |
9 |
1 |
8 |
11 |
10 |
5 |
6 |
10 |
7 |
2 |
8 |
5 |
9 |
4 |
3 |
9 |
2 |
3 |
1 |
4 |
9 |
1 |
9 |
3 |
|
8 |
2 |
11 |
7 |
2 |
3 |
4 |
9 |
7 |
7 |
4 |
5 |
6 |
3 |
10 |
4 |
2 |
7 |
10 |
3 |
6 |
10 |
2 |
2 |
10 |
5 |
7 |
|
9 |
9 |
7 |
6 |
11 |
6 |
9 |
6 |
6 |
9 |
8 |
3 |
11 |
9 |
7 |
2 |
11 |
10 |
1 |
4 |
4 |
8 |
1 |
4 |
5 |
10 |
10 |
|
10 |
8 |
2 |
5 |
5 |
5 |
7 |
2 |
11 |
3 |
6 |
2 |
4 |
2 |
9 |
5 |
1 |
6 |
5 |
8 |
9 |
3 |
3 |
5 |
6 |
7 |
6 |
|
11 |
5 |
6 |
11 |
10 |
10 |
6 |
4 |
2 |
2 |
7 |
1 |
5 |
4 |
11 |
10 |
6 |
2 |
3 |
6 |
8 |
7 |
5 |
6 |
2 |
2 |
8 |
-
B. Experimental Setup
The MATLAB R2010a simulation tool was used to implement the GA described in this paper. All experiments were carried out on a computer system having a processor speed of 2.4GHz as well as main memory capacity of 4GB, and running the 64-bit windows 7 operating system. As previously mentioned, the student preference matrix was generated randomly. The parameters used to run the GA experiments are presented in Table 4. During execution, if the best fitness value obtained does not change within 20 generations, the GA comes to a halt. Otherwise the algorithm stops after 1,000 generations. The probability of mutating each gene in the population is 0.05. All the GA experiments were run 30 times since GA is stochastic.
Table 4. GA Parameters
|
GA Parameters |
Value |
|
Size of Population |
50 |
|
Crossover rate |
1 |
|
Mutation rate |
0.05 |
|
Number of generations to terminate GA if best fitness value does not improve |
20 |
|
Maximum number of generations |
1000 |
C. Results and Discussion
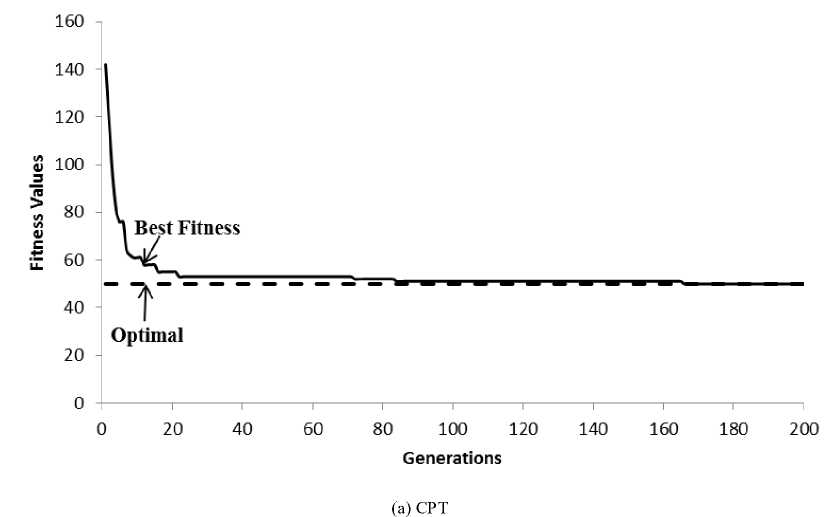
Fig. 6 shows the convergence characteristics of the proposed GA for two departments: CPT and IMT. At the beginning, the GA converges very rapidly and as a result, the best fitness value in the population is near optimal within a short time.
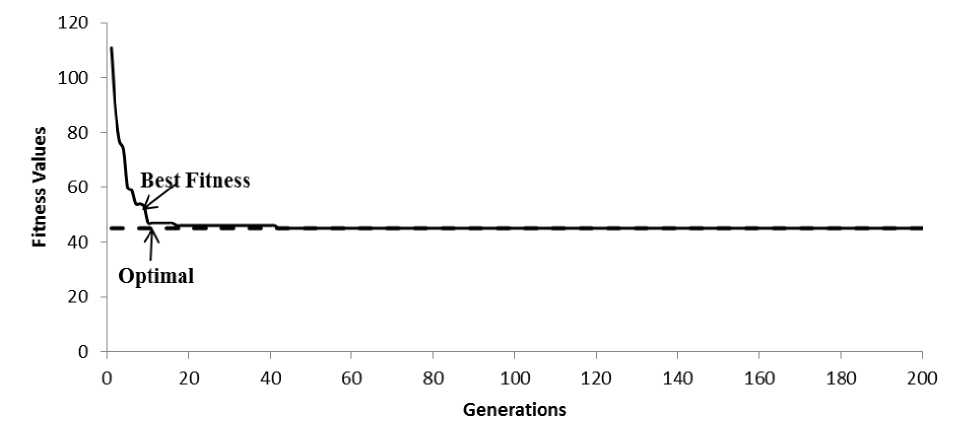
(b) IMT
Fig.6. Convergence Characteristic of GA
The mean, minimum, and maximum fitness values as well as mean computation time for GA are shown alongside the optimal values in Table 5. For example, the results for computer science (CPT) department show a mean fitness value of 52.13, a minimum fitness value of 51.00, and a maximum fitness value of 54.00, as well as average run time of 0.86 seconds. The optimal fitness value for the same department is 50.00, obtained after 0.48 seconds. In all cases, the time taken by the GA was higher than that required to obtain the optimal solution using integer programming. The GA found an optimal solution in many cases, and near optimal solutions in other cases. The advantage of GA is its ability to produce different (near) optimal results after different runs; these multiple results can be studied and compared before selecting a final allocation of supervisors to students.
Table 6 shows the optimal assignment of supervisors to students of TEL, as well as ten different allocations obtained from different runs of GA. Recall that the lecturer workload and student-preference matrices are presented in Table 2 and Table 3, respectively. All students who were not assigned their most preferred supervisors are underlined. It is interesting to note that since no student chose the eighth lecturer as his/her first-choice supervisor (see Table 3), all entries in the eighth column of Table 6 are underlined. The last column of Table 6 shows that GA produces varieties of supervisor allocations which are either optimal or near-optimal.
Table 7 shows a comparison of our GA and other GAs that utilize well known crossover and selection operators. Three selection operators namely: roulette wheel selection, rank-based selection and binary tournament selection were chosen. The three crossover operators selected were one-point crossover, two-point crossover and partially mapped crossover. A repair function was used to fix invalid offspring after one-point and two-point crossovers, because offspring sometimes had duplicate genes signifying that students had multiple supervisors. On the other hand, the partially mapped crossover did not require a repair function because it always resulted in valid chromosomes.
As shown in Table 7, average fitness values were obtained for nine GAs, each of which utilized a different combination of crossover and selection operations. Roulette wheel selection consistently performed worse than the other two selection operators, while rank-based selection performed slightly better than binary tournament selection most of the time. One-point and two-point crossover operations compared favorably with each other, but were both outperformed by partially mapped crossover. In all cases, our GA produced better fitness values than any of the nine GAs. This can be attributed to our algorithm’s selection and crossover operators. In particular, our crossover operator tries to combine as many good characteristics (genes) of the parents as possible, usually resulting in fitter offspring.
Table 5. Results for GA and Integer Programming Approach
|
Dept |
Fitness Values |
Time (seconds) |
||||
|
Optimal Value |
Mean Fitness Value (GA) |
Min Fitness Value (GA) |
Max Fitness Value (GA) |
GA |
Optim al |
|
|
CPT |
50 |
52.13 |
51.00 |
54.00 |
0.86 |
0.48 |
|
CPE |
33 |
34.07 |
33.00 |
36.00 |
0.51 |
0.42 |
|
IMT |
45 |
45.63 |
45.00 |
47.00 |
0.49 |
0.40 |
|
CSS |
38 |
39.03 |
38.00 |
42.00 |
0.62 |
0.35 |
|
TEL |
37 |
38.93 |
37.00 |
41.00 |
0.51 |
0.43 |
Table 6. Allocation of Supervisors to Students of Department of Telecommunication Engineering
|
Lecturers |
Fitness Value |
|||||||||
|
1 |
2 |
3 4 |
5 |
6 7 |
8 |
9 |
10 |
11 |
||
|
Integer Programming GA 1st Run |
3, 26 25, 26 |
5, 14 6, 9 |
12, 15 19, 20 12, 14 13, 20 |
7, 17 5 , 17 |
6 , 10 21, 24 3 , 10 4, 21 |
1 , 4 , 23 1 , 19 , 23 |
11 , 18, 22 15 , 18, 22 |
2 , 13 , 16 2 , 7 , 16 |
8 , 9 , 25 8 , 11, 24 |
37 40 |
|
GA 2nd Run |
3, 25 |
5, 14 |
12, 15 19, 26 |
7, 17 |
6 , 10 4, 21 |
1 , 13 , 23 |
18, 20 , 22 |
2 , 11 , 16 |
8 , 9 , 24 |
40 |
|
GA 3rd Run |
3, 26 |
8, 14 |
12, 15 13, 20 |
17, 21 |
6 , 10 4, 24 |
1 , 5 , 23 |
18, 19 , 22 |
2 , 7 , 16 |
9 , 11, 25 |
39 |
|
GA 4th Run |
3, 26 |
9, 14 |
12, 15 13, 20 |
7, 17 |
6 , 10 4, 21 |
1 , 5 , 23 |
18, 19 , 22 |
2 , 11 , 16 |
8 , 24 , 25 |
39 |
|
GA 5th Run |
3, 25 |
5, 14 |
12, 15 19, 20 |
7, 17 |
6 , 10 21, 26 |
1 , 4 , 23 |
11 , 18, 22 |
2 , 13 , 16 |
8 , 9 , 24 |
39 |
|
GA 6th Run |
25, 26 |
3 , 14 |
12, 15 13, 19 |
17, 21 |
6 , 10 4, 24 |
1 , 5 , 23 |
18, 20 , 22 |
2 , 7 , 16 |
8 , 9 , 11 |
40 |
|
GA 7th Run |
3, 26 |
14, 9 |
12, 15 19, 20 |
7, 17 |
6 , 10 4, 21 |
1 , 5 , 23 |
11 , 18, 22 |
2 , 13 , 16 |
8 , 24 , 25 |
38 |
|
GA 8th Run |
3, 26 |
5, 14 |
8 , 12 19, 20 |
7, 17 |
6 , 10 21, 24 |
1 , 4 , 23 |
15 , 18, 22 |
2 , 13 , 16 |
9 , 11, 25 |
37 |
|
GA 9th Run |
25, 26 |
3 , 14 |
12, 15 13, 20 |
7, 17 |
6 , 10 4, 21 |
1 , 5 , 23 |
18, 19 , 22 |
2 , 11 , 16 |
8 , 9 , 24 |
40 |
|
GA 10th Run |
3, 26 |
5, 14 |
12, 15 2, 19 |
7, 17 |
6 , 10 21, 24 |
1 , 4 , 23 |
18, 20 , 22 |
9 , 13 , 16 |
8 , 11, 25 |
38 |
|
Table 7. Comparison of Average Fitness Values for Various GAs |
||||||||||
|
One-point crossover |
Two-point crossover |
Partially mapped crossover |
||||||||
|
Dept This work |
RW |
RNK |
BT |
RW |
RNK |
BT |
RW |
RNK |
BT |
|
|
CPT 52.1 CPE 34.0 IMT 45.6 CSS 39.0 TEL 38.9 |
115.1 94.7 86.3 85.0 92.4 |
60.9 42.2 51.3 44.5 46.0 |
61.4 43.7 51.6 45.9 45.9 |
114.7 96.7 87.7 82.2 94.5 |
61.5 43.2 50.2 44.6 45.6 |
64.7 42.5 51.1 45.5 46.6 |
113.2 93.3 85.9 83.3 92.8 |
58.0 43.0 50.6 44.4 45.6 |
59.4 41.5 51.3 44.4 45.3 |
|
|
RW = Roulette wheel selection, RNK = Rank-based selection, BT = Binary tournament selection |
||||||||||
-
VI. C ONCLUSION
In this paper we presented a genetic algorithm for allocating project supervisors to students based on the students’ preferences. Experimental results have shown that to a large extent, our GA successfully assigned the most preferred project supervisors to students subject to the workload constraints of the supervisors.
The developed GA compared very well to an optimal integer programming approach, and it has the advantage of producing multiple solutions which can be discussed in order to select a final allocation of supervisors to students. Furthermore, our GA performed better than GAs which utilized standard crossover and mutation operators. This suggests that GA operators that are specifically tailored towards a particular problem are likely to produce better results than the regular GA operators.
References A Genetic Algorithm for Allocating Project Supervisors to Students
- J. Ryder, J. Leach, and R. Driver, “Undergraduate science students' images of science,” Journal of Research in Science Teaching, vol. 36 no. 2, pp. 201-219, 1999.
- S. Pudaruth, M. Bhugowandeen, and V. Beepur, “A multi-objective approach for the project allocation problem,” International Journal of Computer Applications, vol. 69 no. 20, pp. 26-30, 2013.
- A. Kwanashie, R. W. Irving, D. F. Manlove, and C. T. Sng, “Profile-based optimal matchings in the student/project allocation problem,” in Combinatorial Algorithms, Springer International Publishing, 2014, pp. 213-225.
- D. J. Abraham, R. W. Irving, and D. F. Manlove, “The student-project allocation problem,” in Algorithms and Computation, Springer Berlin Heidelberg, 2003, pp. 474-484.
- D. J. Abraham, R. W. Irving, and D. F. Manlove, “Two algorithms for the student-project allocation problem,” Journal of Discrete Algorithms, vol. 5 no. 1, pp. 73-90, 2007.
- D. F. Manlove, and G. O'Malley, “Student-project allocation with preferences over projects,” Journal of Discrete Algorithms, vol. 6 no. 4, pp. 553-560, 2008.
- K. Iwama, S. Miyazaki, and H. Yanagisawa, “Improved approximation bounds for the student-project allocation problem with preferences over projects,” Journal of Discrete Algorithms, vol. 13 pp. 59-66, 2012.
- P. R. Harper, V. de Senna, I. T. Vieira, and A. K. Shahani, “A genetic algorithm for the project assignment problem,” Computers & Operations Research, vol. 32 no. 5, pp. 1255-1265, 2005.
- M. M. El-Sherbiny, and Y. M. Ibrahim, “An artificial immune algorithm with alternative mutation methods: applied to the student project assignment problem,” in International Conference on Innovation and Information Management (ICIIM2012), Chengdu, China, January, 2012.
- L. Pan, S. C. Chu, G. Han, and J. Z. Huang, “Multi-criteria student project allocation: a case study of goal programming formulation with DSS implementation,” in The Eighth International Symposium on Operations Research and Its Applications (ISORA’09), Zhangjiajie, China, September , 2009 pp. 75-82.
- D. G. Cattrysse, and L. N. Van Wassenhove, “A survey of algorithms for the generalized assignment problem,” European Journal of Operational Research, vol. 60 no. 3, pp. 260-272, 1992.
- D. A. Singh, E. Leavline, R. Priyanka, and P. Priya, “Dimensionality reduction using genetic algorithm for improving accuracy in medical diagnosis,” I.J. Intelligent Systems and Applications, vol. 8 no. 1, pp. 67-73, 2016.
- Y. Wang, and N. Ishii, “A genetic algorithm and its parallelization for graph matching with similarity measures,” Artificial Life and Robotics, vol. 2 no. 2, pp. 68-73, 1998.
- H. O. Salami, and M. A., Ahmed, “Class diagram retrieval using genetic algorithm,” in Proceedings of the 12th International Conference on Machine Learning and Applications (ICMLA 2013), Miami, Florida, Dec 2013, pp. 96 – 101.
- H. O. Salami, and M. A., Ahmed, “Retrieving sequence diagrams using genetic algorithm," in Proceedings of the 11th International Joint Conference on Computer Sciences and Software Engineering (JCSSE 2014), Chonburi, Thailand, May 2014, pp. 324 – 330.
