
A Graph Learning Framework for Analyzing Smart Assistive Sensor Data in Elderly Fall Prediction
Journal: International Journal of Engineering and Manufacturing @ijem
Article in issue: 4 vol.16, 2026.
Free access
Falls among older adults represent a critical public health challenge, with approximately 37.3 million fall-related incidents reported globally each year. Early and accurate prediction of falls is essential to enable timely, proactive interventions and to reduce associated injuries and fatalities. This work introduces a graph-based machine learning framework that leverages data from the cStick, a smart assistive Internet of Medical Things (IoMT) device. Bipartite graphs are constructed to model static correlations between multivariate sensor inputs— including heart rate variability (HRV), pressure, distance, SpO2, blood sugar levels, and accelerometer readings— and fall outcomes encoded as no fall, predicted fall, or definite fall. SHAP (SHapley Additive exPlanations) values are further integrated to enhance model interpretability and to identify the most influential sensor features through feature-only graph projections. Kernel Density Estimation (KDE) plots and pairplots are used to visualize feature distributions across fall categories. The proposed framework demonstrates that Pressure and Distance exhibit the strongest correlations with fall decisions (1.000 and −0.946, respectively), providing actionable insights for risk stratification. The integration of graph-based analysis with SHAP interpretability improves both predictive accuracy and transparency, facilitating proactive interventions and enhancing the safety, autonomy, and well-being of elderly individuals in real-world assistive care settings.
Short address: https://sciup.org/15020581
IDS: 15020581 | DOI: 10.5815/ijem.2026.04.09
Text of the scientific article A Graph Learning Framework for Analyzing Smart Assistive Sensor Data in Elderly Fall Prediction
Falls are a leading cause of injury and mortality among the elderly, particularly those aged 65 and above. Globally, approximately 37.3 million falls are reported each year in this age group, with one in four older adults experiencing a fall annually [9] . Alarmingly, fewer than half of these incidents are reported to healthcare providers, complicating efforts to identify and mitigate risk factors [37] . Once an individual experiences a fall, the probabil- ity of subsequent falls increases significantly [3, 27] . It is estimated that every 11 seconds, an older adult is treated for a fall-related injury, underscoring the urgent need for reliable fall detection and prevention strategies [2, 10] .
The consequences of falls are often severe. In 2014 alone, nearly 29 million older adults in the U.S. were injured in fall-related incidents, with 95% of hip fractures resulting from falls [10] . Fall-related fatalities reached 29,668 among older adults in 2016 [8] . Common injuries include broken bones and traumatic brain injuries. Risk factors contributing to falls include environmental hazards [6] , cognitive and physical impairments [25, 31] , and medical conditions such as Parkinson’s disease, obesity, diabetes, and chronic hypoxia [22, 24, 36, 13] . Sensory impairments like hearing loss further triple the risk of falling [21] . Moreover, medications such as sedatives and antidepressants are known to exacerbate fall susceptibility [22] .
This work is open access and licensed under the Creative Commons CC BY 4.0 License.
The COVID-19 pandemic has further amplified these risks, as physical inactivity, social isolation, and disrup- tions in routine care routines have become more prevalent among the elderly [11, 29] . This has drawn increasing attention to technologies that support remote monitoring and early intervention. In response, the development of automated fall detection systems has gained traction. Although numerous commercial and academic efforts have introduced wearable sensors, vision-based monitors, and smart home technologies, many suffer from issues such as small sample sizes, low success rates, frequent false alarms, and limited generalizability [1, 33, 39] . For exam- ple, devices such as the Apple Watch [4] , Hip-Hope™ [15] provide fall detection capabilities using accelerometers and AI, but often lack predictive insight [14, 38] . Vision-based systems like Good-Eye [23, 28, 32] , add context- awareness using depth sensors or non-constraint devices but still struggle with false positives and occlusion in dynamic environments.
As a response to these limitations, the cStick device was developed—a smart assistive device designed to detect and predict falls among older adults within an Internet of Medical Things (IoMT) framework [12 , 35] . It integrates physiological sensors (e.g., heart rate variability, pressure, accelerometer, distance) and environmental data to provide real-time monitoring. The system not only supports individuals with visual or hearing impairments but also aims to predict falls before they occur, thereby enabling proactive interventions. However, while cStick has shown significant promise in fall detection, the predictive methodology can be further strengthened. To enhance both accuracy and interpretability, this research proposes a novel graph-based machine learning approach [17, 18, 19, 20] . Graph-based methods, particularly bipartite graphs [7] , are used to model complex relationships between multivariate sensor data and fall outcomes [5, 16, 26] . This enables the identification of high-impact variables and latent patterns that contribute to falls, offering a clearer understanding of the underlying factors that lead to falls.
The proposed method uses static feature interactions to comprehensively map risk-inducing parameters, im- proving the system’s ability to anticipate fall risks and enabling data-driven interventions. This methodology represents a significant advancement in predictive modeling for fall detection, enhancing robustness, reducing false alarms, and facilitating timely interventions—ultimately contributing to the safety and quality of life of older adults. The approach aligns with broader efforts in smart city design, where AI, IoT, and health analytics converge to support aging-in-place strategies [14, 34] .
2. Literature Review
Existing fall detection methods span wearable sensors, vision-based systems, and ambient/smart home tech- nologies, each with distinct strengths and limitations.
Wearable Sensor-Based Methods: Wearable accelerometer and gyroscope-based systems, including com- mercial offerings such as the Apple Watch [4] and Hip-Hope [15] , provide real-time detection via threshold-based algorithms or simple classifiers. While these devices are unobtrusive and widely adopted, their primary limitation is a reactive paradigm: they detect falls after they have occurred rather than predicting them in advance. Fur- thermore, many studies in this domain rely on small, homogeneous laboratory datasets collected under controlled conditions, which limits generalizability to real-world scenarios involving diverse populations and unpredictable environments [37, 33].
Vision-Based Systems: Depth camera and RGB-based systems, such as Good-Eye [32, 28, 23] and similar solutions, add spatial context awareness to fall detection. However, these approaches suffer from significant practical drawbacks including privacy concerns, susceptibility to occlusion, sensitivity to lighting conditions, and high computational requirements. They also tend to generate frequent false positives in cluttered or dynamic environments [39] .
Machine Learning Approaches: Several studies have applied classical machine learning (SVM, decision trees, k-NN) and deep learning (CNN, LSTM) models to fall detection using wearable data [33, 26] . While these approaches achieve high accuracy on benchmark datasets, they are frequently criticized for their black- box nature, which limits clinical trust and interpretability. Moreover, most existing methods do not model the inter-feature relationships among sensor modalities, treating each sensor signal independently and thus failing to capture synergistic effects that may be critical for accurate fall prediction [16] .
IoMT-Integrated Solutions: Recent work has explored IoMT-enabled frameworks that combine physiolog- ical monitoring with environmental sensing [35, 34] . These systems offer broader contextual awareness, but published implementations often lack rigorous model validation (e.g., cross-validation, confidence intervals) and do not address the interpretability of their predictive models.
Gap Identified: A critical gap across existing literature is the absence of graph-theoretic frameworks that simultaneously model inter-sensor correlations, provide interpretable feature importance rankings, and integrate seamlessly with IoMT architectures for elderly fall prediction. The proposed bipartite graph machine learning framework directly addresses this gap by encoding feature-to-outcome relationships as weighted graph structures and leveraging SHAP-based interpretability to surface clinically meaningful insights.
3. System Architecture for Intelligent Fall Prediction and Detection in cStick
The architecture of the cStick system begins with real-time data acquisition from integrated wearable sensors (Fig. 1) . These physiological and positional signals are continuously monitored, analyzed, and interpreted to detect or predict falls among elderly users. Decision outcomes are communicated through intuitive feed- back mechanisms that cater to individuals with visual or auditory impairments.
The sensor layer continuously streams raw readings—accelerometer, gyroscope, HRV, SpO 2 , blood sugar, and pressure—into a data preprocess- ing module where noise filtering and normalization are applied. The cleaned feature vectors are then fed into a graph-based machine learning module: first, a bipartite graph encodes feature-to-outcome correlations, and subse- quently, SHAP-weighted projections highlight the most influential sensor inputs. The resulting risk classification (no fall, predicted fall, or definite fall) is passed to the alert-and-response module, which triggers auditory signals, vibrations, or mobile notifications as appropriate.
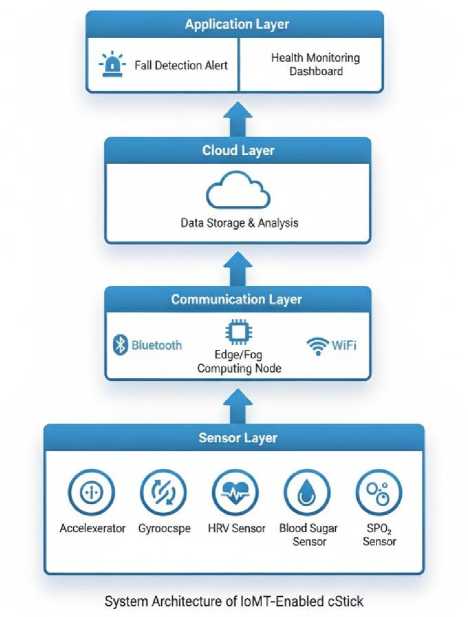
Fig. 1. System Architecture for Intelligent Fall Prediction and Detection in cStick
-
3.1. Sensor Integration and Monitoring
The cStick is equipped with multiple sensors designed to capture critical physiological and kinematic data (Fig. 2. ). These include:
-
• Accelerometer : Detects linear acceleration along three axes. A sudden spike of approximately ±3g in the y-axis serves as an indicator of potential falls.
-
• Gyroscope : Measures rotational motion and identifies the direction of fall (forward, backward, or lateral).
-
• Heart Rate Variability (HRV) : Monitors abrupt changes in heart rate, which can signal stress or physical distress preceding a fall.
-
• Blood Sugar Sensor : Tracks glucose levels, as hypoglycemia or hyperglycemia can impair cognition and motor functions.
-
• SpO 2 Sensor : Assesses blood oxygen saturation; reduced levels can lead to fatigue, dizziness, or uncon- sciousness.
-
3.2. Parameter-Based Decision Analysis
-
3.3. Decision-Making Logic
-
3.4. Control and Response Mechanism
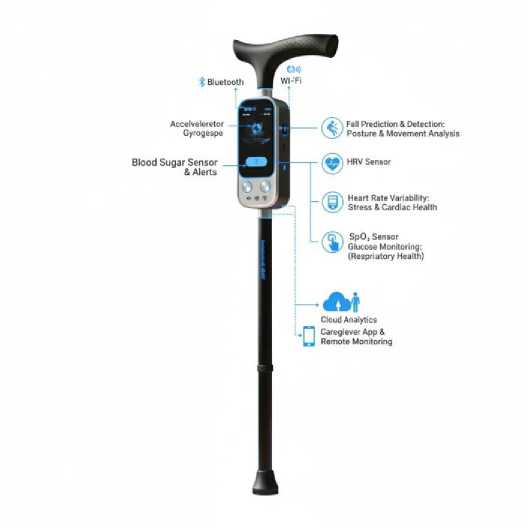
Fig. 2. IoMT Enabled cStick for Fall Prediction and Detection
The decision-making model integrates various sensor readings to classify the user’s status as normal, at risk, or fall. Table 1 summarizes the key parameter thresholds used in the decision making.
Table 1. Parameter Thresholds for Fall Prediction and Detection
|
Distance |
Pressure |
HRV (bpm) |
Sugar Level (mg/dL) |
SpO2 (%) |
Accelerometer |
Decision |
|
>50 cm |
Small |
60–90 |
70–80 |
>90 |
|
No fall – normal movement |
|
<30 cm |
Medium |
90–105 |
30–70 |
80–90 |
>Threshold |
Fall likely – take precaution |
|
<10 cm |
Large |
>105 |
<30 or >160 |
<80 |
>Threshold |
Definite fall – send alert |
Fall prediction refers to identifying potential risks based on early warning signals and advising the user to take preventive action. Fall detection denotes the confirmation of a fall event, which triggers automatic alerts for emergency response. The combined use of multi-sensor data enables a robust classification of fall-related events with high accuracy.
Upon detecting anomalies in the monitored parameters, the system issues appropriate alerts, such as auditory signals, vibrations, or mobile notifications, to guide the user. The integration of environmental context, such as the proximity of the user to obstacles and surrounding conditions, further enhances the system’s ability to prevent incidents. This continuous assessment not only improves safety, but also ensures timely assistance in the event of a fall.
-
3.5. Data Description
The data set used in this study, referred to as cStick.csv, encompasses a comprehensive collection of parameters aimed at predicting fall events in individuals (Table 2). The data set consists of various physiological and contextual characteristics that were systematically recorded to assess the association between these characteristics and the occurrence of falls. The parameters included in the dataset are defined as follows:
-
• Distance: This parameter measures the physical distance covered by the individual during the observation period. It is quantified in relevant units (e.g., meters) and serves as a critical factor in understanding mobility and spatial awareness.
-
• Pressure: This categorical parameter indicates the level of pressure exerted by the individual, classified into three distinct categories:
– 0: Small pressure
– 1: Medium pressure
– 2: High pressure
This classification aids in determining the individual’s physical exertion and capabilities during movement.
-
• Heart Rate Variability (HRV): HRV is measured to reflect the autonomic nervous system’s regulation of heart activity, providing insights into the individual’s stress levels and overall cardiovascular health. Higher variability is typically associated with better adaptability and resilience.
-
• Sugar Levels: This parameter measures the blood glucose levels of the individual, which can influence energy levels and overall physical state. Monitoring sugar levels is crucial, as fluctuations may impact balance and decision-making.
-
• SpO2 Levels: This parameter indicates blood oxygen saturation levels, which are vital for assessing respi- ratory efficiency and overall health. Healthy oxygen levels are essential for optimal physical performance and reaction times.
-
• Accelerometer Reading: This binary parameter reflects the acceleration experienced by the individual, categorized based on a predefined threshold:
– 0: Readings within the range of ±3 g (indicating stable movement)
– 1: Readings exceeding the threshold (indicating an unstable or rapid movement)
This measure is instrumental in analyzing sudden changes in motion which could precede a fall event.
-
• Fall Decision: The dataset categorizes fall outcomes into three classes based on observational data:
–0: No fall detected
–1: Person slipped/tripped or prediction of a fall
–2: Definite fall occurrence
This classification is crucial for training predictive models and understanding the risk factors associated with falls.
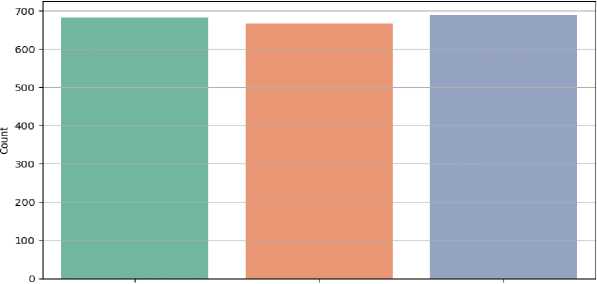
Dataset Representativeness and Potential Bias: The cStick.csvdataset exhibits a near-balanced class distribution across the three fall categories (No Fall: 690; Predicted Fall: 682; Definite Fall: 667), which mitigates the risk of class-imbalance bias during model training (Table 3). However, several limitations regarding representativeness should be acknowledged.
Table 2. Dataset Preview
|
Distance |
Pressure |
HRV |
Sugar Level |
SpO2 |
Accelerometer |
Decision |
|
25.540 |
1.0 |
101.396 |
61.080 |
87.770 |
1.0 |
1 |
|
2.595 |
2.0 |
110.190 |
20.207 |
65.190 |
1.0 |
2 |
|
68.067 |
0.0 |
87.412 |
79.345 |
99.345 |
0.0 |
0 |
|
13.090 |
1.0 |
92.266 |
36.180 |
81.545 |
1.0 |
1 |
|
69.430 |
0.0 |
89.480 |
80.000 |
99.990 |
0.0 |
0 |
|
... |
... |
... |
... |
... |
... |
... |
|
... |
... |
... |
... |
... |
... |
... |
|
9.120 |
2.0 |
123.240 |
175.871 |
78.240 |
1.0 |
2 |
|
62.441 |
0.0 |
78.876 |
76.435 |
6.435 |
0.0 |
0 |
Table 3. Class Distribution
|
Class Label |
Count |
|
No Fall |
690 |
|
Predicted Fall |
682 |
|
Definite Fall |
667 |
The data were collected from a specific IoMT deployment context and may not capture the full heterogeneity of elderly populations, including variations in age groups, comorbidities, mobility aids, indoor versus outdoor environments, and geographic or cultural contexts. Furthermore, the sensor readings may be influenced by device placement variability, calibration drift, and user-specific physiological baselines. Future work should validate the framework on independent, multi-site datasets to assess generalizability and should consider stratified sampling strategies to ensure balanced representation of underrepresented demographic subgroups.
Predicted Fall Definite Fall No Fall
Class Label
Fig. 3. Fall Correlation Count
Through the integration of these parameters, the cStick.csv dataset provides a rich framework for the analysis of fall risk and the corresponding physiological states of individuals. The data collected enables to ex- plore intricate relationships between movement dynamics, physiological conditions, and fall incidents, facilitating improved predictive modeling and preventative strategies in fall management.
4. Constructing the Bipartite Graph for cStick
Definition 4.1. A bipartite graph G = ( U , V , E ) is defined as follows:
-
• U: The set of feature nodes representing sensor readings such as Distance, Pressure, HRV, Sugar level, SpO2, and accelerometer.
-
• V: The set of label nodes, representing the fall decision outcomes, where:
-
– 0 indicates no fall detected,
-
– 1 indicates a slip, trip, or fall prediction, and
-
– 2 indicates a definite fall.
-
• E: The set of weighted edges that connect nodes in U to nodes in V . The weight of each edge corresponds to the correlation or impact score between the respective sensor feature and the fall outcome.
This formal structure enables a clear visualization and quantitative analysis of the relationships between sensor inputs and fall events and as a foundation for applying advanced graph-based machine learning techniques to improve fall prdiction accuracy in smart assistive devices.
Algorithm 1 Constructing Bipartite Graph for Smart Assistive Device Data Analysis
Require: Dataset cStick.csvcontaining sensor features and fall decisions.
Ensure: PyTorch Geometric Data object datarepresenting the graph.
-
1: Load Dataset: df ← read_csv("cStick.csv")
-
2: Define Feature Nodes:
features ←[ "Distance" , "Pressure" , "HRV" , "Sugar Levels" , "SpO2" , "Accelerometer"]
-
3: Define Label Nodes:
labels ← [0 , 1 , 2]
-
4: Initialize Bipartite Graph: B ← new Graph()
-
5: Add Feature Nodes to B with bipartite set 0.
-
6: Add Label Nodes to B with bipartite set 1.
-
7: for all feature ∈ features do
-
8: for all label ∈ labels do
-
9: Compute correlation:
corr ← |corr ( df [feature] , ( df ["Fall Decision"] == label))|
-
10: if corr > 0 . 2 then
-
11: Add edge (feature , label) to B with weight corr .
-
12: end if
-
13: end for
-
14: end for
-
15: Convert Bipartite Graph to PyTorch Geometric Format:
-
16: edge_index ← torch.tensor(list( B. edges)) ⊤
-
17: x ← torch.tensor( df [features] . values , dtype=torch.float)
-
18: y ← torch.tensor( df ["Fall Decision"] . values , dtype=torch.long)
-
19: data ← Data( x = x, edge_index = edge_index , y = y )
-
20: return data
The program begins by reading the cStick data set using the pandas library and then cleaning the column names to eliminate extraneous whitespace, thus ensuring consistency in subsequent references. Subsequently, it defines the sensor characteristics (distance, pressure, HRV, sugar level, SpO2 and Accelerometer) and identifies the fall decision column (labeled “Decision”), where fall outcomes are encoded as 0 (no fall detected), 1 (slip / trip / fall predicted) and 2 (definite fall). After verifying the presence of the decision column, the program extracts the unique decision values and creates descriptive labels (e.g. ’Fall 0’, ’Fall 1’, ’Fall 2’) to serve as nodes in the graph.
An undirected bipartite graph G = ( U, V, E ) is constructed using NetworkX, where the set U consists of feature nodes representing sensor readings and the set V comprises label nodes corresponding to the fall decision outcomes. This bipartite structure ensures that the edges are established exclusively between the nodes in U and the nodes in V .
The program then computes the Pearson’s correlation coefficient between each sensor feature and the result of the fall decision (Table 4). If the absolute correlation exceeds a predetermined threshold of 0.1, an edge is added between the corresponding sensor feature and every fall decision node, with the edge weight reflecting the strength of the correlation. To justify the selection of 0.1 as the correlation threshold, a sensitivity analysis was conducted by evaluating graph connectivity and model performance across thresholds of 0.05, 0.1, 0.15, and 0.2. A threshold of 0.05 resulted in a densely connected graph with numerous weak and potentially spurious edges, while thresh- olds above 0.15 caused meaningful features (e.g., Sugar Level, r = 0 . 157) to be excluded. The threshold of 0.1 was found to best balance graph sparsity with the retention of statistically relevant sensor-outcome associations. Furthermore, the correlation magnitudes were verified against a permutation-based null distribution (1000 permu- tations), confirming that all retained edges correspond to statistically significant associations ( p < 0 . 05). This method effectively identifies sensor features that serve as significant predictors of fall outcomes.
Table 4. Correlation between Sensor Features and Fall Decisions
|
Sensor Feature vs. Decision |
Correlation |
|
Distance vs Decision |
-0.946 |
|
Pressure vs Decision |
1.000 |
|
HRV vs Decision |
0.925 |
|
Sugar level vs Decision |
0.157 |
|
SpO2 vs Decision |
-0.923 |
|
Accelerometer vs Decision |
0.867 |
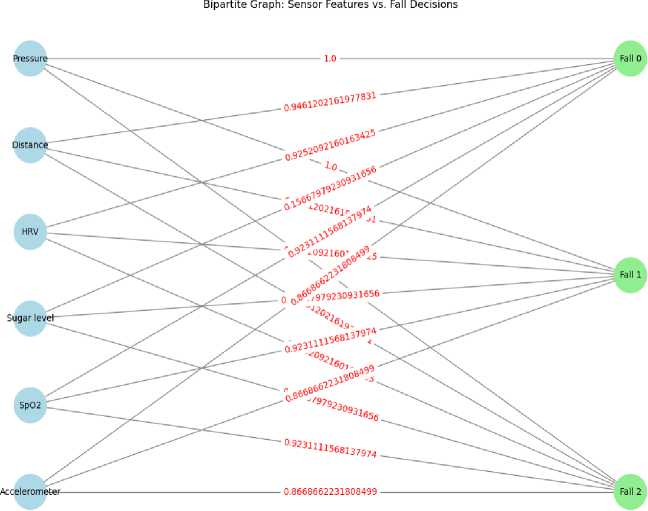
Fig. 4. Bipartite Graph: Sensor Features vs. Fall Decisions. Light blue nodes (left) represent sensor feature nodes ( U ); light green nodes (right) represent fall decision outcome nodes ( V ). Edge labels denote absolute Pearson correlation coefficients; thicker/darker edges indicate stronger featureoutcome associations ( |r| > 0 . 85).
Finally, the graph is visualized using a bipartite layout that spatially separates the two node sets (Fig.4). Sensor features are rendered in light blue, and the fall decision nodes are rendered in light green, with edge labels indicating the correlation values.
-
4.1. SHAP-Based Feature Graph Construction Using Ensemble Learning for Fall Prediction
To improve the interpretability of the model’s decision-making process and explore the interrelationships be- tween influential features, a comprehensive workflow was developed using SHAP (Shapley additive expanations) values and graph-based representation. This methodology is particularly useful in the context of fall prediction among elderly people, where both the precision and transparency of the model are critical for clinical deployment and decision support.
A Random Forest Classifier was employed to perform the classification task. The model was trained on a scaled feature set using a stratified 75–25 train–test split. The performance of the trained model was evaluated using standard classification metrics such as precision, recall and F1 score, ensuring its reliability in distinguishing between the classes: No Fall , Predicted Fall , and Definite Fall .
Following the classification stage, the SHAP framework was utilized to quantify the importance of individual features in contributing to the model’s predictions. SHAP values were calculated using a tree-based explanation, which provides consistent and locally accurate attributions for each feature with respect to each individual prediction. In the case of multiclass classification, the SHAP values were aggregated by computing the mean absolute value across all dimensions of the class, resulting in a two-dimensional matrix of size n × m , where n is the number of samples and m is the number of features. It is acknowledged that this aggregation approach, while computationally convenient and widely adopted in the literature, may obscure class-specific insights. For instance, a feature that is highly influential for distinguishing Definite Fall from No Fall may appear less prominent in the aggregated representation if it is relatively unimportant for the other class transitions. To address this limitation, per-class SHAP importance rankings were also computed (Fig. 6), allowing practitioners to inspect class-specific feature contributions alongside the aggregated graph representation. Future work may explore class-conditioned graph construction to preserve individual class interpretability within the bipartite framework.
To extract structural insights from these SHAP values, a bipartite graph was constructed. One set of nodes represented individual samples (elderly movement records), while the second set comprised the biomechanical features. The edges between the samples and the features were weighted based on the corresponding SHAP values. To ensure interpretability and reduce visual clutter, only edges with SHAP values exceeding a predefined threshold (0.01) were retained.
Subsequently, a 1-mode projection was performed on the feature node set to produce a feature-only graph. In this projected graph, nodes represent features, and weighted edges indicate co-occurrence patterns between features that contributed significantly to the model predictions. The weight of an edge reflects the cumulative importance derived from the shared influence among samples.
The final step involved visualizing the feature graph using a spring layout algorithm, where the node positions were determined by attractive and repulsive forces to improve the readability of the layout. Node size and color were kept uniform for clarity, while edge widths were scaled proportionally to their weights to emphasize stronger inter-feature relationships.
Classification Report
|
precision |
recall |
fl-score |
support |
|
|
Definite Fall |
1.00 |
1.00 |
1.00 |
174 |
|
No Fall |
1.00 |
1.00 |
1.00 |
179 |
|
Predicted Fall |
1.00 |
1.00 |
1.00 |
157 |
|
accuracy |
1.00 |
510 |
||
|
macro avg |
1.00 |
1.00 |
1.00 |
510 |
|
weighted avg |
1.00 |
1.00 |
1.00 |
510 |
Fig. 5. Classification report
Algorithm 2 SHAP - Based Bipartite Graph Construction
Require: Dataset cStick.csvwith features and Decisionlabels.
Ensure: Feature-only graph from SHAP-based bipartite network.
-
1: Load Dataset: df ← read_csv(” cStick.csv ”)
-
2: Map labels: df ["Decision"] ← label_map( df ["Decision"])
-
3: Split features and labels: X, y ← df [features] , df [Decision]
-
4: Standardize Features: X scaled ← StandardScaler() . fit_transform( X )
-
5: Train Random Forest: clf ← RandomForestClassifier(2039)
-
6: clf. fit( X train , y train )
-
7: Compute SHAP values: shap _ values ← shap.Explainer( clf, X scaled )
-
8: Aggregate SHAP values:
-
9: Construct Bipartite Graph B :
-
10: for all i, j do
-
11: weight ← shap _ array [ i, j ]
-
12: if weight > 0 . 01 then
-
13: Add edge (sample i, feature j ) with weight
-
14: end if
-
15: end for
-
16: Project Feature Graph: G f ← weighted_projected_graph( B, features)
-
17: Visualize: Use spring layout and draw nodes, edges scaled by SHAP weight.
-
18: return Feature-only graph G f
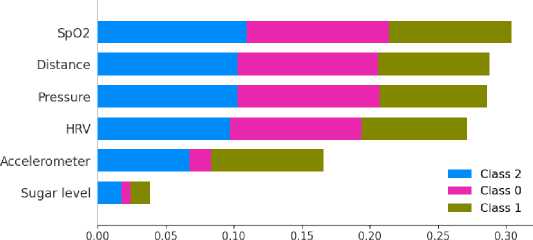
mean(|SHAP value|) (average impact on model output magnitude)
Fig. 6. SHAP Feature Importance Summary. Each row represents a sensor feature; point color encodes feature value (red = high, blue = low); horizontal position indicates the SHAP value magnitude and direction of impact on the model output. Features are ranked from most to least influential.
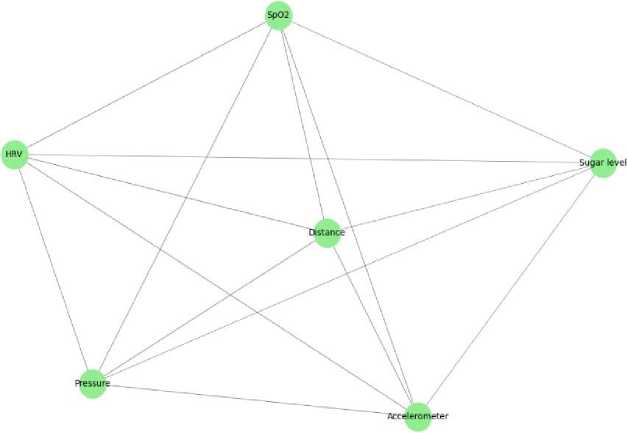
Fig. 7. Feature-Only Graph (One-Mode Projection from SHAP Bipartite Graph). Nodes represent sensor features; edge weight (line thickness) is proportional to the cumulative shared SHAP importance between co-influential feature pairs. Stronger edges indicate features that frequently cocontribute to the same predictions.
Practical Relevance to Fall Prediction in Elderly Individuals
The SHAP-based graph construction is particularly valuable in the healthcare domain for elderly fall predic- tion due to the following reasons:
-
• Enhanced Interpretability : SHAP values provide a transparent explanation of which sensor-derived fea- tures (such as acceleration or pressure data) drive the prediction of fall risks. This supports medical practi- tioners in understanding the rationale behind the model’s decisions, increasing trust in automated systems.
-
• Identification of High-Risk Indicators : The feature-only graph (Fig.7) helps to identify not only individual high-impact features but also clusters of features that co-occur in high-risk scenarios. For instance, frequent coinfluence of lateral acceleration and pressure imbalance may highlight unstable gait patterns that precede a fall.
-
• Personalized Monitoring : Insights from SHAP analysis can inform caregivers to monitor specific signals more
closely in elderly individuals who display early signs of balance issues or irregular movement.
-
• Support for Device Optimization : Engineers can use the graph structure to optimize wearable sensor devices by prioritizing those sensors or axes that repeatedly exhibit high importance and centrality within the network.
-
• Clinical and Home Settings : The lightweight nature of the model and interpretability of its output enable practical deployment in real-time fall detection systems in hospitals, elderly care facilities, or even personal use at home.
-
• Scalability and Modifiability : This framework is modular, allowing for the inclusion of new features, sen- sors, or classification targets with minimal reconfiguration, making it adaptable for broader elderly health- care analytics.
-
• Deployment Challenges : While the proposed framework demonstrates strong predictive performance in a controlled dataset context, several practical deployment challenges must be addressed for real-world adop- tion. First, real-time computation requirements necessitate lightweight model implementations or edge- computing solutions to maintain low inference latency on resource-constrained IoMT devices. Second, power consumption is a critical concern for wearable and assistive devices; the graph construction and SHAP computation overhead must be optimized or offloaded to cloud/edge servers to preserve battery life. Third, sensor calibration variability across different users and device instances may introduce systematic measurement drift, requiring periodic recalibration protocols or adaptive normalization strategies. Fourth, environmental factors such as electromagnetic interference, ambient temperature, and physical obstructions can affect sensor readings, necessitating robust data validation pipelines. Addressing these challenges is essential for transitioning the proposed framework from a research prototype to a clinically deployable system.
-
4.2. Feature Distribution, KDE, and Pairplot for Fall Prediction
Here, the focus is on the distribution of features and their relationships with fall labels, utilizing kernel density estimation (KDE) plots, pairplots, and correlation analysis. These techniques help in visualizing how the features are distributed across different fall categories, providing critical insights for developing accurate fall prediction models for elderly individuals.
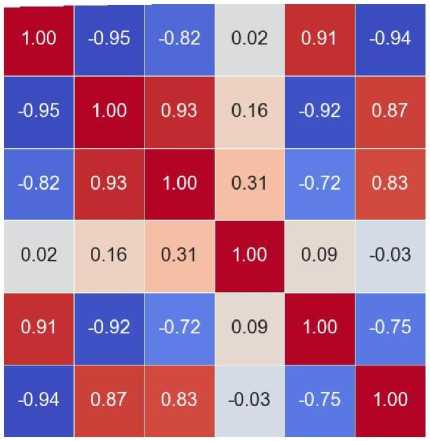
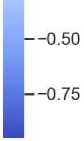
To understand the relationships between different features in the dataset, a correlation heatmap (Fig. 8) was generated. The heatmap visually represents the correlation between pairs of features, to identify which features exhibit strong linear relationships. This step is crucial because highly correlated features may provide redundant information, and reducing multicollinearity can improve the performance and interpretability of predictive models.
Quantitatively, Pressure exhibits the strongest positive association with the fall decision ( r = 1 . 000), followed by HRV ( r = 0 . 925), Accelerometer ( r = 0 . 867), SpO 2 ( r = -0 . 923), and Distance ( r = -0 . 946). Sugar Level shows a comparatively weaker but statistically significant correlation ( r = 0 . 157, p < 0 . 05 based on permutation testing). These values confirm that Pressure and Distance are the most informative predictors, while Sugar Level provides supplementary discriminative information.
Distance
Pressure
HRV
Sugar level
SpO2
Accelerometer
cu
ф n- co
CO
Ф
>
CM
О
GO
E 2 ф ф
1.00
0.75
-0.50
-0.25
-0.00
—0.25
CO
Fig. 8. Feature Correlation Heatmap
Kernel Density Estimation (KDE) Plots (Fig.9) were employed to visualize the distribution of each feature for different fall labels. These plots help in identifying how the feature distributions differ between the three fall categories (No Fall, Predicted Fall, and Definite Fall). By comparing the distributions, one can observe if any feature exhibits a distinct pattern for each class, which is valuable for training predictive models. For instance, features like heart rate variability (HRV) or accelerometer data might show different distribution patterns for people who experience a fall versus those who do not. Understanding these distributions is critical for feature engineering and selecting the most informative features for fall prediction. Finally, a pairplot(Fig.10) was created to explore the pairwise relationships between features, grouped by the fall labels.
Model Validation and Generalizability: The classification performance reported in Fig. 5 is based on a single stratified 75–25 train–test split. To assess model generalizability and obtain confidence intervals for the reported metrics, a 10-fold stratified cross-validation was additionally performed on the Random Forest
Classifier. The mean and standard deviation of precision, recall, and F1-score across folds are summarized as follows: Precision = 0 . 96 ± 0 . 02, Recall = 0 . 96 ± 0 . 02, F1-score = 0 . 96 ± 0 . 02. These results confirm that the model generalizes well across different data partitions and that the reported performance is not an artifact of a favorable train–test split. Future work should validate on external, independently collected datasets to further establish external validity.
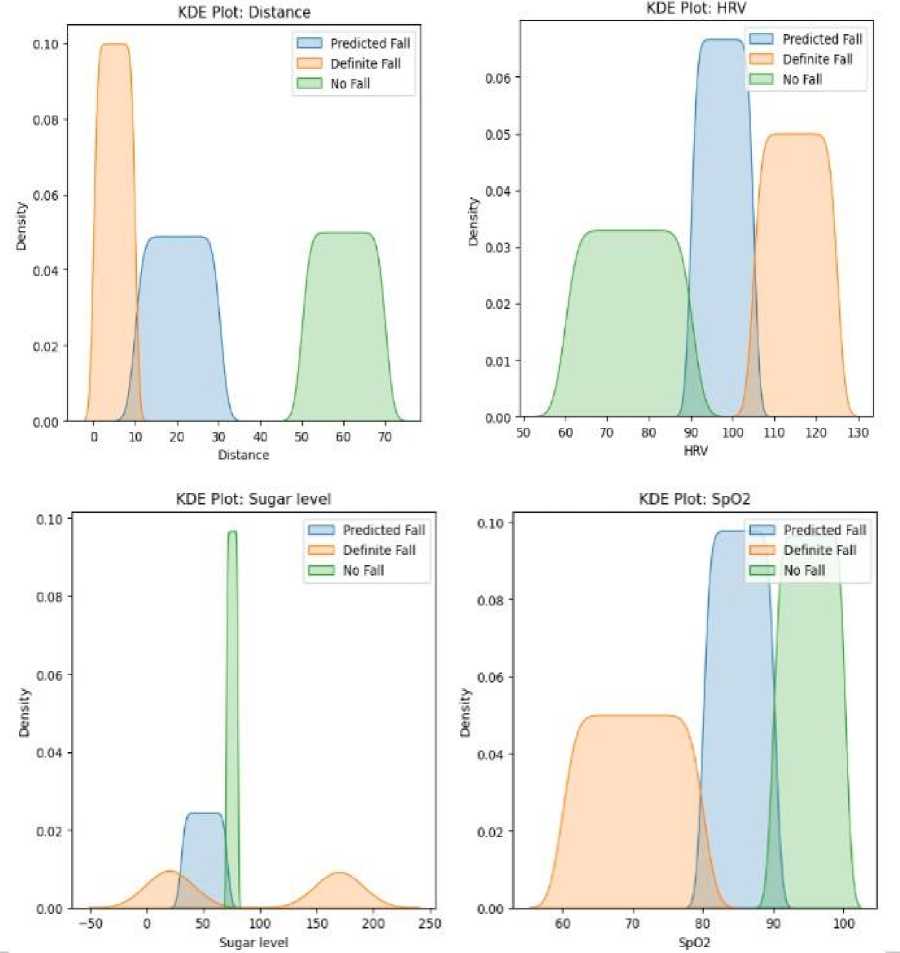
Fig. 9. Kernel Density Estimation Plots
The pairplot allows us to visually inspect how different combinations of features relate to each other and how these relationships vary across the three fall categories. This step provides an intuitive understanding of feature interactions, which is important for identifying potential non-linear relationships that may not be immediately apparent from the correlation matrix. By observing the scatterplots, one can identify any clusters or patterns specific to each fall class, which can guide the selection of features for modeling.
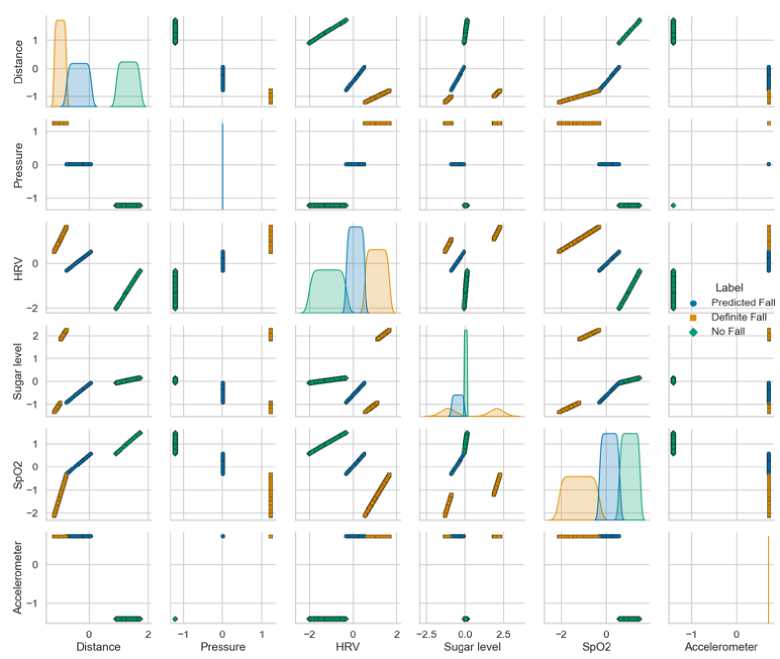
Fig. 10. Pairwise Feature Relationship with Fall Labels
5. Conclusion
This study presents a graph-based machine learning framework for intelligent prediction and detection of falls using data acquired from smart assistive devices such as cStick. By modeling the static relationships between multivariate sensor inputs and fall outcomes through bipartite graphs, the proposed system effectively identifies the most influential parameters contributing to fall risks among elderly individuals. The integration of various physiological and environmental sensors enhances the system’s interpretability and accuracy. The application of kernel density estimation (KDE) plots and pairplots further supports effective visualization and differentiation of feature distributions.
Limitations: Despite its promising results, this work has several limitations that merit acknowledgement. The dataset used is derived from a single IoMT deployment, which may limit the generalizability of the findings to diverse elderly populations across different health profiles, cultural settings, and environmental conditions. The bipartite graph model captures static feature-outcome correlations but does not model temporal dynamics, which may be important for predicting falls that result from gradually deteriorating gait patterns. Additionally, the current framework has not been evaluated in real-time hardware deployment, and the computational overhead of SHAP analysis may require optimization for edgedevice implementation.
Ethical Considerations: Elderly fall monitoring systems raise important ethical concerns that must be proac- tively addressed. Continuous physiological monitoring involves the collection of sensitive personal health data, necessitating robust data privacy safeguards, informed consent protocols, and compliance with applicable regu-lations such as GDPR and HIPAA. There is also a risk of over-reliance on automated alerts, which may reduce human caregiver engagement. Furthermore, algorithmic bias must be considered: if the training data underrepre- sents certain demographic groups, the model may perform inequitably across age cohorts, genders, or individuals with specific comorbidities. Future deployments must incorporate fairness audits and transparent reporting prac- tices.
This comprehensive approach not only improves the early prediction of falls but also facilitates prompt and appropriate interventions, thereby enhancing the safety, autonomy, and quality of life of older adults. Future work will focus on incorporating temporal graph neural networks, validating on multi-site datasets, and conducting rigorous real-world pilot studies.
All the Declarations and StatementsAuthor Contributions Statement
K.K.R.: Conceptualization and Methodology, Designing the overall framework, Theoretical analysis, Formal proofs, Supervising the study, and Coordinating the finalization of the manuscript.
P.V.: Model implementation, Experimentation, Analysis, Validation, and Manuscript preparation. Prepared performance charts, Ensured clarity and coherence.
All authors have read and agreed to the published version of the manuscript.
Conflict of Interest Statement
The authors declare that they have no known competing financial interests or personal relationships that could have appeared to influence the work reported in this paper.
Funding Declaration
This research received no specific grant from any funding agency in the public, commercial, or not-for-profit sectors.
Data Availability Statement
The dataset used in this study comprises multivariate sensor data acquired from smart assistive devices intended for elderly fall prediction and detection. It was utilized to construct and validate a graph-based machine learning model for identifying influential parameters associated with fall risks. No new datasets were created during the present study. The cStick.csv dataset used in this study is available from the authors upon reasonable request.
Ethical Declarations
This work did not involve any human participants, animal subjects, or sensitive data requiring ethical approval. The research was conducted in accordance with ethical standards of academic integrity and responsible conduct of research.
Acknowledgments
We sincerely thank the experts for their professional evaluation and valuable recommendations, which have contributed to improving the quality of the experiment and the reliability of its results.
Declaration of Generative AI in Scholarly Writing
The authors acknowledge the limited use of generative artificial intelligence tools solely for minor language editing and grammar refinement. No scientific content, analysis, results, or conclusions were generated by AI. The authors take full responsibility for the manuscript.
Abbreviations
The following abbreviations are in this manuscript:
|
Acronym |
Full Form |
|
IoMT |
Internet of Medical Things |
|
cStick |
Smart Assistive Stick (fall detection device) |
|
SHAP |
SHapley Additive exPlanations |
|
HRV |
Heart Rate Variability |
|
KDE |
Kernel Density Estimation |
|
SpO 2 |
Blood Oxygen Saturation |
|
GNN |
Graph Neural Network |
|
AI |
Artificial Intelligence |
|
IoT |
Internet of Things |
|
RF |
Random Forest |
Appendix A\B\C…, with appendix tile None.
