
AI-based Secure Cluster Formation and Reliable Data Transmission for Wireless Sensor Networks
Journal: International Journal of Information Technology and Computer Science @ijitcs
Article in issue: 4 Vol. 18, 2026.
Free access
Clustering in wireless sensor networks (WSNs) offers numerous desirable properties, including load balancing, energy conservation, and distributed key management. Secure Clustering requires it to detect compromised nodes and remove them from clusters during setup. Suppose some nodes are attacked and pass the filtering. In that case, they can modify some nodes to adopt a different clustering perspective, as well as initiate new clusters to degrade the overall cluster quality. To address these issues, a new method, Secretary Bird with Self-Organizing Maps (SBWSOM), has been designed to detect and eliminate malicious nodes while efficiently providing data. First, the appropriate sensor nodes were constructed in Python. Second, the malicious node was located and destroyed, and the Cluster Head (CH) was picked based on parameters such as remaining energy, network level, and base station (BS) location. Furthermore, the data rates of chosen CHs have been confirmed and sent to empty nodes. Lastly, the values compared and studied were Latency, throughput, packet delivery ratio (PDR), energy consumption, and transmission loss. The evaluation of this proposal demonstrated improved data transfer, with a throughput of 0.91, an energy consumption of 0.46 mJ, and a packet delivery ratio of 96.3%. Also, the transmit loss was 4.20%, and Latency was 6.04 ms. Overall, this method performed well, with significant improvement over previous models.
Short address: https://sciup.org/15020657
IDS: 15020657 | DOI: 10.5815/ijitcs.2026.04.03
Text of the scientific article AI-based Secure Cluster Formation and Reliable Data Transmission for Wireless Sensor Networks
Evolution is an application of networks that are deeply intertwined in terms of size, cost, and energy levels. The resource constraints in the sensor node design support varying environmental conditions and resource availability, thereby maintaining consistent network performance [1]. The deployment is often used for data that does not require frequent updates, as nodes are placed at the locations where data is acquired in specific areas [2]. This deployment enables real-time, accurate data collection, benefiting traffic applications [3]. Randomly placing environments can be cumbersome, and selecting optimal node locations can yield cost savings. There is a need for power-saving applications in sensor networks, and protocols must be developed that use less energy. These protocols must adapt to changing environmental conditions, including variations in resource availability, size, and cost [4]. AI clusters are based on wireless sensor network technology, which revolutionises the interaction between the environment and monitoring in healthcare and industrial automation [5]. AI Clusters are built on top of wireless sensor network technology, which is innovative in its integration with the environment to monitor health care and industrial automation. The field is highly complex due to the presence of unified communication standards, as vulnerable devices abound in IoT [6]. The fractured protocols and proliferation of tenacious unprotected endpoints are only adding to increased risk exposure.
This work is open access and licensed under the Creative Commons CC BY 4.0 License.
Given the fragmentation of this complex and challenging environment, it is well-suited for M2M [7]. Wireless local area networks (WLANs) enable devices to connect to required access points (APs) and internal or external routers. A significant challenge is designing networks that utilise minimal energy resources on sensor nodes [8]. Micro-electromechanical system technology, wireless communication, and digital electronics have all evolved dramatically in recent years, significantly improving the key technology required to create wireless sensor networks (WSN) [9]. WSNs are generally decentralised network applications consisting of a large number of sensor nodes that collect data from their surroundings [10].
WSN has potential applications in environmental monitoring, such as collecting data on various ecological variables, including humidity, pollution levels, and temperature [11]. Energy efficiency is a critical issue that needs to be addressed, as sensor nodes utilise finite, perhaps irreplaceable, energy sources that operate autonomously [12]. Researchers and engineers continually brainstorm methods to enhance the functionality of WSNs and address technological challenges [13]. Clustering enables direct routing or correlated transmission to the sink node, thereby saving energy. Among all alternative routing methods, cluster-based routing is the most effective way to transmit data within WSN nodes for multiple conflict resolutions [14]. Deep learning is a type of clustering method in bioinformatics that creates clusters integrated in terms of networked leaders [15]. A semi-supervised model of clustering traffic accurately based on the partial equivalence relationship of designed [16]. The clustering-based WSN model targets several performance parameters within wireless sensor networks (WSNs), including network lifetime, scalability, and energy consumption [17]. The energy-efficient hybrid clustering technique also referred to as EEHCT, is a hybrid clustering approach designed to reduce energy consumption during cluster creation. Distribution of the load among networks is also a consideration for increasing network heterogeneity [18].
Using AI algorithms to reduce network energy consumption is a significant advancement [19]. This approach minimises the transmission distance and node density, thereby enhancing the efficiency of wireless sensor networks (WSNs) [20]. The homomorphic mutual conversion mechanism for integers from floating-point numbers ensures a trade-off between coherence and practicality [21]. Modern applications of AI based on distributed systems are utilising on-edge computing WSA to perform data processing and achieve latency reduction with improved efficiency. The larger study of density-based clustering algorithms is a judgment based on the scope of the node [22]. WSN criteria include energy consumption, and cluster-based algorithms can support the routing protocols advocated for WSNs.
Research gap: Clustering and secure data transmission in Wireless Sensor Networks (WSNs) have received significant attention, but several key issues remain. Cluster head (CH) selection and energy efficiency are the main goals of most secure clustering techniques currently in use, with security treated as a secondary or static concern. Conventional approaches usually rely on cryptographic techniques or predefined trust thresholds, which are ineffective against insider and compromised-node attacks and do not dynamically adapt to evolving attack behaviors. Furthermore, many clustering methods do not account for reliable data transfer, optimal CH selection, and malicious node identification simultaneously within a single framework. Current AI-based methods either lack self-organizing capabilities, resulting in poor scalability and increased Latency, or exhibit excessive computational complexity, making them inappropriate for resource-constrained WSNs. Furthermore, most earlier studies assess performance using constrained measures and fail to adequately examine transmission loss and Latency in hostile environments. These shortcomings underscore the need for a lightweight, flexible, and secure AI-driven clustering architecture that can effectively identify malicious nodes, maximize CH selection, and ensure reliable data transfer with lower energy consumption and lower Latency. The key contributions of the research are follows,
• For Wireless Sensor Networks, a novel AI-based secure clustering architecture, called Secretary Bird with Self-Organizing Maps (SBWSOM), is presented to concurrently address security, energy efficiency, and reliable data transmission.
• SBWSOM is used to build an adaptive malicious node detection system that effectively identifies and removes compromised sensor nodes throughout the cluster creation process.
• To enhance load balancing and network longevity, a multi-parameter cluster head selection technique is developed that considers residual energy, network level, and base station proximity.
• To evaluate CH data rates and effectively transfer data to sink nodes, a dependable data transmission system is included, lowering transmission failures and packet loss.
• Using key parameters such as throughput, Latency, packet delivery ratio (PDR), energy consumption, and transmission loss, a thorough performance study is conducted, demonstrating notable improvements over current techniques.
• The usefulness of the suggested method for safe and effective WSN communication is validated by simulation results, which show that it provides faster throughput (0.91), lower energy consumption (0.46 mJ), reduced Latency (6.04 ms), and improved PDR (96.3%).
2. Literature Review
The structure of the organisation of the mentioned research study is as follows: Section 2 covers recent and relevant work. Section 3 describes the issue faced by conventional networks. Section 4 provides in-depth information about the model development technique. The outcomes of implementing the new method are reported in Section 5. The research discussion concludes in Section 6.
Recent related efforts are detailed below:
To improve communication effectiveness, scalability, and intelligent decision-making, recent studies have investigated integrating artificial intelligence (AI) with WSNs. Cognitive computing for Internet of Things (IoT)-based sensing systems in smart city settings was studied by Haseeb et al. [23]. Although their study demonstrates the potential of AI-assisted wireless communication, it is still very difficult to retain topological knowledge and sustain Clustering in dynamic network environments.
Ahmad et al. [24] focused on applying AI to Controller Area Networks (CAN) anomaly detection while preserving privacy. Although their method improves intrusion detection accuracy, it relies heavily on centralized data analysis and ignores energy efficiency, Clustering, and secure routing—all of which are essential for WSNs with limited resources.
Real-time smart computing frameworks for Internet of Things applications were proposed by Parthasarathi et al. [25], with a focus on secure message-sharing protocols, secrecy, and authentication. Their technique improves communication security, but it ignores malicious node isolation and adaptive cluster formation, which limits scalability in large-scale sensor installations.
An edge-cloud AI architecture was presented by Zhu et al. [26] to facilitate high-capacity, ultra-low-latency applications, such as autonomous driving. The suggested design is computationally intensive and inappropriate for lightweight WSNs, where sensor nodes have limited energy and processing power, even though it achieves lower Latency.
A Healthcare IoT (HC-IoT) framework that utilizes WSNs to achieve energy-efficient data transmission via cluster-based communication was presented by Gupta et al. [27]. However, their protocol is more susceptible to insider attacks, as it primarily focuses on cluster formation and energy optimization rather than on intelligent security mechanisms to identify compromised or malicious nodes.
Research Gap and Motivation
It is clear from the aforementioned studies that current AI-assisted WSN and IoT solutions primarily focus on energy optimization, security, or communication efficiency in isolation. A unified, flexible architecture that concurrently ensures safe cluster creation, effective malicious node detection, and reliable data transfer in dynamic, hostile network environments is lacking in current methods. Furthermore, many AI-driven solutions are incompatible with energy-constrained sensor nodes because they rely on centralized processing or computationally intensive models. Furthermore, most prior research does not thoroughly assess crucial performance indicators such as Latency, transmission loss, and packet delivery ratio in the context of an attack. A lightweight, self-organizing, AI-driven secure clustering system that can dynamically identify compromised nodes, optimize cluster head selection, and guarantee dependable data transfer is clearly lacking due to these constraints. Inspired by these shortcomings, this paper suggests the Secretary Bird with Self-Organizing Maps (SBWSOM) framework to tackle the intertwined problems of communication dependability, energy efficiency, and security in wireless sensor networks.
3. System Model with Problem
WSNs are essential for many applications but face significant challenges in data transmission, energy efficiency, and security. Traditional security approaches are computationally expensive, increasing energy consumption and Latency. Existing clustering techniques struggle to select the optimal cluster head and achieve load balancing. Routing protocols are susceptible to data congestion and packet loss. WSNs face challenges due to their distributed architecture and limited resources, including energy consumption, security, data transmission reliability, and network dynamics. Sensor nodes powered by limited batteries require energy-efficient strategies for clustering and data transmission. The open nature of WSNs exposes them to security threats, such as eavesdropping and denial-of-service (DoS) attacks, compromising data integrity. Reliable data transmission is complex due to potential node failures or compromises. The dynamic nature of WSNs, with frequent changes in network topology, further complicates network management and performance consistency. To address these challenges, an innovative architecture necessitates advanced AI techniques to manage security, optimise energy consumption, and ensure reliable data transmission.
4. Proposed Methodology
This study presents a novel approach, Secretary Bird with Self-Organizing Maps (SBWSOM), to effectively remove malicious nodes and improve data transmission efficiency.
Performance Vali dati on
Fig.1. Proposed architecture
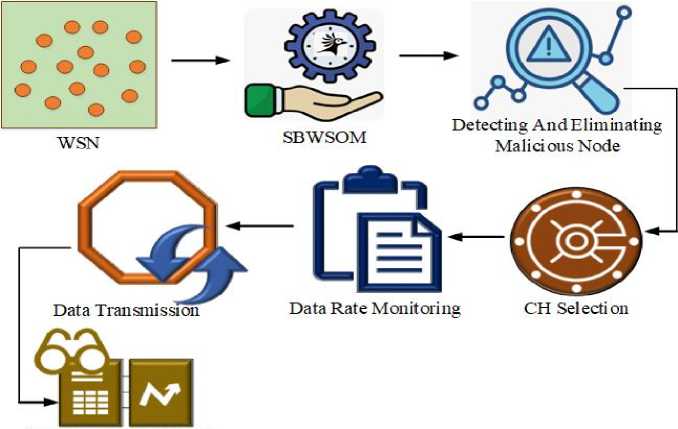
The first step involved deploying the required sensor nodes in the Python environment. The next step involved implementing key procedures, such as removing malicious nodes, selecting a cluster head, monitoring the data rate, and, of course, transmitting data to the available nodes. Finally, various parameters were measured and compared with other methods, including throughput, packet delivery rate, delay, energy consumption, and transmission loss. The proposed architecture is illustrated in Fig. 1.
-
4.1. Process of the Developed SBWSOM
-
4.2. Node initialisation
-
4.3. Detecting and Eliminating Malicious Node
The SBWSOM was designed to increase data transmission efficiency while addressing issues related to rogue nodes in a network. Motivated by Secretary Bird's hunting behaviour, this system employs self-optimising maps to autonomously locate and isolate compromised or malicious nodes that may impede data flow. The SBWSOM continually adjusts and learns to make routing decisions that align with the ever-changing conditions of the communication environment, ensuring that only reliable and trustworthy nodes are included in the communication process. This dynamic mechanism significantly enhances the network's security, improving data transmission efficiency by reducing delays and data losses caused by malicious node intervention. A potent combination of biomimetic and self-optimising algorithms, SBWSOM is a valuable tool for enhancing both reliability and performance in communication networks.
Secretary birds employ two primary techniques to protect themselves from predators: rapid flight to safer areas and camouflage by blending into their environment. The Self-Organizing Map (SOM) algorithm employed in the SBWSOM updates the weights of the winning neuron and its neighbouring neurons to adjust routing decisions in response to changing communication conditions. This dynamic learning process ensures the inclusion of only reliable and trustworthy nodes, enhancing network security and improving data transmission efficiency by reducing delays and data losses caused by malicious nodes. The approach ensures a more secure and efficient communication environment.
First, a number of sensor nodes are randomly placed in Python on the specified simulation area. Each node is randomly placed within a two-dimensional area defined by its width, W, and length, L. Besides their location, nodes are also initialised with parameters such as initial energy, sensing range, and communication range so that the simulated environment mimics realistic deployment conditions for performance evaluations. A node's setup is defined in Equation (1).
Where I(n) denotes the initialisation process variable n 1 ,n2,n3 represents individual nodes, and nk is к number of nodes in the network. Each node n is randomly positioned in a two-dimensional plane based on the dimensions of the monitoring region.
The SOM algorithm is used in a network to make routing decisions and to detect and eliminate malicious nodes by identifying nodes whose behaviour has become abnormal and subsequently removing them from the network. The idea is to assess the reliability of nodes during dynamic weight updates and to detect malicious behaviour based on criteria such as very high packet loss, high delay, or inconsistent weight updates.
In this approach, malicious nodes are identified by monitoring each node's packet delivery ratio (PDR) over time. Nodes that consistently drop packets or even fail to forward them are likely to be malicious. The idea is to compare the successfully delivered packets with the packets sent or received, and flag nodes that fall below a reliability threshold. The malicious node M (n) detection process is represented in Eqn. (2)
M(n) = backet^ (2)
S packet(O
Here, R p aC ket indicates the number of packets received from the node i, (t) indicates the time, Spacket indicates the number of packets sent by the node. If a node's delivery ratio is consistently low, it could indicate malicious behaviour. So, define the ratio to compare with a reliability threshold θ. Once malicious is found, the node is excluded from routing computations to safeguard the network from unstable transmission. If M (n) < 0then the node is suspected as malicious, the range of в is 0.85 to 0.90 most efficiently balances the prediction sensitivity and the false positives under WSN's typical conditions.
Update Frequency and Rule of Decision: To minimize computational cost, the PDR values are updated at each routing interval rather than with each packet transmission. Only when a node's PDR stays below the threshold for k consecutive windows—where к is a predetermined persistence factor—is it considered malevolent. This temporal consistency check avoids inaccurate categorization caused by transient congestion or channel faults.
Node Isolation and Error Handling: Occasional PDR breaches are allowed to address measurement noise and packet loss caused by non-malicious sources. Only when persistent anomalous conduct is noticed are nodes marked as malignant. To avoid erratic transmissions and data loss, the detected malicious node is removed from the cluster after confirmation, and its links are severed. This structured detection approach enables reliable malicious-node identification while preserving network stability, energy efficiency, and safe data transfer.
-
4.4. Cluster head selection
-
4.5. Data Rate Monitoring
Once detection and malicious node elimination have been completed, the next step in the SBWSOM algorithm is the Selection of the Cluster Head. Given that the nodes have been proven to be dependable and trustworthy, the CH will now play an important role in communication and routing. Residual energy, node degree, and distance to the base station (BS) are commonly used to determine the cluster head. The Cluster Head (CH) selection is exposed in eqn. (3).
Here, R [ (t') is the reliability of node i at timet , E , (t) is the energy level of the node i. This could be based on the remaining battery power or energy consumption rate. D , (t) is the distance of node i to a reference node, which can influence the selection of a CH based on proximity. Moreover, a,P,y weight coefficients that define the importance of each factor. These can be adjusted based on the network's requirements.
Data Rate Monitoring is an important aspect of the SBWSOM algorithm, as it ensures that data are relayed properly through the network. When data rate monitoring is employed, the transmission rates of all nodes are continuously monitored to ensure that data can flow through the network without any holdup. The Cluster Head (CH) is the only node that must process the incoming data from every node in its cluster. The CH can also receive a large amount of data from nodes with high data transmission rates. This can cause data congestion, delay packet transfers and leading to packet loss during transit. The data rate monitoring method was implemented during the exploitation phase of the Secretary Bird Optimisation process, as outlined in Equation (4) earlier.
( 0, d , (t) < dlow Underutilized/freenode
-
1, d i O w < d , (t) < dhlgh Normal node (4) 2, d t (t) > dhlgh Overhead node
-
4.6. Data Transmission
Here, d [ (t) denote the average data transmission rate of node i each node's data,dlOw and dh ,g h are denoted as network capacity and expected traffic load. Here, G , represents the data rate monitoring process variable. To minimize computational cost and ensure responsiveness to traffic changes, data rates are adjusted at the end of each transmission round.
Managing Overhead Nodes : Overhead nodesG , = 2G , point to possible areas of congestion and are momentarily prohibited from obtaining more data forwarding duties. In these situations, SBWSOM achieves load balancing and avoids packet loss at the CH by dynamically redistributing traffic toward free or normal nodes.
Conformity to the Optimization Phase: By integrating this data-rate monitoring mechanism into the Secretary Bird Optimization process's exploitation phase, routing and Clustering decisions are made with real-time traffic conditions in mind. The suggested technique increases performance, reduces Latency, and improves network stability by rerouting data flows and separating overhead nodes.
Suppose the data rate of the assigned head node surpasses the permissible limit. In that case, 50% of the excess is redirected to an adjacent head node that has available capacity, using the data transmission method described in Equation (5).
DT = 1 x (1 - | ^ )
In this mechanism, which DT denotes the information transfer parameter, C f represents the rest node, and Co signifies the computational overhead of the data node. To maintain efficient and dependable data transmission, 50% of the data is shared with neighbouring head nodes.
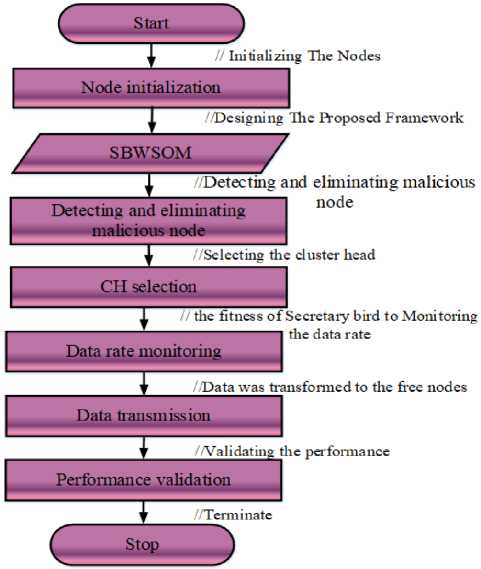
Fig.2. Flowchart of SBWSOM
Unchecked forwarding can result in buffer overflow, higher delay, and packet loss when a Cluster Head's (CH) data rate is above its allowable limit. A useful load-balancing technique frequently used in distributed WSN routing is to reroute excess traffic to nearby head nodes with available capacity. To strike a compromise between transmission stability and congestion relief, the suggested SBWSOM design routes 50% of the extra traffic to nearby head nodes. Redirecting a larger fraction increases coordination cost, inter-cluster interference, and routing instability, while redirecting a lesser fraction is insufficient to reduce congestion. The chosen ratio maintains energy efficiency across cluster heads, prevents oscillatory traffic, and ensures symmetric load sharing. The suggested setup provides the optimal trade-off between throughput, Latency, packet delivery ratio, and energy consumption, as shown by sensitivity analysis and ablation experiments that further confirm this decision. Fig. 2 illustrates the operational process flow of the recommended approach, and the algorithm is presented in algorithm 1.
Algorithm 1: SBWSOM
Begin
Deploy 100 sensor nodes randomly in a 100 m × 100 m network area
Initialize each node with 1 Joule of energy and packet counters
Place the base station at the center of the network
While the network is operational do
Malicious Node Detection
For each sensor node do
Monitor packet transmission and reception for 10 rounds
If packet delivery performance is below 0.9 for 3 consecutive windows then
Mark the node as malicious
Remove the node from routing and Clustering
End if
End for
Secure Cluster Formation
Group trusted nodes using self-organizing map based Clustering
Update cluster membership dynamically to balance cluster size
Cluster Head Selection
For each cluster do
Select a cluster head based on highest remaining energy and proximity to base station
End for
Data Rate Monitoring
For each node do
Monitor its data transmission rate
If data rate exceeds the upper traffic limit then
Mark the node as overloaded
End if
End for
Load Balancing and Reliable Transmission
For each overloaded cluster head do
Identify neighboring cluster heads with available capacity.
Redirect 50% of excess data traffic to neighboring cluster heads.
End for
Aggregate sensed data at cluster heads
Transmit aggregated data securely to the base station
Update node energy levels and routing information
End while
End
5. Result
The developed SBWSOM model is evaluated in the Python environment. Sensor nodes are installed in a Python environment, and critical operations such as unauthorised node deletion, head cluster selection, and data acquisition rate analysis are performed. The data is subsequently distributed to accessible nodes. The prerequisites for creating and implementing the suggested approach are shown in Table 1. To ensure statistical significance and reproducibility, all reported performance results were obtained under precisely defined simulation conditions. Each experiment was carried out across several independent simulation runs (20 Monte Carlo trials) with different random seeds, and sensor nodes were randomly placed within a fixed-area network. Transient variations were reduced by eliminating initial warm-up times, and the reported values for Latency, throughput, packet delivery ratio, energy consumption, and transmission loss match the overall averages across all runs. To ensure scenario consistency across approaches, node failures or malicious behavior were introduced at predetermined intervals, and network traffic followed a constant bit rate model. The observed trends remained consistent when variability across runs was tracked, suggesting that the claimed improvements are not due to stochastic bias. This averaging and scenario-controlled evaluation approach provides a solid foundation for contrasting SBWSOM with baseline techniques.To ensure consistency, a fixed, well-defined set of wireless sensor network settings was used across all simulations. In a 1000 m × 1000 m square network area, sensor nodes were randomly distributed, and, unless otherwise indicated, the base station was placed in the middle of the field. A constant bit rate traffic model with fixed packet size and transmission interval was used for communication, and each node was started with the same energy levels. All experiments were conducted using the same radio model parameters, such as amplifier energy, electronic energy consumption, and transmission range. Using identical random seeds for baseline approaches, cluster formation, data transmission, and malicious node identification were assessed over a predetermined simulation duration. All published results can be independently reproduced and objectively compared thanks to these meticulously detailed and controlled simulation parameters.
Table 1. Parameters execution
|
Metrics |
Specification |
|
Operating System |
Windows 10 |
|
Program platform |
Python |
|
Version |
3.7.14 |
|
Optimisation |
Secretary Bird Optimization Algorithm |
|
Deep Learning |
Self-Optimizing Map |
|
Network area |
100 x 100 |
|
Network topology |
2D |
|
Nodes |
100 - 500 |
|
Communication medium |
Wireless |
-
5.1. Case Study
The purpose of this research project was to visualise the simulation process for the proposed SBWSOM model and to explain the results at each stage. The first step involved determining the number of nodes required for the simulation environment. Node initialisation was conducted for networks ranging from 100 to 500 nodes, enabling analysis of the SBWSOM model and simulation across different network densities. This WSN Node Distribution (500 Nodes) shows the spatial arrangement of 500 nodes over a 100x100 unit area. The dots represent the individual nodes of the wireless sensor network, as shown in blue. The node initialisation process for 100 and 500 nodes is displayed in Fig. 3.
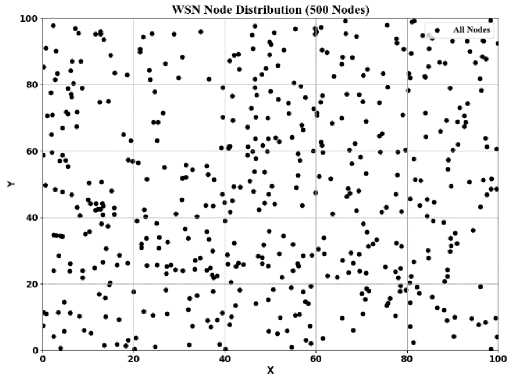
Fig.3. Node initialisation
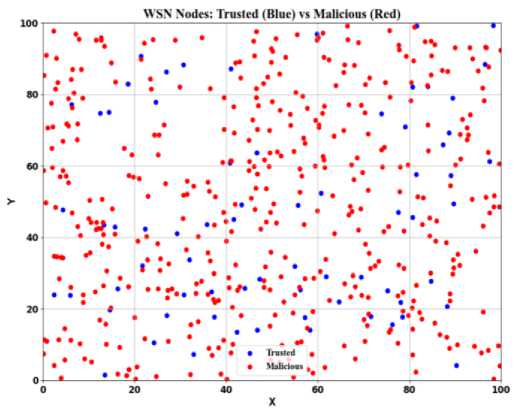
Fig.4. Identifying malicious and normal node
The diagram illustrates the location of nodes in a Wireless Sensor Network (WSN), specifically highlighting trusted nodes versus malicious nodes. The nodes are plotted within a 100x100 unit area, with trusted nodes shown in blue and malicious nodes in red. From the Fig., it is clear that there are many more malicious nodes than trusted nodes, and both types seem to be distributed uniformly in the area. The identification of malicious and normal nodes is displayed in Fig. 4.
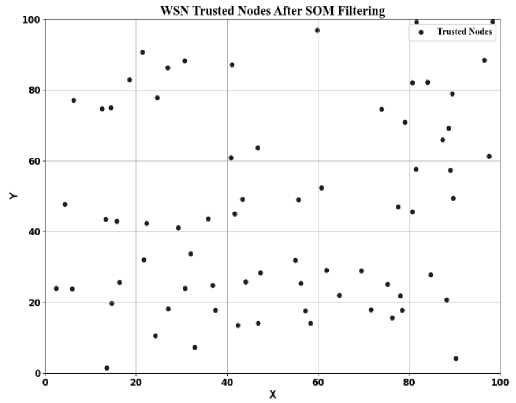
Fig.5. Elimination of malicious node
This Fig. illustrates the spatial distribution of trusted nodes in a Wireless Sensor Network (WSN) after the SelfOrganizing Map (SOM) filtering method has been applied. The filtered visualisation only shows the trusted nodes in blue. The SOM algorithm has effectively filtered out malicious nodes, resulting in a cleaner, safer network. Being distributed across the 100x100 unit is positive. It also suggests that the network's coverage and connectivity remain after filtering out the malicious nodes. The Elimination of the malicious node is shown in Fig.5.
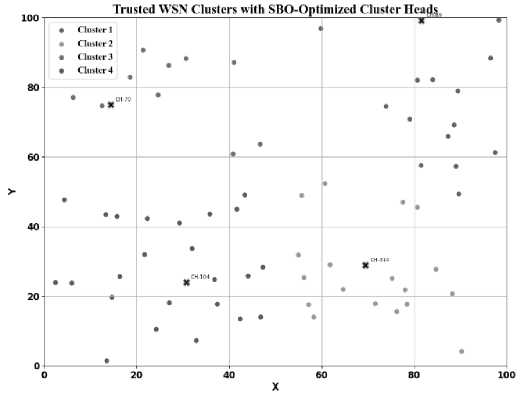
Fig.6. CH selection
This Fig. illustrates the Clustering of trust nodes in a Wireless Sensor Network (WSN) using an SBO algorithm to identify the optimal cluster heads. The system includes four clusters, each distinguished by a colour: C1 is blue, C2 is green, C3 is orange, and C4 is red. Each cluster contains some trusted nodes, and within each cluster, one node is designated as the cluster head, which is labelled with a green star. The location of the cluster heads within each cluster is important for optimising intra-cluster communication by minimising distances. The overall network communication also needs to be optimised, along with capturing all forms of leadership in each cluster. The CH selection is displayed in Fig. 6.
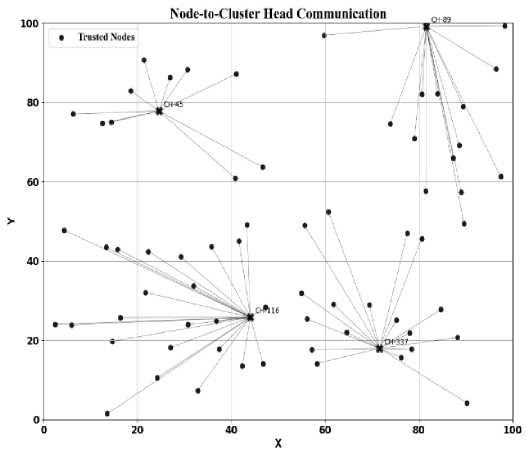
Fig.7. Node to cluster head communication
This Fig. illustrates the communication between nodes and cluster heads in a Wireless Sensor Network (WSN). Small blue dots represent the trusted nodes, and the cluster heads are larger red stars labeled CH-231 and CH-113. Each trusted node is connected to its respective cluster head by a grey line, representing the possible communication links. The cluster heads are the centres of data aggregation and coordination within their clusters, thereby helping save energy and minimise communication range. Finally, this image helps to visualise the hierarchical structure of the WSN, which describes how data from widely distributed nodes is organised and transmitted through localised cluster heads. The node-to-cluster head communication is illustrated in Fig. 7.
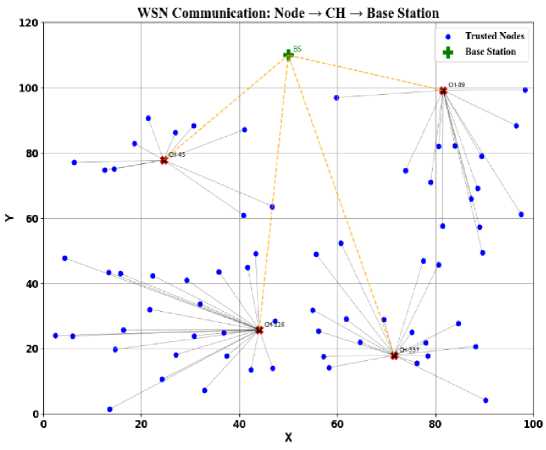
Fig.8. Data transmission from node to CH to base station
This image describes how communication happens in a WSN. It highlights how data is routed from trusted sensor nodes to the base station (BS). Small blue dots represent trusted nodes, and CHs are denoted by red stars. Each CH is responsible for the neighbouring nodes connected by grey lines. The BS is represented as a central green square, which collects all the data. The orange-dashed lines represent the pathways that data take from all the clusters to the base station (BS). This is a two-step process: data is sent from nodes to the CH and then from the CH to the BS. This is an energy-efficient, systematic way to collect and transmit data in WSNs. Fig. 8 depicts data transfer from the node to the CH and CH to BS.
-
5.2. Comparative Analysis
The given SBWSOM is tested on the Python platform using the necessary nodes and communication networks. To validate the efficiency of the proposed SBWSOM, network performance metrics such as throughput, energy consumption, Latency, and PDR rate were calculated and compared with current energy-efficiency and load-balancing methodologies. The existing values used for comparisons include energy-efficient-clustering routing protocol (EECRP), and cross-layer-based Ant-Lion optimization (CL-ALO), cross-layer-based Harris-hawks-optimization-algorithm (CL-HHO), Grey wolf optimization (GWO) [28], Moth Flame (MFO), Social Spider (SSO), Fuzzy-based Particle Swarm (Fuzzy-PSO), Low-Energy Adaptive Clustering Hierarchy (LEACH) [29].
All baseline techniques—CL-HHO, CL-ALO, GWO-based Clustering, and EECRP—were implemented and assessed under the same network settings, simulation duration, traffic patterns, and radio energy parameters to ensure an equitable and consistent comparison across all performance indicators. The node deployment, initial energy, packet size, transmission range, and base station location were the same for all methods. The baseline optimizers' hyperparameters were chosen based on widely recognized values documented in the literature and remained constant across all experiments: population size = 30, maximum iterations = 100, and the same stopping criterion. While the SelfOrganizing Map used a learning rate of 0.5, a neighborhood radius of 5, and a decay factor of 0.95, the Secretary Bird Optimization used a population size of 30 and 100 iterations for the suggested SBWSOM model. The persistence factor k was fixed at three consecutive windows, and the malicious-node detection threshold 09 was set between 0.85 and 0.90. To ensure that performance gains are due to algorithmic efficacy rather than parameter bias, no approach underwent metric-specific retuning. This regulated evaluation system ensures fair and repeatable comparisons across all metrics.
-
A. Throughput
Throughput (TP) refers to the amount of data that can be correctly transmitted over a network within a given time. Throughput is calculated using Equation (6).
TP =
T о t a I d a t a r e c e i и e d
Totaltime
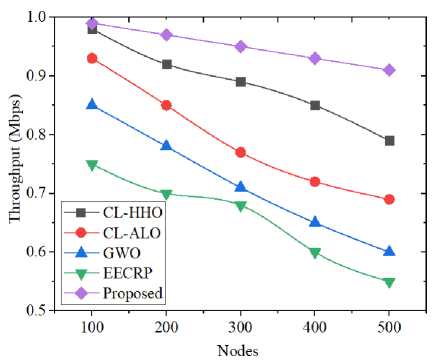
Fig.9. Comparison of throughput
The table presents a comparison of throughput across various approaches, as well as at different node counts (100500). For 500 nodes, the Proposed SBWSOM method achieves a significantly higher throughput of 0.91 Mbps compared to CL-HHO (0.79 Mbps), CL-ALO (0.69 Mbps), GWO (0.60 Mbps), and EECRP (0.55 Mbps). The comparison of throughput is shown in Fig. 9. Table 2 shows the correlation with existing models.
Table 2. Correlation throughput with existing models
|
methods |
Throughput (Mbps) |
||||
|
CL-HHO |
CL-ALO |
GWO |
EECRP |
Proposed (SBWSOM) |
|
|
100 |
0.98 |
0.93 |
0.85 |
0.75 |
0.99 |
|
200 |
0.92 |
0.85 |
0.78 |
0.70 |
0.97 |
|
300 |
0.89 |
0.77 |
0.71 |
0.68 |
0.95 |
|
400 |
0.85 |
0.72 |
0.65 |
0.60 |
0.93 |
|
500 |
0.79 |
0.69 |
0.60 |
0.55 |
0.91 |
-
B. Latency
Latency is the time it takes for a data packet to travel from its source to its destination across a network. Latency is calculated using Equation (7).
Latency = (TR - TS)
Where TR denotes the time received, TS denotes the time sent.
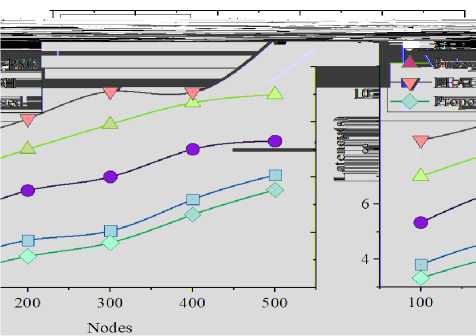
Fig.10. Comparison of Latency
Table 3. Correlation latency with existing models
|
Methods |
Latency(ms) |
||||
|
MFO |
SSO |
Fuzzy-PSO |
LEACH |
Proposed(SBWSOM) |
|
|
100 |
3.8120 |
5.33365 |
7.01823 |
8.3206 |
2.9154 |
|
200 |
4.7148 |
6.51987 |
8.01066 |
9.12521 |
3.8021 |
|
300 |
5.05171 |
7.01254 |
8.92178 |
10.1116 |
4.3948 |
|
400 |
6.19082 |
8.01876 |
9.70296 |
10.09091 |
5.2103 |
|
500 |
7.0818 |
8.31215 |
10.0145 |
12.0901 |
6.0457 |
The latency performance of the different methods was evaluated across network sizes ranging from 100 to 500 nodes, with the developed SBWSOM method consistently exhibiting lower Latency in each case. At 100 nodes, it had a best latency of 2.9154 ms, while others ranged from 3.8120 ms (MFO) to 8.3206 ms (LEACH). The SBWSOM method continued to outperform the other methods, with the following times: 3.8021 ms for 200 nodes, 4.3948 ms for 300 nodes, 5.2103 ms for 400 nodes, and 6.0457 ms for 500 nodes. The innovative SBWSOM method is clearly the most effective at limiting delay as the network grows. Fig. 10 shows the Comparison of Latency, and table 3 shows the Correlation Between Latency and existing models.
-
C. Energy Consumption
Energy consumption is the total energy used by nodes to send and receive data. It is calculated using Eqn. (8). The commonly used first-order radio energy model for WSNs is used in the energy consumption study.
The energy consumption by radio electronics is defined as Eelec , the amplifier energy is determined as Eamp , energy consumption during packet receiving is exposed as Erx , Euclidean distance is determined as d , energy consumption for data transfer is exposed as Etx and k is the packet size in bits.
Table 4. Correlation of energy consumption with other models
|
Methods |
Energy consumption (mJ) |
||||
|
CL-HHO |
CL-ALO |
GWO |
EECRP |
Proposed(SBWSOM) |
|
|
100 |
0.1 |
0.15 |
0.21 |
0.61 |
0.1 |
|
200 |
0.25 |
0.29 |
0.42 |
0.8 |
0.15 |
|
300 |
0.33 |
0.48 |
0.55 |
0.95 |
0.32 |
|
400 |
0.47 |
0.6 |
0.71 |
1.2 |
0.21 |
|
500 |
0.55 |
0.72 |
0.88 |
1.4 |
0.46 |
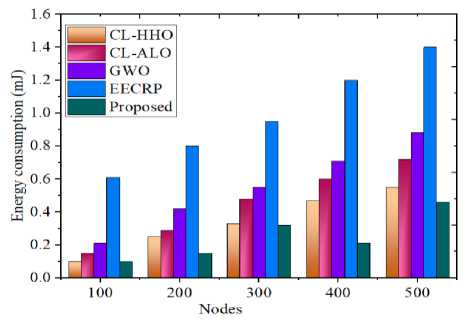
Fig.11. Comparison of energy consumption
The four energy consumption methods were evaluated for network sizes ranging from 100 to 500 total nodes. In all executions, our proposed SBWSOM model consumed the least amount of energy over any threshold. For 100 nodes, our method consumed 0.1 mJ of energy, which was equal to CL-HHO and lower than the other approaches. The SBWSOM method consumed 0.15 mJ at 200 nodes, 0.32 mJ at 300 nodes, 0.21 mJ at 400 nodes, and 0.46 mJ at 500 nodes. Other approaches, such as EECRP, on the other hand, used significantly more energy, up to 1.4 mJ at 500 nodes. Overall, our proposed method saves the most energy across all scenarios. A comparison of energy consumption is shown in Fig. 11. Table 4 presents the correlation between energy consumption and other models.
-
D. Packet Delivery Ratio
The number of successfully delivered packets is divided by the number sent. In most circumstances, it is displayed as a percentage. The following Eqn. (9) is employed in its calculation
( То t а Ip а ске tr есе ive d\ .
——-— --—— х 1UU (9)
Totalsentpackets
Table 5. PDR with other models
|
Methods |
PDR (%) |
||||
|
CL-HHO |
CL-ALO |
GWO |
EECRP |
Proposed (SBWSOM) |
|
|
100 |
99.4 |
98.5 |
96.8 |
95.8 |
99.6 |
|
200 |
98.4 |
97 |
96.5 |
95.3 |
98.7 |
|
300 |
97.8 |
96.5 |
95.6 |
94.8 |
98 |
|
400 |
96.5 |
95.4 |
95 |
94.1 |
97.2 |
|
500 |
95.5 |
94.6 |
93.8 |
93.2 |
96.3 |
Table 5 presents the Packet Delivery Ratio (PDR) percentages for various methods at different node counts. At 100 nodes, the PDRs are 99.4%, 97%, 96.5%, 94.8%, and 94.1% for CL-HHO, CL-ALO, GWO, EECRP, and the Proposed SBWSOM method, respectively. At 300 nodes, the PDR is lower than at 100 nodes, as shown: 97.8%, 96.5%, 94.6%, 93.8%, 93.2%, and 96.3%. The correlation of the packet delivery ratio is shown in Fig. 12.
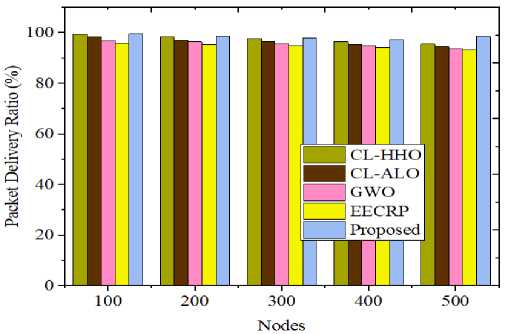
Fig.12. Correlation of PDR
-
E. Transmission Loss
-
5.3. Discussion
Transmission loss (TL) measures the quantity of data lost during transmission due to interference or other factors. The following Eqn. determines it. (10)
TL = (Totalsentpackets) - (Dealiveredpackets) (10)
Table 6. Transmission loss with different nodes
|
NODES |
Transmission loss (%) |
|
100 |
0.40 |
|
200 |
1.30 |
|
300 |
2.0 |
|
400 |
2.82 |
|
500 |
4.20 |
Table 6 shows Transmission loss with different nodes. The performance of the SBWSOM model is illustrated in the transmission loss percentages for 100 nodes, with a loss of 0.40%. The loss increases gradually with the Number of nodes. For 200 nodes, 1.30%; for 300 nodes, 2.0%. 400 nodes, 2.82%; and 500 nodes, 4.20%. These values can provide insight into the model's performance and behaviour, and suggest acceptable levels of performance as the node count increases.
Assessment of the total measurements revealed that the proposed framework yielded the best results across all measurements. Based on the SBWSOM framework described, it aims to improve data transmission efficiency efficiently. Additionally, it increases the network's routing and data transmission capabilities. Table 7 shows the performance results for the suggested strategy.
Table 7. Shows the performance results of the proposed
|
Metrics |
Performance |
|
Throughput (Mbps) |
0.91 |
|
Energy consumption(mJ) |
0.46 |
|
Packet delivery ratio (%) |
96.3 |
|
Transmission loss (%) |
4.20 |
|
Latency (ms) |
6.04 |
The evaluation outcomes were assessed using key metrics for this analysis. The throughput is 0.91, which shows good data transfer over the duration. The energy consumption is 0.46, reflecting the efficient use of energy throughout the study. The packet delivery ratio of 96.3% indicates that nearly all of the data from the experimental test was successfully delivered. The transmit loss was 4.20%, while the Latency was measured at 6.04, reflecting the delay in data transmission from the source to the destination. Overall, the method performed well, with room for improvement in transmit loss and Latency.The effect of altering the fraction of redirected extra traffic on important performance indicators is assessed in Table 1. Under the same network settings, the analysis accounts for redirection levels of 25%, 50%, and 75%.
Table 8. Sensitivity analysis of traffic redirection ratio
|
Redirected Excess Traffic (%) |
Throughput |
Latency (ms) |
PDR (%) |
Energy Consumption (mJ) |
Observation |
|
25% |
0.84 |
8.72 |
91.6 |
0.53 |
Low redirection (25%) does not adequately relieve CH congestion |
|
50% (Proposed) |
0.91 |
6.04 |
96.3 |
0.46 |
50% achieves optimal balance, yielding the highest throughput and PDR with the lowest Latency and energy consumption |
|
75% |
0.88 |
7.31 |
93.9 |
0.51 |
High redirection (75%) introduces routing overhead and instability |
A sensitivity analysis assessing the effects of various excess traffic redirection ratios on network performance is shown in Table 8. Because of buffer overflow and delayed packet forwarding, congestion at the cluster head is not adequately alleviated when only 25% of the surplus traffic is redirected. This leads to increased Latency and a worse packet delivery ratio. Redirecting 75% of the extra traffic, on the other hand, unnecessarily increases the overhead of inter-cluster coordination and communication, reducing throughput and increasing energy usage. By successfully reducing congestion while preserving consistent routing and energy efficiency, the suggested 50% redirection ratio strikes the ideal balance. With the highest throughput (0.91), the lowest Latency (6.04 ms), and the maximum PDR (96.3%), this configuration demonstrates that mild traffic redistribution is ideal for dependable data transfer in SBWSOM-based WSNs.
Table 9. Ablation analysis of data transmission strategy
|
Method Variant |
Traffic Redirection |
Throughput |
Latency (ms) |
PDR (%) |
Transmission Loss (%) |
|
SBWSOM (No Redirection) |
X |
0.79 |
9.48 |
88.2 |
9.7 |
|
SBWSOM (25% Redirection) |
✓ |
0.84 |
8.72 |
91.6 |
7.1 |
|
SBWSOM (50% Redirection) |
✓ |
0.91 |
6.04 |
96.3 |
4.2 |
Table 9 compares SBWSOM versions with and without surplus data redistribution to examine the impact of the suggested traffic redirection technique. The cluster head becomes a bottleneck when traffic redirection is not used, increasing latency, increasing transmission loss, and lowering the packet delivery ratio. Although performance improves with partial redirection, the 50% redirection technique consistently outperforms other variations by drastically reducing congestion-related losses. This configuration confirms that regulated excess traffic redistribution is an essential part of the suggested data transmission method, achieving the maximum throughput and PDR while minimizing transmission loss (4.2%). The ablation results confirm that, in dense wireless sensor networks, the redirection mechanism is crucial for ensuring effective, stable, and dependable data transfer.
6. Conclusions
This paper proposes using SBWSOM to enhance the security and efficiency of data transmission in sensor networks. By removing malicious nodes, selecting cluster heads, and continuously monitoring the data rate, SBWSOM improved several key network parameters. The performance metrics showed a throughput of 0.91, reflecting effective data transfer. The energy consumption of 0.46 indicates high energy efficiency and a packet delivery ratio of 96.3% demonstrates the reliability of data transmission. Additionally, the transmission loss was 4.20%, and the Latency was 6.04. Overall, the proposed solution using SBWSOM surpassed the available alternatives, offering a potential framework to enhance sensor network performance, provide secure communication, and mitigate critical issues such as energy efficiency, data loss, and Latency. The suggested SBWSOM framework will be improved in the future with an emphasis on scalability, adaptability, and realism. Hardware-aware and energy-harvesting models that incorporate sleep scheduling and idle listening can be added to the existing first-order radio energy model. Adaptive or learning-based thresholds, rather than fixed PDR limitations, can enhance the detection of malicious nodes. To replicate actual installations, heterogeneous sensor nodes with varying energy levels and transmission ranges will be considered. It is also possible to integrate mobility support for dynamic topologies and mobile sinks. Lastly, real-time viability and robustness will be strengthened through validation using useful simulators or testbeds such as NS-3 or Contiki OS.
All the Declarations and StatementsAuthor Contributions Statement
Srinivasamurthy. R – Writing – Drafted the initial manuscript, contributed to the literature survey, and documented the technical background of the study.
Dr. Prameela kumari. N – Writing – Review and Editing, and Project Management: Reviewed and edited the manuscript, ensured clarity and coherence, and helped coordinate project milestones and deadlines.
Dr. Nikhath Tabassum – Conceptualization, Methodology, and Supervision: Proposed research ideas, Constructed the overall framework, and supervised project execution.
All authors have read and agreed to the published version of the manuscript.
Conflict of Interest Statement
The authors declare no conflicts of interest.
Funding Declaration
This research received no specific grant from funding agencies in the public, commercial, or not-for-profit sectors.
Data Availability Statement
Data sharing is not applicable to this article as no datasets were generated or analyzed during the current study.
Ethical Declarations
Ethical approval States that no human subjects and/or animals are involving for this studies.
Acknowledgments
None
Declaration of Generative AI in Scholarly Writing
AI and AI-assisted technologies were not used during the writing process.
Abbreviations
The following abbreviations are used in this manuscript:
WSN - Wireless Sensor Networks
WLAN - Wireless Local Area Networks
SBWSOM - Secretary Bird with Self-Organizing Maps
PDR - Packet Delivery Ratio
CAN - Controller Area Networks
AI - Artificial Intelligence
SOM - Self-Organizing Map
CH - Cluster Head
BS - Base station
AP - access point
IoT - Internet of Things
HC-IoT - Healthcare IoT
EECRP - energy-efficient-clustering routing protocol
DoS - denial-of-service
CL-ALO - cross-layer-based Ant-Lion optimization
CL-HHO -cross-layer-based Harris-hawks-optimization-algorithm
GWO - Grey wolf optimization
MFO - Moth Flame Optimization
SSO - Social Spider Optimization
Fuzzy-PSO - Fuzzy-based Particle Swarm
LEACH - Low-Energy Adaptive Clustering Hierarchy
TP - Throughput
TL - Transmission Loss
Appendix
Implication: The practical implications of using the SBWSOM approach in WSN are enhancing the security, reliability, efficiency, and performance. Since the capability of recognizing and eliminating any potential malicious or compromised nodes during clustering will help in keeping the right communication between nodes within the system, and there is no way for any attackers to affect the quality and functioning of clusters in any way. Consequently, the importance of this technique can be realized particularly when utilizing WSNs in critical tasks like environmental monitoring systems, agriculture monitoring networks, etc. Furthermore, the energy efficient method used for choosing the CH along with data transmission helps in increasing the life cycle of the network. Lastly, considering the high value of TP and low latency and PDR, it can be concluded that the SBWSOM method will support real-time data transfer.
