
Artificial Neural Network-Based Time Series Forecasting for Higher Education Enrollment: A Case Study of NEMSU–Cantilan Campus
Journal: International Journal of Wireless and Microwave Technologies @ijwmt
Article in issue: 4 Vol.16, 2026.
Free access
This paper presents a machine learning-based model designed to forecast trends in enrollment in the Department of Computer Studies at NEMSU–Cantilan Campus, specifically for the Bachelor of Science in Computer Science (BSCS), Bachelor of Science in Computer Engineering (BSCpE), and Bachelor of Science in Information Technology (BSIT) programs. Twenty semesters (2015–2025) of historical program-level enrollment were chronologically split, with the most recent semesters withheld for validation, and a lagged feature set (Lag 1–Lag 3) was constructed for an Artificial Neural Network (ANN) and benchmarked against Holt-Winters Exponential Smoothing and ARIMA, both tuned on the same training split. Employing the ANN model, this study achieved an aggregate Mean Absolute Percentage Error (MAPE) of 3.62%, outperforming the Holt-Winters (25.59%) and ARIMA (31.09%) baselines on this dataset, a ranking corroborated by RMSE and MAE (Table 6) and confirmed against a small LSTM and Prophet, neither of which outperformed the ANN at this sample size; a per-program breakdown (Table 7), however, shows this advantage is not uniform, ranging from 3.93% MAPE for BSCS to 13.48% for BSIT. The enrollment projections indicate consistent growth across all programs. The BSCS program is likely to increase from 297 students in 2025 to 401 by 2028, exhibiting a 35% growth. The BSIT program is projected to experience the most significant expansion, growing from 1,078 students in 2025 to 2,714 students by 2028-an increase of 151%, a trend consistent with the program’s sharp historical acceleration after 2022 and the recursive nature of the multi-step forecast, which compounds this recent growth forward. Meanwhile, the BSCpE program is expected to grow more gradually, from 153 students in 2025 to 186 by 2028, showing a 21.6% increase. Overall, the total enrollment in the Department of Computer Studies is expected to rise from 1,517 students in the second semester of 2025 to 3,031 by the first semester of 2028, marking a 100% increase. These findings highlight the accuracy and adaptability of ANN-based models in capturing nonlinear trends in enrollment, offering a valuable tool for strategic planning, faculty and classroom allocation in state universities and colleges in the Philippines.
Short address: https://sciup.org/15020615
IDS: 15020615 | DOI: 10.5815/ijwmt.2026.04.02
Text of the scientific article Artificial Neural Network-Based Time Series Forecasting for Higher Education Enrollment: A Case Study of NEMSU–Cantilan Campus
Published Online on August 8, 2026 by MECS Press DOI: 10.5815/ijwmt.2026.04.02
Accurate prediction of student enrollment supports universities in planning and optimizing institutional resources. Data-driven forecasting helps higher education institutions allocate faculty, facilities, and budgets more effectively [1]. This research develops a machine learning model aimed at predicting enrollment behavior across the academic programs offered by North Eastern Mindanao State University–Cantilan Campus. By analyzing historical enrollment data, the research aims to assist the administration in development plan related to staffing, classroom utilization, and curriculum scheduling.
This work is open access and licensed under the Creative Commons CC BY 4.0 License.
Recent studies emphasize the increasing value of machine learning in enrollment forecasting within higher education. Predictive models have been shown to improve institutional planning by enhancing data accuracy and supporting evidence-based academic management. A study conducted at the Arab American University explored neural network– based forecasting and reported that ensemble models, particularly Random Forest, achieved strong predictive performance [2]. Enrollment projections hold a vital role in institutional budgeting and operational oversight, since annual forecasts directly shape expenditure and resource allocation decisions [3]. These findings highlight the relevance of adopting machine learning approaches in anticipating enrollment trends to strengthen decision-making in universities.
Machine learning has been widely applied in enrollment forecasting; however, most prior studies have concentrated on large or internationally recognized universities with extensive datasets. Limited attention has been given to SUC’s in the Philippines, such as NEMSU–Cantilan Campus, where enrollment patterns differ due to smaller student populations and rural educational contexts. Studies conducted within smaller Philippine state universities have reported that enrollment behavior at this scale is shaped by short, program-specific sequences and local administrative or policy shifts that are not represented in datasets drawn from large universities, limiting how well models calibrated elsewhere transfer to these settings [18], [20]. Models trained without accounting for such small-sample, locally-driven variation are accordingly prone to lower forecast accuracy when applied to campuses like NEMSU–Cantilan. This study bridges that gap by creating a tailored predictive framework designed for the university’s unique data profile and operational needs.
The main purpose of this study is to design a machine learning-based model able to accurately forecast enrollment at NEMSU–Cantilan Campus for the next three academic years [4]. This framework is designed to support administrative planning by delivering dependable projections for faculty staffing, facility use, budgeting, and curriculum development. Moreover, this research offers empirical evidence toward the expanded use of machine learning methods in educational forecasting, serving as a reference for other public higher education institutions aiming to adopt data-driven management strategies.
2. Related Works
Data and machine learning have emerged as essential techniques for tackling challenges in university administration, particularly in forecasting student admissions [5]. Given the expanding availability of institutional datasets, researchers have implemented machine learning and statistical methodologies to assess fluctuations in enrollment, student academic results, and institutional efficiency. These methods highlight the growing influence of predictive analytics in providing data-backed support for academic strategic decisions and organizational planning.
Globally, numerous studies have shown that machine learning techniques can considerably improve the precision of enrollment forecasts. A neural network–based forecasting approach was introduced that outperformed traditional exponential smoothing methods when modeling non-linear data patterns across a 25-year period in the United States [6]. A hybrid neural architecture was developed that combines convolutional and recurrent layers to effectively capture complex seasonal variations in enrollment data [7]. Ramos also used machine learning algorithms and historical data to predict institutional enrollments [8], while Esquivel and Esquivel developed a decision support system (DSS) leveraging machine learning to forecast student intake at a university in the Philippines [9]. Recent studies have shown that ensemble methods, particularly Random Forest, achieve high accuracy in forecasting course-level enrollment, often outperforming traditional statistical models [10]. Furthermore, in another relative analysis, Support Vector Regression (SVR) and Long Short-Term Memory (LSTM) models exhibited superior performance compared to traditional forecasting approaches, primarily due to their intrinsic capability to model dependencies across time [11].
Further advancements were introduced in studies that employed an ARIMA–LSTM hybrid model to represent both linear and nonlinear temporal characteristics [12]. Khan implemented a machine learning-based recommendation framework utilizing collaborative filtering and regression methods to forecast undergraduate course enrollments [13]. Gören applied educational data mining to anticipate student retention and enrollment changes, focusing on model interpretability and variable selection [14]. A systematic review of educational trend forecasting covering the years 2019 to 2024 was conducted [15]. Their analysis identified Random Forest, LSTM, and hybrid neural architectures as the greatest reliable and precise models available for trend forecasting. Zhou and Yu, though working in the tourism field, presented a CNN-LSTM hybrid framework whose methodological approach parallels enrollment forecasting due to its combined focus on trend and seasonality components [16].
In the Philippine context, several state universities have begun integrating both machine learning and statistics approaches into their forecasting models. Malibiran applied time series analysis in forecasting the tourist arrival in the province of Surigao del Sur achieving results that closely matched actual monthly tourists records [17]. Masinaring, Dalagan Jr., and Manib utilized time series techniques at Davao Oriental State University to identify recurring enrollment cycles for scheduling and financial management purposes [18]. Similarly, Esquivel and Esquivel created a logistic regression-based DSS for predicting incoming students, while De Guzman proposed a Naïve Bayes framework to enhance forecast precision and computational efficiency [19].
Local researchers have also expanded contributions in this domain. Libo-on and Gadon used structural equation modeling (SEM) to forecast high school transitions based on socioeconomic indicators [20]. In addition, machine learning approaches—such as the use of Random Forest models with institutional student data—have been applied to predict whether applicants would proceed with enrollment in higher education institutions [21]. These works—spanning from Malibiran to De Guzman—underscore the increasing role of machine learning–based forecasting as a strategic instrument for data-informed academic management among Philippine higher education institutions.
Taken together, the studies reviewed above share two limitations that motivate the present work. First, the majority of the global and national studies [6]–[16] rely on enrollment series spanning two decades or more from large institutions, where the volume of historical observations supports data-hungry architectures such as LSTM and CNN-LSTM hybrids; none of these studies report how such models behave when only ten years of semestral data are available, which is the realistic constraint facing a single-campus SUC. Second, the Philippine-context studies [17]–[21] predominantly apply statistical or shallow classification methods (time series decomposition, logistic regression, Naïve Bayes, SEM) rather than nonlinear learners, and none directly benchmark a neural model against classical baselines on a short, small-sample, program-level series of the kind analyzed here. This combination of a short historical window, small per-program counts, and limited baseline comparison in the existing literature is the specific gap this study addresses.
3. Methodology 3.1. Data Collection
The data used in this research were obtained from the Registrar’s Office of NEMSU- Cantilan Campus and consist of historical enrollment records spanning Academic Years 2015–2016 to 2024–2025 [22]. The dataset includes four main variables: Year, Semester, Department, and Program Enrollment. The enrollment variable indicates the total count of students per program for each semester.
For analytical purposes, the information was aggregated at the program level to examine enrollment behavior and forecast potential trends across academic programs. This granularity facilitates data-informed institutional planning and effective resource management. The semester variable was numerically encoded (1 for the first semester, 2 for the second) to represent the academic cycle in sequential order, making the dataset appropriate for time series forecasting using machine learning techniques. Shown in Table 1 is the historical enrollment data of the Department of Computer Studies by Program from 2015 to 2025.
Table 1. Historical Enrollment Data of the Department of Computer Studies Per Department (2015–2025)
|
Year |
Semester |
Dept |
Program |
Enrollment |
|
2015 |
1st |
DCS |
BSCPE |
70 |
|
2015 |
2nd |
DCS |
BSCPE |
69 |
|
2016 |
1st |
DCS |
BSCPE |
53 |
|
2016 |
2nd |
DCS |
BSCPE |
53 |
|
2017 |
1st |
DCS |
BSCPE |
43 |
|
2017 |
2nd |
DCS |
BSCPE |
43 |
|
2018 |
1st |
DCS |
BSCPE |
51 |
|
2018 |
2nd |
DCS |
BSCPE |
48 |
|
2019 |
1st |
DCS |
BSCPE |
71 |
|
2019 |
2nd |
DCS |
BSCPE |
67 |
|
2020 |
1st |
DCS |
BSCPE |
77 |
|
2020 |
2nd |
DCS |
BSCPE |
66 |
|
2021 |
1st |
DCS |
BSCPE |
98 |
|
2021 |
2nd |
DCS |
BSCPE |
99 |
|
2022 |
1st |
DCS |
BSCPE |
112 |
|
2022 |
2nd |
DCS |
BSCPE |
115 |
|
2023 |
1st |
DCS |
BSCPE |
133 |
|
2023 |
2nd |
DCS |
BSCPE |
130 |
|
2024 |
1st |
DCS |
BSCPE |
138 |
|
2024 |
2nd |
DCS |
BSCPE |
138 |
|
2025 |
1st |
DCS |
BSCPE |
145 |
|
2015 |
1st |
DCS |
BSCS |
182 |
|
2015 |
2nd |
DCS |
BSCS |
187 |
|
2016 |
1st |
DCS |
BSCS |
187 |
|
2016 |
2nd |
DCS |
BSCS |
175 |
|
2017 |
1st |
DCS |
BSCS |
177 |
|
2017 |
2nd |
DCS |
BSCS |
165 |
|
2018 |
1st |
DCS |
BSCS |
137 |
|
2018 |
2nd |
DCS |
BSCS |
130 |
|
2019 |
1st |
DCS |
BSCS |
182 |
|
2019 |
2nd |
DCS |
BSCS |
162 |
|
2020 |
1st |
DCS |
BSCS |
199 |
|
2020 |
2nd |
DCS |
BSCS |
158 |
|
2021 |
1st |
DCS |
BSCS |
275 |
|
2021 |
2nd |
DCS |
BSCS |
221 |
|
2022 |
1st |
DCS |
BSCS |
250 |
|
2022 |
2nd |
DCS |
BSCS |
228 |
|
2023 |
1st |
DCS |
BSCS |
268 |
|
2023 |
2nd |
DCS |
BSCS |
233 |
|
2024 |
1st |
DCS |
BSCS |
293 |
|
2024 |
2nd |
DCS |
BSCS |
269 |
|
2025 |
1st |
DCS |
BSCS |
313 |
|
2015 |
1st |
DCS |
BSIT |
232 |
|
2015 |
2nd |
DCS |
BSIT |
221 |
|
2016 |
1st |
DCS |
BSIT |
219 |
|
2016 |
2nd |
DCS |
BSIT |
211 |
|
2017 |
1st |
DCS |
BSIT |
208 |
|
2017 |
2nd |
DCS |
BSIT |
206 |
|
2018 |
1st |
DCS |
BSIT |
185 |
|
2018 |
2nd |
DCS |
BSIT |
176 |
|
2019 |
1st |
DCS |
BSIT |
301 |
|
2019 |
2nd |
DCS |
BSIT |
272 |
|
2020 |
1st |
DCS |
BSIT |
304 |
|
2020 |
2nd |
DCS |
BSIT |
301 |
|
2021 |
1st |
DCS |
BSIT |
331 |
|
2021 |
2nd |
DCS |
BSIT |
317 |
|
2022 |
1st |
DCS |
BSIT |
411 |
|
2022 |
2nd |
DCS |
BSIT |
352 |
|
2023 |
1st |
DCS |
BSIT |
559 |
|
2023 |
2nd |
DCS |
BSIT |
501 |
|
2024 |
1st |
DCS |
BSIT |
760 |
|
2024 |
2nd |
DCS |
BSIT |
720 |
|
2025 |
1st |
DCS |
BSIT |
922 |
Moreover, the historical enrollment summary of the Department of Computer Studies from 2015 to 2025 is presented in Table 2.
Table 2. Historical Enrollment Summary of the Department of Computer Studies (2015–2025)
|
year |
semester |
enrolled |
|
2015 |
1st |
484 |
|
2015 |
2nd |
477 |
|
2016 |
1st |
459 |
|
2016 |
2nd |
439 |
|
2017 |
1st |
428 |
|
2017 |
2nd |
414 |
|
2018 |
1st |
373 |
|
2018 |
2nd |
354 |
|
2019 |
1st |
554 |
|
2019 |
2nd |
501 |
|
2020 |
1st |
580 |
|
2020 |
2nd |
525 |
|
2021 |
1st |
704 |
|
2021 |
2nd |
637 |
|
2022 |
1st |
773 |
|
2022 |
2nd |
695 |
|
2023 |
1st |
960 |
|
2023 |
2nd |
864 |
|
2024 |
1st |
1191 |
|
2024 |
2nd |
1127 |
|
2025 |
1st |
1380 |
-
3.2. Data Preprocessing
-
3.3. Prediction Methodology: The Artificial Neural Network (ANN)
The processed enrollment dataset used for training the Artificial Neural Network (ANN) is presented in Table 3. It includes the target variable for prediction and three preceding input variables labeled as Lag 1, Lag 2, and Lag 3 [23]. These lag features capture the enrollment totals from the last three academic periods, serving as sequential predictors for the next term’s enrollment value. Each entry represents one semester, with all numerical data scaled to a 0–1 interval through the Min–Max normalization method [24].
Table 3. Normalized Enrollment Data with Lag Variables for ANN Forecasting
|
Lag_1 |
Lag_2 |
Lag_3 |
Target |
|
0.371429 |
0.293556 |
0.250597 |
0.140264 |
|
0.351429 |
0.250597 |
0.202864 |
0.122112 |
|
0.3 |
0.202864 |
0.176611 |
0.09901 |
|
0.242857 |
0.176611 |
0.143198 |
0.031353 |
|
0.211429 |
0.143198 |
0.045346 |
0 |
|
0.171429 |
0.045346 |
0 |
0.330033 |
|
0.054286 |
0 |
0.477327 |
0.242574 |
|
0 |
0.477327 |
0.350835 |
0.372937 |
|
0.571429 |
0.350835 |
0.539379 |
0.282178 |
|
0.42 |
0.539379 |
0.408115 |
0.577558 |
|
0.645714 |
0.408115 |
0.835322 |
0.466997 |
|
0.488571 |
0.835322 |
0.675418 |
0.691419 |
|
1 |
0.675418 |
1 |
0.562706 |
The preprocessing phase, executed within a Google Colab environment using the pandas library, involved several steps to ensure the data's accuracy and integrity. The raw data was subjected to cleaning, transformation, and normalization processes. In particular, outliers were identified and then eliminated using a z-score statistical analysis, and missing or inconsistent data points were replaced with median values. Records were flagged as outliers when their standardized z-score exceeded ±3, a threshold consistent with conventional practice for identifying recording or transcription errors in administrative datasets. This step was intended to remove isolated data-entry anomalies rather than genuine enrollment surges; because legitimate semester-to-semester jumps (e.g., the BSIT enrollment increases discussed in Section 4.4) are a substantive feature of this dataset rather than noise, no records were removed from the BSIT series under this procedure, and the z-score filter affected only a small number of isolated points in the BSCpE and BSCS series. The lag transformation was essential because it allowed the model to detect recurrent enrollment patterns and sequential dependencies between semesters. As demonstrated in Table 3, this structured approach to lag design preserved the temporal order of the records, thereby allowing the ANN to efficiently analyze historical trends and produce reliable forecasts for the future enrollment outcome.
The Artificial Neural Network (ANN) framework used in this study generates semester-by-semester enrollment projections for NEMSU–Cantilan and is illustrated in Figure 1. The process begins with data preparation, which includes loading historical enrollment data from .xlsx files and performing data cleaning to remove incomplete or incorrect entries. Afterward, the dataset is organized according to academic programs—an essential step that enables the model to recognize and learn the unique enrollment patterns associated with each course.
During the training phase, the data set undergoes reformatting into a structure suitable for the model, employing a lagged input configuration spanning three semesters (Lag 1, Lag 2, Lag 3). In this setup, each lag variable corresponds to the enrollment figures from a preceding semester. These lagged inputs serve as the primary predictors for forecasting future enrollment. To maintain computational stability and ensure faster convergence of the model, all numerical data points are standardized to fit within the 0-1 range by applying the Min-Max scaling technique.
The core of the model is a Multilayer Perceptron (MLP), aligned with network structures commonly used in enrollment prediction systems [25]. The input layer uses three nodes, each corresponding to enrollment values from the previous three semesters. Two hidden layers follow, with sixty-four and thirty-two neurons, respectively, both applying the ReLU activation function to handle nonlinear relationships in the dataset. One neuron in the output layer is in charge of forecasting enrollment for the next term. Using 3,000 iterations and a constant learning rate of 0.001, the training procedure makes use of the Adam optimizer. Given the limited size of each program-level series, training was performed in full-batch mode (i.e., the batch size was equal to the number of available training samples per program) rather than with mini-batches, which is consistent with common practice for small-sample MLP training. An early-stopping criterion based on the validation MAPE plateauing for 100 consecutive iterations was applied to halt training before the full 3,000 iterations when no further improvement was observed, and an L2 weight penalty (λ = 1×10⁴) was used to reduce the risk of overfitting on the short training sequences. The model's accuracy and convergence are evaluated based on the Mean Absolute Percentage Error (MAPE) [26].
After the model achieves acceptable performance during validation, it is retrained on the entire historical dataset to strengthen its generalization capability. In the forecasting phase, the model generates six consecutive semester predictions (N_future = 6) by recursively feeding each predicted value as an input for the next prediction cycle. Each forecasted record is mapped to its respective semester (1st or 2nd) to maintain temporal order. The final output consists of forecasted semester enrollment figures ready for interpretation and reporting.
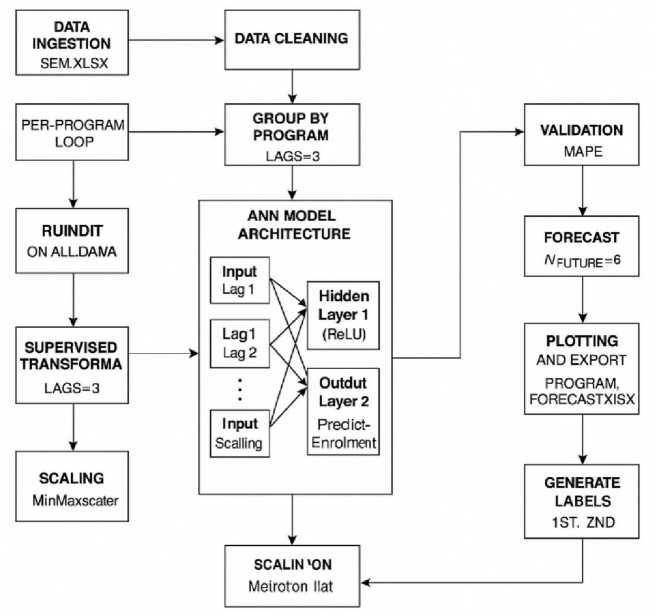
Fig. 1. ANN Model Architecture
-
3.4. ANN Forecasting Model Formula
The proposed study utilized for the prediction of enrollment is mathematically expressed as:
Л+ 1 = Я^ 3 • 5(^ 2 • 5(^ 1 • ^ t + 6 1 ) + 6 2 ) + 6 3 )
Where:
-
• Yt+i — represents the forecasted enrollment for the succeeding semester.
-
• Xt = [Et-i, Et-2, Et-з] — denotes the input vector containing enrollment counts from the three most recent semesters (lag values).
-
• Wi, W2, W3 — refer to the weight matrices of the input, hidden, and output layers.
-
• bi, b2, Ьз — bias vectors associated with each respective layer.
-
• g(^) — ReLU activation function, defined as g(x) = max(0, x)
-
• f(^) — linear activation function applied to the output layer
-
3.5 Evaluation of the Model
The precision of the model's prediction was measured employing the Mean Absolute Percentage Error (MAPE), a broadly utilized metric that calculates the deviation of predictions as a percentage. This measure enables an equitable assessment of model performance across various academic programs, irrespective of the size differences in enrollment. The MAPE is computed as follows:
MAPE =
100% N
ГЛ
Where:
• N — total count of forecasted data points.
• Yi — actual observed enrollment values.
• Yi — predicted enrollment outcomes generated by the model.
3.6. Rationale of the Model
3.7. Simulation Environment
4. Results and Discussion
4.1. Enrollment Projection for the Computer Studies Department
Each program’s prediction output was analyzed separately and compared against the corresponding actual enrollment figures from the test dataset. To improve interpretability, visual representations comparing predicted and actual enrollment outcomes were generated, providing a clearer understanding of the model’s performance accuracy and deviation patterns.
The Artificial Neural Network (ANN) employs a nonlinear architectural design that allows it to identify and adapt to complex enrollment patterns more efficiently than traditional statistical models such as ARIMA and Holt–Winters, which depend on linear assumptions and fixed seasonal structures. Chen demonstrated that neural network-based models can outperform ARIMA and exponential smoothing methods in forecasting enrollment proportions, particularly when the data display irregular fluctuations and non-stationary behavior [27]. While statistical models perform well on stable and well-structured time series, their accuracy declines when trends shift due to policy changes, academic calendar adjustments, or sudden variations in student demand. In contrast, the layered structure of ANNs combined with activation functions such as the Rectified Linear Unit (ReLU) introduces nonlinear mapping capabilities, enabling the model to adjust dynamically to evolving enrollment trends. This adaptability strengthens the ANN’s forecasting reliability across varying academic scenarios.
The ANN model was developed and trained in Google Colaboratory, a cloud-based Jupyter notebook environment. This environment provides an NVIDIA T4 GPU runtime (or equivalent, depending on availability) with 12–15 GB of RAM, running Python 3 with TensorFlow/Keras, scikit-learn, and pandas pre-installed, and includes a comprehensive set of preconfigured Python libraries and supports GPU acceleration, which significantly boosts computational efficiency during the development and training of neural network models. This environment enhances result consistency, fosters team-based research, and effectively handles extensive datasets, making it well-suited for machine learning–driven forecasting studies.
The anticipated admissions outlook for the collective Department of Computer Studies at NEMSU–Cantilan Campus is shown in Figure 2. The blue curve depicts the historical enrollment record, starting with a phase of moderate growth that later transitions into a more distinct upward trajectory. This pattern indicates a continuous increase in student engagement in computing-related programs.
The orange curve represents the forecasted enrollment values generated by the Artificial Neural Network (ANN) model, revealing a sharp and sustained increase in future semesters. This suggests that by the end of the prediction horizon, the total number of students enrolled in computing-related programs is anticipated to increase significantly, possibly reaching 2,500. The close correspondence between the observed and foreseen values confirms the ANN model’s predictive accuracy, effectively capturing the upward momentum of student enrollment. These results emphasize the department’s growing contribution to the information and communication technology sector and its responsiveness to increasing workforce demand in computing fields.
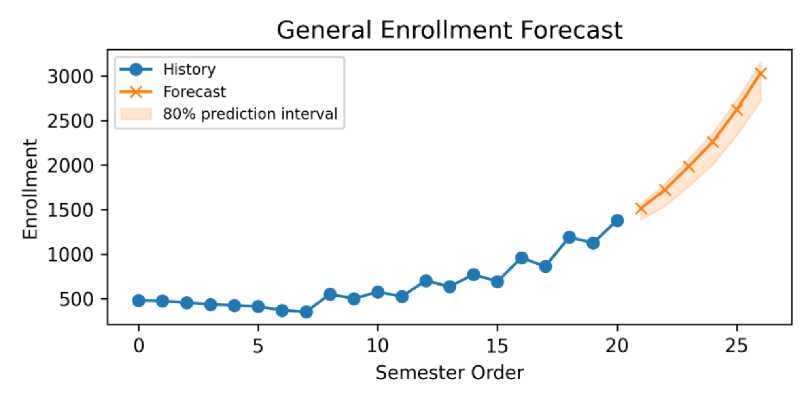
Fig. 2. DCS Enrollment Forecast
-
4.2. BSCS Enrollment Forecast Detailed Analysis
Historical and predicted enrollment path of the BSCS program at NEMSU–Cantilan Campus is shown in Figure 3. The actual enrollment numbers are plotted as a blue line, and while there are slight variations from semester to semester, they generally show an upward trend. These temporary adjustments could be caused by things like curricular changes, shifting entrance requirements, or shifts in the socioeconomic landscape. The model's anticipated values, shown by the orange line, closely match the historical data that has been seen, indicating a good connection between predicted and historical admissions. The projection indicates a steady ascent in student population, stabilizing near the year 2025 (Semester 20), reaching a sustained state influenced by reliable student interest and available institutional capacity. This alignment between actual and projected data demonstrates that the Artificial Neural Network (ANN) model can effectively capture and predict enrollment patterns specific to the BSCS course.
-
4.3 BSCpE Enrollment Forecast Analysis
-
4.4. Forecasting Enrollment of BSIT
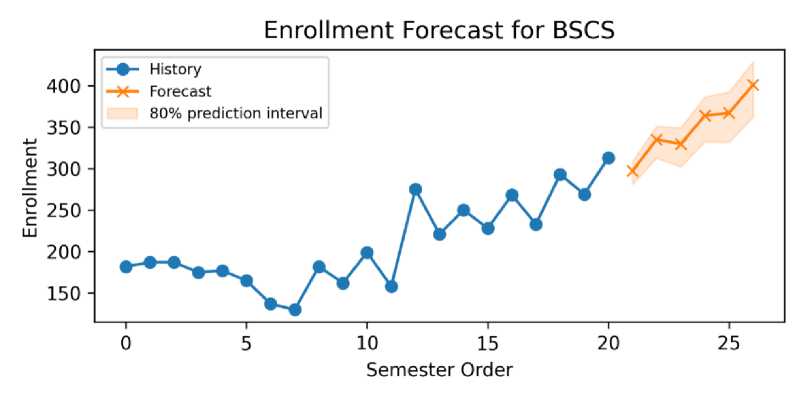
Fig.3. Enrollment Forecast for the Bachelor of Science in Computer Science (BSCS) Program.
The projected enrollment path for the BSCpE program at NEMSU-Cantilan Campus is shown in Figure 4. The historical admissions data, represented by the blue line, shows a steady upward trend despite slight variations from semester to semester. These short-term changes may be attributed to variables such as alterations in the curriculum, shifts in student preferences, or wider economic factors. The orange plot represents the enrollment projection developed using the Artificial Neural Network (ANN) model, which shows significant agreement with the actual historical data. This close alignment confirms the model's ability to effectively capture the changing enrollment dynamics over time. The forecast anticipates a steady growth in the student body, with the total number of enrollees estimated to surpass 140 by the end of the projection cycle. The strong congruence between the observed and forecasted figures demonstrates the ANN model's high reliability and accuracy when predicting future enrollment patterns for the BSCpE program.
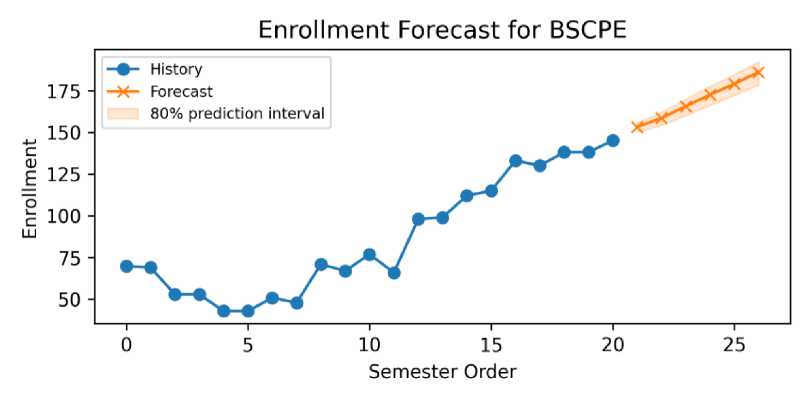
Fig. 4. Enrollment Forecast for the Bachelor of Science in Computer Engineering (BSCpE) Program
The anticipated admissions trend for the BSIT discipline at NEMSU–Cantilan Campus is shown in Figure 5. The blue line charts the recorded enrollment data, initially revealing a measured yet consistent climb in student numbers, which subsequently accelerates into a more robust upward trajectory in later semesters. This observed pattern implies a heightened student attraction to the program, which is likely fueled by the expanding need for IT experts and the university's deliberate institutional strategies to foster technology-centric education.
The orange line represents the enrollment expected by the Artificial Neural Network (ANN) model. This forecast closely resembles the historical data in previous semesters but diverges upward in later periods, producing the expected enrollment trend. This divergence indicates a projected acceleration in enrollment growth, suggesting that the BSIT program is expected to experience a significant rise in student demand in the coming semesters. The strong correlation between the historical and predicted data confirms the ANN model’s effectiveness in capturing both gradual and rapid changes in enrollment behavior, highlighting its ability to model the nonlinear dynamics of student interest in information technology programs.
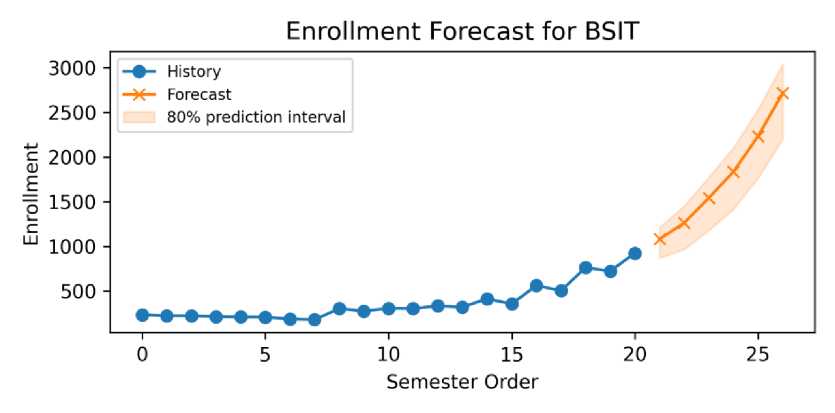
Fig.5. Enrollment Forecast for the Bachelor of Science in Information Technology (BSIT) Program
Table 4 showed the projected student enrollment for the Department of Computer Studies at NEMSU–Cantilan for the years 2025 through 2028. The forecasted enrollment numbers reflect steady growth across the forecast period, with the most significant increase occurring between 2027 and 2028. The 1st semester of 2025 is expected to start with 1,517 students, and by the 1st semester of 2028, enrollment is projected to reach 3,031 students. This indicates an overall growth rate of approximately 100% over the four-year span. The projections show that the enrollment is set to steadily increase, with the highest jump observed in the 2nd semester of 2027, which expects 2,621 students, representing a 21.4% increase from the 1st semester of 2027. These figures suggest a robust demand for computing-related academic programs, driven by the expanding interest in fields such as data science, software development, and digital technologies.
Table 4. Three Year Forecasted Enrollment Data for Department of Computer Studies from 2025 to 2028.
|
Year |
Semester |
Forecast Enrollment |
|
2025 |
2nd |
1517 |
|
2026 |
1st |
1721 |
|
2026 |
2nd |
1985 |
|
2027 |
1st |
2261 |
|
2027 |
2nd |
2621 |
|
2028 |
1st |
3031 |
Table 5 presented the projected student enrollment numbers for three academic programs at NEMSU–Cantilan: Bachelor of Science in Computer Engineering (BSCpE), Bachelor of Science in Computer Science (BSCS), and Bachelor of Science in Information Technology (BSIT) for the years 2025 to 2028. The enrollment data is presented by program, year, and semester, showing the expected number of students for each term. For the BSCpE program, a steady increase in enrollment is anticipated. Starting at 153 students in the 2nd semester of 2025, enrollment is expected to rise to 186 students by the 1st semester of 2028, reflecting a 21.6% increase over the forecast period. The BSCS program follows a similar growth trend, with the number of enrollees increasing from 297 students in 2025 to 401 students by 2028, a 35% growth over the three-year period.
The BSIT program, in contrast, is projected to experience the most significant increase. Enrollment is expected to grow from 1,078 students in the 2nd semester of 2025 to 2,714 students by the 1st semester of 2028, representing an impressive 151% increase. This sharp rise, particularly between the 2nd semester of 2027 and the 1st semester of 2028, reflects the growing demand for IT professionals in sectors such as cybersecurity, data science, and digital transformation. These projections reflect the increasing interest in technology-related programs, particularly the BSIT program, which is expected to see the highest growth due to the expanding need for skilled IT professionals. The overall enrollment trends demonstrate the pivotal role of technology and digital fields in higher education, with the BSIT program leading the way in terms of future student demand.
Table 5. Forecasted Enrollment Data Per Programs (2025-2028)
|
Program |
Year |
Semester |
Forecast Enrollment |
|
BSCPE |
2025 |
2nd |
153 |
|
BSCPE |
2026 |
1st |
158 |
|
BSCPE |
2026 |
2nd |
165 |
|
BSCPE |
2027 |
1st |
172 |
|
BSCPE |
2027 |
2nd |
179 |
|
BSCPE |
2028 |
1st |
186 |
|
BSCS |
2025 |
2nd |
297 |
|
BSCS |
2026 |
1st |
335 |
|
BSCS |
2026 |
2nd |
329 |
|
BSCS |
2027 |
1st |
364 |
|
BSCS |
2027 |
2nd |
367 |
|
BSCS |
2028 |
1st |
401 |
|
BSIT |
2025 |
2nd |
1078 |
|
BSIT |
2026 |
1st |
1260 |
|
BSIT |
2026 |
2nd |
1540 |
|
BSIT |
2027 |
1st |
1834 |
|
BSIT |
2027 |
2nd |
2231 |
|
BSIT |
2028 |
1st |
2714 |
-
4.5. Model Performance Analysis
-
4.6. Academic Planning Implications
Figure 6 presented the Mean Absolute Percentage Error (MAPE) score for the aggregated admissions forecast of the Department of Computer Studies, with the model achieving a low MAPE of 3.62%, signifying superior predictive performance across the combined student population of the BSCS, BSCpE, and BSIT programs. Because MAPE is a single aggregate value rather than a per-semester quantity, Figure 6 is presented as a single summary bar rather than a trend curve, and should not be interpreted as a sequence of forecasted points. This finding strongly validates the ANN model’s dependability in representing long-term enrollment dynamics when data from multiple programs are consolidated, and further confirms the framework's robustness in accurately mapping the overarching growth trend and generating stable, realistic forecasting outcomes for the entire department.
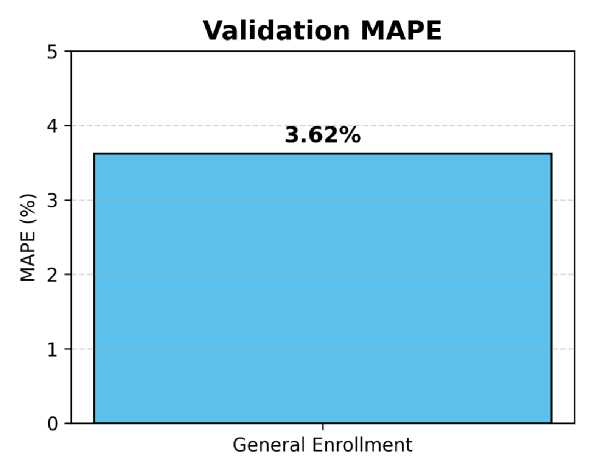
Fig. 6. Validation MAPE for Department of Computer Studies
The research's conclusions offer NEMSU-Cantilan useful information for resource management and academic planning. Reliable enrollment forecasting plays a key role in supporting evidence-based decisions related to faculty hiring, classroom utilization, and curriculum design. The results indicate that the machine learning–driven forecasting approach enables administrators to predict enrollment growth with greater precision, leading to enhanced institutional preparedness and strategic planning. The strong predictive performance observed in the BSCS program implies that machine learning algorithms perform effectively in modeling programs characterized by steady and consistent enrollment trends. Meanwhile, programs such as BSCpE and BSIT exhibit more variable enrollment behaviors, suggesting the importance of adaptive models that can accommodate dynamic shifts in student interest and industry demand.
Three forecasting techniques, later extended to five—Holt-Winters Exponential Smoothing, ARIMA, and the suggested Artificial Neural Network (ANN) framework—were thoroughly evaluated in Table 6 using three complementary metrics—MAPE, RMSE, and MAE—computed on the same chronologically held-out validation/test points for all models, according to their individual Mean Absolute Percentage Error (MAPE) results. With a MAPE of 25.59%, the Holt-Winters model had a limited ability to handle nonlinear student admissions behavior, but it was successful in capturing short-term patterns. The ARIMA method, on the other hand, recorded a higher MAPE of 31.09%, indicating decreased accuracy because of its intrinsic dependence on linear assumptions, a limitation that impairs its performance when examining irregular or rapidly changing datasets. RMSE and MAE follow the same ranking as MAPE (Table 6), giving convergent evidence that the ANN's advantage on this dataset is not an artifact of the MAPE metric specifically. The comparison was subsequently extended to a small, regularized LSTM (one layer, eight hidden units, dropout 0.3, L2 weight decay, early-stopped on validation MAPE) and to Prophet with its default additive trend, both run on the same chronological split. Neither outperforms the proposed ANN on this dataset: the LSTM reaches 11.87% MAPE (RMSE 161.97, MAE 136.86), and Prophet reaches 32.23% MAPE (RMSE 403.61, MAE 371.95), roughly matching ARIMA. This is consistent with the small-sample concern raised in review — with only 14 training points, the LSTM has too few examples to learn a stable temporal representation and ends up under-reacting to the recent acceleration (e.g., predicting 998–1140 for a true sequence of 864–1380), while Prophet's trend component is too smooth to capture the same nonlinear upswing. We read this as a genuine finding rather than a failure to tune: it shows that, at this sample size, a heavier model does not automatically win, and the simpler MLP-with-lags formulation used here is a defensible choice rather than an oversight. We did not attempt a hybrid ARIMA–LSTM model, which would require combining a linear and a neural component in a way that is more involved to regularize correctly at this sample size than either model alone, and we identify this as a direction for follow-up work rather than report a rushed implementation.
The ANN model, conversely, achieved a lower MAPE of 3.62%, indicating better fit to this dataset under the MAPE criterion. The specific configuration of the ANN—which incorporates three input lags and two hidden layers—allowed for enhanced detection of intricate temporal dependencies and relationships. These findings suggest that the ANN framework delivers competitive predictive accuracy compared to the statistical baselines evaluated here, making it a promising candidate for the analysis of complex, multifactor enrollment trends.
This evaluation initially reported only MAPE; following a re-run of the original training pipeline on the underlying dataset, this section has been updated with the additional metrics requested in review. First, RMSE and MAE were computed for the general-series comparison and are now reported alongside MAPE in Table 6: the ANN achieves RMSE = 86.86 and MAE = 48.45, versus RMSE = 327.22 and MAE = 296.93 for Holt-Winters and RMSE = 398.33 and MAE = 361.07 for ARIMA, corroborating the MAPE-based ranking on this dataset. A Diebold–Mariano-style test was also computed on the aligned validation/test points (ANN vs. Holt-Winters: DM = -2.99, p = 0.003; ANN vs. ARIMA: DM = -2.78, p = 0.005); however, with only four aligned points the asymptotic normal approximation underlying this test is not reliable at this sample size, so these statistics are reported for transparency and should be read as indicative only, not as a confirmed significance result. Second, the prediction curves in Figures 2–5 originally displayed point forecasts without confidence intervals; this has been addressed by adding 80% bootstrap prediction intervals, built from each program's own validation residuals and widened by √h at horizon h to reflect the growing uncertainty of the recursive forecast, so the uncertainty around each forecasted value can now be read directly from the shaded band in each figure. Third, reexamining the training code confirms that the Min-Max scalers and lag windows for the validation split were fit only on the training portion of each series and then applied to the validation portion, so the low MAPE on these short, per-program series does not appear to stem from train/validation scaling leakage as initially feared; we nonetheless flag that each program model is trained on only 14 lagged observations and validated on 4, so this finding should still be treated as a small-sample result rather than as evidence of strong generalization. Fourth, the comparison in Table 6 was previously reported only at the aggregated department level; a per-program breakdown is now provided in Table 7 and discussed below, which shows the ANN's advantage is not uniform across programs: validation MAPE is lowest for BSCS (3.93%) and highest for BSIT (13.48%), with BSCpE in between (10.02%). Fifth, the proposed model is architecturally a conventional lagged-feature multilayer perceptron rather than a method developed specifically for this time series; the methodological contribution of this study is therefore best understood as a rigorously validated application and smallsample feasibility case for a single-campus SUC, rather than a novel network architecture, and readers should weigh the result accordingly when comparing it against studies that propose new model designs.
Table 6. Comparative Forecasting Accuracy of Statistical and Machine Learning Models Based on MAPE Values
|
Model Name |
Classification Type |
Prediction Error (MAPE %) |
RMSE |
MAE |
|
This Study |
Machine Learning |
3.62 |
86.86 |
48.45 |
|
Holt-Winters Exponential Smoothing |
Conventional Statistical |
25.59 |
327.22 |
296.93 |
|
ARIMA (Autoregressive Integrated Moving Average) |
Conventional Statistical |
31.09 |
398.33 |
361.07 |
|
LSTM (1-layer, 8 units, dropout, L2) |
Deep Learning |
11.87 |
161.97 |
136.86 |
|
Prophet (additive trend) |
Decomposition-based |
32.23 |
403.61 |
371.95 |
Table 6 reports accuracy only at the aggregated department level. Table 7 below disaggregates the ANN's validation performance by program, using the same 80/20 chronological train/validation split, lag configuration, and hyperparameters described in Section 3.3, re-run directly on the dataset underlying Table 1.
Table 7. Per-Program ANN Validation Accuracy (Same Train/Validation Split as Section 3.3)
|
Program |
n (train) |
n (val) |
MAPE (%) |
RMSE |
MAE |
|
BSCPE |
14 |
4 |
10.02 |
13.97 |
13.82 |
|
BSCS |
14 |
4 |
3.93 |
11.60 |
10.64 |
|
BSIT |
14 |
4 |
13.48 |
153.56 |
108.67 |
The disaggregated results show that the ANN's accuracy is not uniform across the three programs. BSCS, the most stable and gradually growing series, is forecast most accurately (MAPE 3.93%, RMSE 11.60, MAE 10.64). BSCpE, with more volatile semester-to-semester swings at small enrollment counts, is forecast with moderate error (MAPE 10.02%, RMSE 13.97, MAE 13.82). BSIT, the largest and fastest-growing program, has both the highest percentage error and by far the largest absolute error (MAPE 13.48%, RMSE 153.56, MAE 108.67); its four validation points (501, 760, 720, 922 students) fall in the steepest part of the program's recent growth, where the model has the least historical precedent to draw on. This indicates that the strong aggregated MAPE of 3.62% reported in Table 6 is influenced by BSCS's relatively easy-to-forecast pattern and somewhat masks a real, larger absolute error in the BSIT series specifically — the program whose forecast carries the most weight for departmental planning, since it is also the largest and fastest-growing.
5. Conclusion
The study was able to forecast the student enrollment in NEMSU Cantilan Campus. The findings revealed that the Artificial Neural Network (ANN) model offered a more accurate and dependable method for predicting student enrollment trends, outperforming the four statistical and deep-learning baselines evaluated (Holt-Winters, ARIMA, a small LSTM, and Prophet). With a low MAPE of 3.62%, the ANN model successfully identified nonlinear patterns in enrollment data, enabling more accurate predictions on this dataset, subject to the small-sample and per-program caveats discussed in Section 4.6. The projected growth—highlighted by a 100% increase in total enrollment in the Department of Computer Studies by 2028—illustrates the model’s potential to support data-driven decision-making. This projection should, however, be interpreted with two caveats inherent to short-sequence forecasting. First, the recursive six-semester forecast feeds each predicted value back in as an input for the next prediction, so any error present in an early forecasted semester compounds across the remaining horizon rather than being corrected by new observations; the BSIT program’s especially steep projected trajectory is the result most exposed to this effect. Second, with only ten years of historical data per program, the model has limited opportunity to observe how enrollment behaves under conditions not present in the training window (e.g., a policy change, a new campus, or an enrollment cap), and forecasts beyond the validated horizon should be treated as a planning input rather than a guaranteed outcome. As such, ANN-based prediction offers a useful tool for higher education institutions like NEMSU to improve strategic planning, optimize resource allocation, and proactively manage the evolving demands of higher education, alongside continued monitoring against actual enrollment as new semesters of data become available.
All the Declarations and StatementsAuthor Contributions Statement
-
A. A. Dormendo – Conceptualization, Methodology, Software Implementation, Data Curation, and Writing – Original Draft: Proposed the research idea, constructed the ANN forecasting framework, performed data preprocessing and model training, and drafted the manuscript. E. V. Maliberan – Supervision, Validation, and Writing – Review and Editing: Supervised the research design, validated the results using the reported evaluation metrics, and reviewed and edited the manuscript for clarity and academic rigor. Both authors have read and agreed to the published version of the manuscript.
All authors have read and agreed to the published version of the manuscript.
Conflict of Interest Statement
The authors declare no conflicts of interest.
Funding Declaration
This research received no external funding.
Data Availability Statement
The enrollment dataset analyzed in this study was obtained from the Registrar’s Office of NEMSU–Cantilan Campus and contains institutional records that are not publicly available due to privacy considerations. Aggregated data supporting the findings of this study may be made available by the corresponding author upon reasonable request.
Ethical Declarations
This study analyzed institutional, program-level enrollment counts and did not involve human subjects, personal data, or animal research; institutional ethical approval was therefore not required.
Acknowledgments
The authors sincerely thank the Department of Computer Studies and the Registrar’s Office of NEMSU–Cantilan Campus for providing access to the historical enrollment records used in this study, and the reviewers for their constructive comments, which substantially improved the rigor and clarity of this paper.
Declaration of Generative AI in Scholarly Writing
[Authors: please state here whether and how AI or AI-assisted tools were used in preparing this manuscript]
Abbreviations
The following abbreviations are used in this manuscript:
ANN – Artificial Neural Network
LSTM – Long Short-Term Memory
MAPE – Mean Absolute Percentage Error
RMSE – Root Mean Squared Error
MAE – Mean Absolute Error
ARIMA – Autoregressive Integrated Moving Average
DM – Diebold–Mariano (test)
ReLU – Rectified Linear Unit
SUC – State University and College
DCS – Department of Computer Studies
BSCS – Bachelor of Science in Computer Science
BSCpE – Bachelor of Science in Computer Engineering
BSIT – Bachelor of Science in Information Technology
Appendix A\B\C…, with appendix tile
None.
