Bond strength between concrete and steel rebar in circular sections

Author: Ehsani Armin, Nasimi Shahin, Shambina Svetlana Lvovna, Gebre Tesfaldet Hadgembes
Journal: Строительство уникальных зданий и сооружений @unistroy
Article in issue: 1 (121), 2026.
Free access
The object of research. This research seeks to gain a deeper understanding of the mechanisms of force transmission between concrete and steel rebars in circular sections and to provide practical solutions to improve the performance of the structures. The bond strength between concrete and rebar in circular sections has been extensively studied due to its significance in the design and evaluation of reinforced concrete buildings. Compared to other building types, concrete structures are used notably more often, to the extent that most countries in the world are using more concrete than steel. Due to the significance of steel-concrete adhesion and how it affects the behavior of reinforced concrete elements, a thorough investigation into all the factors influencing this adhesion and how they relate to one another is required. In reinforced concrete constructions, steel-concrete adhesion is very crucial and is influenced by the concrete mixing strategy as well as the shape and positioning of the steel. Method. The out-pull test is one of several tests used to determine the adherence between concrete and steel. This study used the pull-out test with three tests to examine the effects of the length of the rebar buried in concrete, the amount of concrete coating on the rebar, and the 28-day compressive strength of concrete on the adhesion between concrete and steel. Results. With the increase in the length of the reinforcement inside the concrete sample, no noticeable changes are observed in the average maximum adhesion stress. According to several experimental studies on the bond strength of concrete and rebar in circular sections, the average maximum adhesion stress rises with the concrete sample's diameter. Additionally, the average maximum adhesive stress rises with an increase in the 28-day compressive strength.
Compressive strength, Adhesion strength, Pull-out test, Adhesion between steel and concrete, Reinforced concrete
Short address: https://sciup.org/143185710
IDR: 143185710 | UDC: 69 | DOI: 10.4123/CUBS.121.4
Прочность сцепления бетона и арматуры в круглых сечениях
Объект исследования. Целью данного исследования является углубленное понимание механизмов передачи усилий между бетоном и арматурой в круглых сечениях и разработка практических решений для повышения эффективности конструкций. Прочность сцепления бетона и арматуры в круглых сечениях широко изучалась в связи с ее значимостью при проектировании и оценке железобетонных зданий. По сравнению с другими типами зданий, бетонные конструкции используются значительно чаще, настолько, что большинство стран мира используют больше бетона, чем стали. Ввиду значимости адгезии стали к бетону и ее влияния на поведение железобетонных элементов, необходимо тщательное исследование всех факторов, влияющих на эту адгезию, и их взаимосвязи. В железобетонных конструкциях адгезия стали к бетону имеет решающее значение и зависит от стратегии смешивания бетона, а также от формы и расположения арматуры. Метод. Испытание на вырыв — один из нескольких методов определения адгезии между бетоном и сталью. В данном исследовании для изучения влияния длины арматурного стержня, заглубленного в бетон, количества бетонного покрытия на арматуре и 28-дневной прочности бетона на сжатие на адгезию между бетоном и сталью использовалось испытание на вырыв с тремя вариантами испытаний. Результаты. С увеличением длины арматуры внутри бетонного образца не наблюдается заметных изменений среднего максимального напряжения адгезии. Согласно нескольким экспериментальным исследованиям прочности сцепления бетона и арматуры в круглых сечениях, среднее максимальное напряжение адгезии возрастает с увеличением диаметра бетонного образца. Кроме того, среднее максимальное напряжение адгезии возрастает с увеличением 28-дневной прочности на сжатие.
Text of the scientific article Bond strength between concrete and steel rebar in circular sections
-
1 Introduction
Reinforced concrete has always been the most popular building material because of its remarkable durability and constructability. It is easy to incorporate reinforcing steel bars into structural concrete to boost the tensile strength of concrete components. The bond strength between concrete and circular sections of reinforcing steel bars has been thoroughly investigated since it is important for the design and assessment of reinforced concrete structures [1]. Considering the importance of adhesion between steel and concrete and its effect on the behavior of reinforced concrete members, it is necessary to conduct an extensive study on the factors affecting this adhesion and its relationship with related variables. The total concrete consumed in the world in 1991 is estimated to be more than 3 billion tons, which means one ton per person in the world. The only substance that humans consume to this extent is water [2], [3]. Adhesion between steel and concrete in reinforced concrete structures is of particular importance, as it depends on the concrete mixing plan and the shape and manner of placing the steel. Concrete is known to have a high compressive strength, and steel has a high tensile strength. Despite having rather diverse
mechanical and physical characteristics, the two parts function as a single, cohesive whole. Steel– concrete composite structures have long been used in civil engineering because they combine the advantages of the two elements to create a structure that is stronger and stiffer than if the steel and concrete were used alone in a non-composite structure [4], [5]. The bond between concrete and rebar in circular sections has been extensively studied and tested in real-world projects [6]. Nonetheless, the bond between concrete and rebar in circular sections, which investigates the adhesion behavior, lacks the same degree of understanding and investigation. A concrete slab that is directly adhered to the surface of a steel beam has been examined based on the adhesive's performance. Adhesion is the reciprocal transmission of forces between concrete and reinforcing bars. The core of reinforced concrete is the mechanism of this collaboration [7]-[9]. The quantity of concrete cover on the rebar, the length of the reinforcement buried inside the concrete, and the concrete's compressive strength are some of the factors that affect adhesion stresses. In the laboratory, the effect of these factors is measured by various tests, the most important of which is the Pull-Out test [10]. The comparison of the obtained results will guide us to know more about the adhesion relationship between concrete and steel with the mentioned variables. Because of technical advancements in material and civil engineering, megastructures such as high-rise buildings have been widely constructed, and this has increased the potential damage when the structures collapse [11]. As a result, requirements of structural safety have become stricter, and impact and blast loadings have often been considered in the structural design. When designing structures against impact and blast loadings, structural safety can be ensured by allowing the structures to dissipate the impact and blast energy through sufficient plastic deformation [12], [13].
However, most design codes and guidelines do not take account of the increase in the required bond force capacity due to the strain-rate effect in the development length design, which threatens the safety of RC structures against bond failure [14]. Therefore, it is necessary to evaluate the safety of RC structures against bond failure under impact and blast loading, and the required dynamic development length should be investigated. The behavior and design of RC structures with stainless steel rebar has been the topic of several recent experimental and numerical modelling research studies, full reviews of which have been reported by several review papers such as those by Rabi et al. [15], Yuan et al. [16] and Moodley et al. [17]. There remains limited literature in the public domain on the structural behavior of stainless-steel RC columns subjected to lateral cyclic loading [18].
Due to the importance of the strength of connection between steel concrete and concrete, from the very beginning of the use of reinforced concrete in the construction industry, the cooperation and behavior of concrete and reinforcement have always been the attention of scientists and researchers, and many works have been done in this field [19], [20]. considering the out pull test, the force is applied to the steel rebar buried in a concrete sample, and during the increase of the force, the adhesive stress value is measured. This adhesion test between steel and concrete is related to Hitt in 1877 [21]. In 1909, Abrams conducted further experiments on this subject [22]. A summary of the greatest advances in the study of adhesive properties in the last century is given in ACI Committee 408 [23]. Sustaining the functionality and minimizing the social, economic and environmental impacts of aging reinforced concrete bridge infrastructure is of high priority in developed countries. In the UK 750 million is spent annually [24] on repairing damaged concrete construction, while Western Europe allocates €5 billion per year [25]. The US spends $8 billion per year on bridge maintenance [26]. These direct costs are relatively easier to quantify compared to the extensive social and economic impacts that arise from the loss of service experienced by the population. Several durability measures are currently implemented in practice to control the corrosion of steel reinforcement, primarily through a combination of the concrete mix quality, concrete cover thickness and crack width control [27]-[29]. However, the desirable high alkali environment provided by the designed concrete mix is not always maintained during the service life of RC structures due to the inherent nature of concrete as a deteriorating porous material. Shear, frictional, and adhesive binding techniques are used to determine how concrete and rebar connect in circular sections. Depending on the rebar design, the proportional contributions of each mechanism to the overall bond resistance vary significantly. The lack of normative guidelines for the bond between concrete and rebar in circular sections has led to notable variations because of different impregnation methods, manufacturing processes, and profiling types [30].
Although the previously described studies demonstrated the beneficial effects of concrete and steel rebar bonding behavior, this particular topic is not entirely explored, and additional research is required to completely comprehend the role of concrete in bond enhancement. The current study examined the effects of the force transmission mechanisms between concrete and steel rebars in circular sections, as well as the bond behavior between concrete and steel rebars. In addition, the current research aimed Ehsani A.; Nasimi S.; Shambina S. L.; Gebre T.H.
Bond strength between concrete and steel rebar in circular sections;
towards analyzing the concrete sample's compressive strength, diameter of embedment length, and length of reinforcement inside the specimen. The impact of steel bar diameter and embedded length on bond strength was examined through testing of twelve pullout bond specimens. The adhesion stress was calculated using the force-sliding diagram data, and the adhesion-sliding stress diagram was compared to those from other studies. Lastly, the bond strength between concrete and rebar in circular sections was predicted using an empirical methodology [31].
-
2 Materials and Methods
2.1 Test Specimens: Pull Out Test
In order to determine the force required to remove the reinforcement from the concrete, it is placed inside a cylindrical or cubic concrete mold. There are two ways to do this test: The first approach, known as reinforcement in the center of the concrete sample, is typically carried out with cylindrical samples. It involves placing the armature inside a cylindrical mold that has a diameter of roughly 7.5 to 20 cm and is proportionate to the armature's diameter in the buried length of 15 to 30 cm. After the concrete has been laid and allowed to cure under the appropriate conditions, the data and sample are put through the test. It is typically composed of a reasonably stiff metal plate with a hole for the reinforcement to pass through in the middle. The hole's diameter is roughly two to three times that of the rebar, and controllable hydraulic jacks are used to progressively apply the tensile force to the rebar. Reinforcement outside the concrete sample's core is the second technique. The ultimate strength of the reinforcements may be significantly influenced by the concrete cover thickness on the rebar, which is frequently thin in reinforced concrete beams and columns. Due to the influence of the thickness of this cover, samples have been designed in which the tested sample consists of a cubic concrete block
A total of 12 samples were considered in this experiment, which produced four different types of concrete samples in four different alternatives. It has a variable 28-day compressive strength and measures 200 mm in length and 120 mm in diameter. 28 days has an average compressive strength of 16.1–20.3–25.6 and 32 newtons per square millimeter. To determine the 28-day compressive strength of the designed samples, the control samples are being tested. A control sample, measuring 30 cm in length and 15 cm in diameter, is included for every sample. were positioned in order to assess the degree of strength of the concrete-steel connection while measuring the concrete's 28-day compressive strength. The average of these measurements serves as the compressive strength criterion. The produced samples were moved to the materials resistance laboratory to undergo the elongation test following a 28-day period of storage in water. The test also made use of a direct rebar tension device. A 1 cm thick steel plate with a 4 cm diameter hole in the middle was utilized as a support for the concrete blocks in order to shatter the samples. The tensile machine has a 100-ton capacity. This plate was set up on the machine's four metal bases. took Since the tensile speed affects the strength of the connection between steel and concrete, the goal is to determine the maximum tensile force that the samples can withstand. Every sample is examined at a particular pace. Since the stretching device's speed is set at 1.25 mm/min, it complies with the specification and is therefore near to practical reality. The components and details of the several specimens used in this study are presented in Fig. 1.
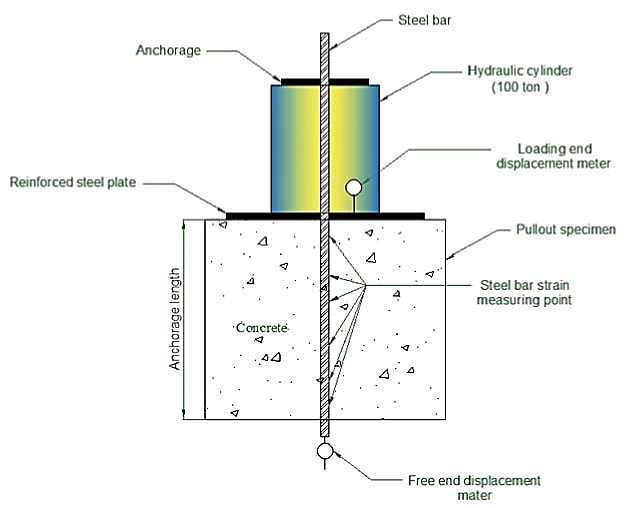
Fig. 1 – setup and components of the adhesion resistance test
-
3 Results and Discussion
These tests were done by a tensile device; the device could be connected to a computer and the force-slip diagram was drawn by the computer itself. Therefore, the adhesion stress at the interfaces was calculated as follows:
F т = nLD
Where:
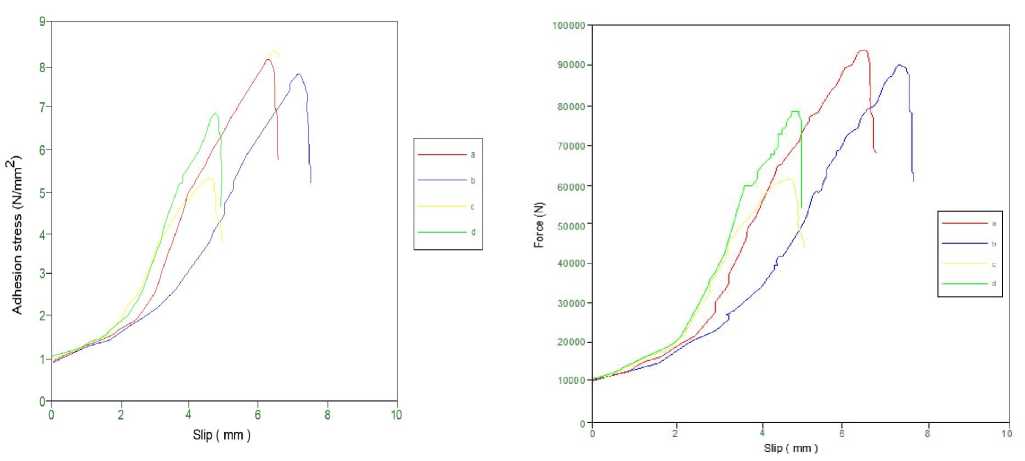
In this equation, т adhesion stress, F tensile force, L the length of the rebar buried in concrete and D the diameter of the rebar), considering the force-sliding diagram data with equation 1, the adhesion stress was computed and the adhesion-sliding stress diagram was compared with different studies. Since there is a sample with L = 200mm, D = 120mm and f = 25.6 N/mm2 in the first, second and third tests. The sample with the above specifications is enough, which are shown in fig. 2(a) and (b).
a) b)
Fig. 2 - Force-slip diagram (a) and Slip-adhesion stress diagram (b)
The following are the parameters that were used throughout each experiment in the current study: Ehsani A.; Nasimi S.; Shambina S. L.; Gebre T.H.
Bond strength between concrete and steel rebar in circular sections;
|
D = Diameter of cylindrical L = Length of cylinder sample sample |
f -Compressive strength of 22 days obtained |
|
f a =Average compressive T (maX)a =Average maximum strength of 22 days obtained adhesion stress |
т max -Maximum adhesive stress |
|
p =The ratio of the cross- f c =22-day compressive sectional area of rebar to the strength is planned cross-sectional area of concrete |
F max -Maximum tensile force |
In this first test, the designed diameter and compressive strength of the sample was fixed and the length of the sample was variable, and the test results were obtained according to Table 1:
Table 1. The results of the first test
|
№ |
Test samples |
D (mm) |
L (mm) |
f (N/mm2) |
f (N/mm2) |
fa (N/mm2) |
P |
F max (N) |
T max (N/mm2) |
T (max)a (N/mm2) |
|
1 |
A |
120 |
100 |
25 |
24 |
____ |
0.022 |
34500 |
6.01 |
____ |
|
B |
120 |
100 |
25 |
27 |
____ |
0.022 |
44400 |
7.87 |
____ |
|
|
C |
120 |
100 |
25 |
25 |
____ |
0.022 |
33210 |
5.87 |
____ |
|
|
D |
120 |
100 |
25 |
26 |
25.25 |
0.022 |
34550 |
6.13 |
6.45 |
|
|
2 |
A |
120 |
150 |
25 |
25.5 |
____ |
0.022 |
57700 |
6.80 |
____ |
|
B |
120 |
150 |
25 |
26.5 |
____ |
0.022 |
59000 |
6.95 |
____ |
|
|
C |
120 |
150 |
25 |
26 |
____ |
0.022 |
64050 |
7.55 |
____ |
|
|
D |
120 |
150 |
25 |
23 |
25.6 |
0.022 |
46200 |
5.44 |
6.68 |
|
|
3 |
A |
120 |
200 |
25 |
26.1 |
____ |
0.022 |
92180 |
8.15 |
____ |
|
B |
120 |
200 |
25 |
24.1 |
____ |
0.022 |
80490 |
7.12 |
____ |
|
|
C |
120 |
200 |
25 |
27.5 |
____ |
0.022 |
61320 |
5.42 |
____ |
|
|
D |
120 |
200 |
25 |
24.7 |
25.6 |
0.022 |
79950 |
7.06 |
6.94 |
|
|
4 |
A |
120 |
250 |
25 |
27.5 |
____ |
0.022 |
91610 |
6.48 |
____ |
|
B |
120 |
250 |
25 |
26.3 |
____ |
0.022 |
118670 |
8.39 |
____ |
|
|
C |
120 |
250 |
25 |
25.4 |
____ |
0.022 |
72460 |
5.12 |
____ |
|
|
D |
120 |
250 |
25 |
26 |
26.3 |
0.022 |
64110 |
4.53 |
6.13 |
|
|
5 |
A |
120 |
300 |
25 |
24.3 |
____ |
0.022 |
103330 |
6.09 |
____ |
|
B |
120 |
300 |
25 |
26.5 |
____ |
0.022 |
115900 |
6.83 |
____ |
|
|
C |
120 |
300 |
25 |
27.6 |
____ |
0.022 |
96090 |
5.66 |
____ |
|
|
D |
120 |
300 |
25 |
25.9 |
26.07 |
0.022 |
92980 |
5.48 |
6 |
According to Fig. 4, the conclusion that can be drawn from the graph is that the drawn graph is almost close to the horizontal line, and this means that for different lengths of the rebar that is buried inside the concrete, there are significant changes in the average value of the maximum adhesive stress. In other words, the length of the rebar inside the concrete has no bearing on the adhesion stress.
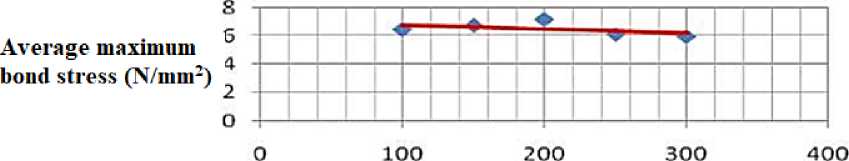
Concrete sample length (mm)
Fig. 4 - Diagram of the length of the concrete sample - average maximum adhesion stress
In the second test, the length and compressive strength of the designed sample were fixed and the diameter of the sample was variable, and the test results were obtained according to Table 2.
Table 2. The results of the second experiment
|
№ |
Test samples |
D (mm) |
f t (N/mm2) |
fa (N/mm2) |
P |
F max (N) |
T max (N/mm2) |
T (max)a (N/mm2) |
|
1 |
A |
59.20 |
25.90 |
0.092 |
41400 |
3.66 |
||
|
B |
59.20 |
26.80 |
0.092 |
37700 |
3.33 |
|||
|
C |
59.20 |
25.10 |
0.092 |
39620 |
3.50 |
|||
|
D |
59.20 |
26.60 |
26.10 |
0.092 |
36170 |
3.20 |
3.42 |
|
|
2 |
A |
86.40 |
24.40 |
0.043 |
51410 |
4.34 |
||
|
B |
86.40 |
26.00 |
0.043 |
46130 |
4.07 |
|||
|
C |
86.40 |
24.70 |
0.043 |
60440 |
5.34 |
|||
|
D |
86.40 |
26.50 |
25.40 |
0.043 |
46910 |
4.14 |
4.52 |
|
|
3 |
A |
105.60 |
23.80 |
0.029 |
55830 |
4.93 |
||
|
B |
105.60 |
25.50 |
0.029 |
61390 |
5.42 |
|||
|
C |
105.60 |
26.40 |
0.029 |
59490 |
5.26 |
|||
|
D |
105.60 |
27.10 |
25.70 |
0.029 |
62870 |
5.55 |
5.29 |
|
|
4 |
A |
120 |
26.10 |
0.022 |
93180 |
8.23 |
||
|
B |
120 |
24.10 |
0.022 |
90490 |
8.00 |
|||
|
C |
120 |
27.50 |
0.022 |
61320 |
5.42 |
|||
|
D |
120 |
24.70 |
25.60 |
0.022 |
79950 |
7.06 |
7.17 |
|
|
5 |
A |
153.60 |
27.60 |
0.013 |
98730 |
8.72 |
||
|
B |
153.60 |
26.30 |
0.013 |
86140 |
7.61 |
|||
|
C |
153.60 |
24.50 |
0.013 |
99120 |
8.76 |
|||
|
D |
153.60 |
25.80 |
26.05 |
0.013 |
95470 |
8.44 |
8.34 |
|
|
6 |
A |
192 |
23.10 |
0.008 |
117000 |
10.43 |
||
|
B |
192 |
27.70 |
0.008 |
116510 |
10.30 |
|||
|
C |
192 |
26.90 |
0.008 |
113040 |
10.00 |
|||
|
D |
192 |
25.40 |
25.77 |
0.008 |
102150 |
9.03 |
9.94 |
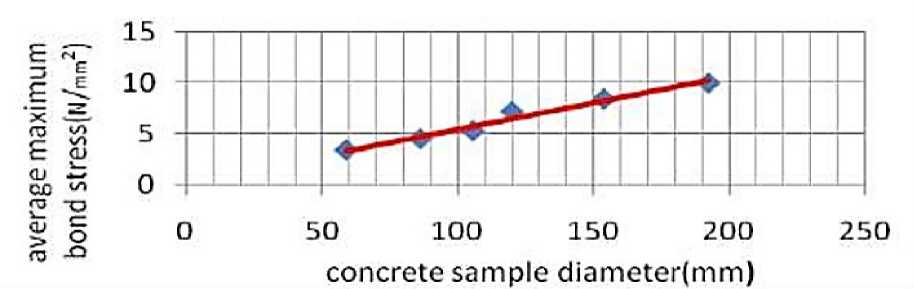
Fig. 5 - Concrete diameter diagram - average maximum adhesion stress
According to the diagram in Fig. 5, with the increase in the diameter of the concrete sample (D) and the constant rebar diameter (d) (what this means is, with the decrease of the value), the adhesive stress increases.
Alternatively, according to the Iranian concrete regulations, the minimum amount of concrete cover on the cross-section of steel to the cross-section of concrete (ρ) of rebars is obtained from the following relationship:
( 2.5 cm tRebar diameter
Maximum value = minimum concrete cover
If higher adhesions are needed, this minimum value will not be enough and it should not be assumed that the desired adhesion tension can be obtained by observing these values. Considering the third experimental results, the length and diameter of the sample was fixed and the designed compressive strength was variable, and the test results were obtained according to Table 3.
Table 3. The results of the third test
|
№ |
Test samples |
D (mm) |
L (mm) |
f c (N/mm2) |
f (N/mm2) |
fa (N/mm2) |
P |
F max (N) |
T max (N/mm2) |
T (max)a (N/mm2) |
|
1 |
A |
120 |
200 |
15 |
16.5 |
0.022 |
38910 |
3.44 |
||
|
B |
120 |
200 |
15 |
16.1 |
0.022 |
45000 |
3.97 |
|||
|
C |
120 |
200 |
15 |
14.2 |
0.022 |
42750 |
3.78 |
|||
|
D |
120 |
200 |
15 |
17.6 |
16.1 |
0.022 |
39840 |
3.52 |
3.67 |
|
|
2 |
A |
120 |
200 |
20 |
19.4 |
0.022 |
80740 |
7.13 |
||
|
B |
120 |
200 |
20 |
22.3 |
0.022 |
73280 |
6.47 |
|||
|
C |
120 |
200 |
20 |
20.9 |
0.022 |
38700 |
3.42 |
|||
|
D |
120 |
200 |
20 |
18.6 |
20.3 |
0.022 |
62180 |
5.49 |
5.62 |
|
|
3 |
A |
120 |
200 |
25 |
26.1 |
0.022 |
93180 |
8.23 |
||
|
B |
120 |
200 |
25 |
24.1 |
0.022 |
90490 |
8 |
|||
|
C |
120 |
200 |
25 |
27.5 |
0.022 |
61320 |
5.42 |
|||
|
D |
120 |
200 |
25 |
24.7 |
25.6 |
0.022 |
79950 |
7.069 |
7.17 |
|
|
4 |
A |
120 |
200 |
30 |
28.6 |
0.022 |
132330 |
11.70 |
||
|
B |
120 |
200 |
30 |
28.2 |
0.022 |
101150 |
8.94 |
|||
|
C |
120 |
200 |
30 |
29.5 |
0.022 |
76310 |
6.74 |
|||
|
D |
120 |
200 |
30 |
30.5 |
29.2 |
0.022 |
89560 |
6.2 |
8.42 |
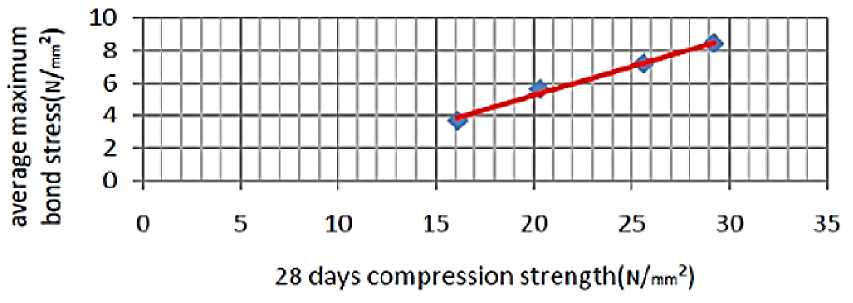
Fig. 6 - 28-day compressive strength diagram - average maximum adhesion stress
According to the diagram in Fig. 6, with the increase of the 28-day strength of concrete ft from the value of 15 N/mm2to the value of 30 N/mm2, the average maximum adhesion stress of O (maX)a also increases. According to the relationship:
-
f b = λ 1 λ 2 f bd ≤ f bm
Where f bm = 0.65^ft and for rebars with a diameter equal to or less than 25 mm is f bd = f bm . [4]. Therefore, f b = A 1 A 2 x 0.657ft , on the other hand, in cases where the concrete coating on the rebar is greater than the diameter of the rebar, it is A 1 = 1 , and also for the coefficient Л 2 , if the concrete coating on the rebar is greater than 2.5 times the diameter of the rebar, it will be A 2 = 1.25 . The mentioned resistances are obtained in Table 4:
Table 4: Comparison of the bond strength (b) of concrete and the average maximum adhesion stress f(max)a
|
f a (N/mm2) |
ft (N/mm2) |
^ (max)a (N/mm ) |
|
16.1 |
3.26 |
3.67 |
|
20.3 |
3.66 |
5.62 |
|
25.6 |
4.11 |
7.17 |
|
29.2 |
4.39 |
8.42 |
From the comparison of ft and i fmaX)a , it can be seen that for the resistance of 16.1 N/mm2, the obtained numbers are close to each other, but with the increase of the resistance of f a , the values of ftmax)a increase significantly compared to the increase of ft, so that it doubles for the resistance of 29.2 N/mm2.
4 Conclusions
Results from several experimental investigations into the bond strength between concrete and rebar in circular sections are presented in this study to provide consideration on certain key issues and present a logical summary of current practice in this particular field. The following are the research's main conclusions:
-
1. By increasing the length of the reinforcement inside the concrete sample, no noticeable changes are observed in the average maximum adhesion stress.
-
2. The strength of the bond between concrete and rebar in circular sections is mostly dependent on friction and is made up of adhesive stress.
-
3. As the diameter of the concrete sample increases, the average maximum adhesion stress increases.
-
4. By increasing the 28-day compressive strength, the average maximum adhesive stress increases and compared to the relationship between the obtained average maximum adhesive stress, it increases significantly.
