
Ceramic Technology and Raw Material Provenance at Niksar Castle: Evidence from Multi-analytical Archaeometry
Journal: Brief Communications of the Institute of Archaeology @ksia-iaran
Section: Средневековые древности
Article in issue: 283, 2026.
Free access
This research presents an archaeometric study of a pottery assemblage recovered from the 2023 excavations at Niksar Castle, aiming to investigate its technological characteristics and raw material composition. From the overall collection of finds, 52 glazed and unglazed ceramic samples were selected for a multi-analytical investigation. The analyses performed include petrography of thin sections under cross-polarized light (XPL), geochemical analysis using Polarized Energy-Dispersive X-ray Fluorescence (PED-XRF), and color measurement in the CIE Lab* color space. Petrographic results enabled the identification of the mineralogical composition, the type and size of inclusions (aggregate), and the textural characteristics of the ceramic paste. Based on these indices, the samples were classified into eight distinct petrographic groups (Gr1–Gr8). The PED-XRF data determined the bulk oxide composition of the bodies, allowing for intra-group and inter-group comparisons. Furthermore, the color analysis results revealed quantitative differences in the lightness (L*) and color components (a* and b*), which served as complementary indices for examining surface characteristics and firing conditions. The integration of these multi-analytical results demonstrates that the studied ceramics exhibit significant diversity in terms of raw materials, production technology, and visual properties. The simultaneous application of petrographic, geochemical, and colorimetric data provides a comprehensive picture of the technological structure of this assemblage, offering a suitable framework for comparison with other contemporary sites in the Pontus and Central Anatolia regions.
Short address: https://sciup.org/143186119
IDS: 143186119 | DOI: 10.25681/IARAS.0130-2620.283.466-486
Технология изготовления керамики и источник сырья в Никсарском замке: данные комплексной археометрии
В статье представлены результаты археометрического исследования керамического комплекса, обнаруженного в ходе раскопок в Никсарском замке в 2023 г., цель которого состоит в изучении технологических характеристик и состава сырья керамических изделий. Для проведения расширенного аналитического исследования отобрано 52 образца глазурованной и неглазурованной керамики. Использованы следующие методы анализа: изучение петрографических шлифов в поляризованном свете (XPL); геохимический анализ с энергодисперсионной поляризованной рентгеновской флуоресценцией (PED-XRF); измерение цвета в цветовом пространстве CIE Lab*. Результаты петрографического анализа позволили определить минералогический состав, тип и размер примесей (заполнителей), а также гранулометрический состав формовочной массы. С учетом указанных показателей выделено 8 петрографических групп (Гр1–Гр8). На основе данных PED-XRF анализа определено содержание кислорода в керамическом тесте, что позволило провести внутригрупповые и межгрупповые сравнения. Кроме того, по результатам анализа цвета выявлены количественные различия в таких параметрах, как светлота цвета (L*) и составляющие цвета (a* и b*), которые использовались в качестве дополнительных индикаторов при изучении характеристик поверхности и условий обжига. Все перечисленные результаты в совокупности показывают, что изученные образцы керамики отличаются большим разнообразием сырья, технологий изготовления и визуальных характеристик. Сочетание петрографических, геохимических и цветометрических данных позволяет получить полную картину технологических процессов рассматриваемого комплекса и предложить приемлемую концептуальную основу для проведения сравнений с другими синхронными памятниками Понта и регионов Центральной Анатолии.
Text of the scientific article Ceramic Technology and Raw Material Provenance at Niksar Castle: Evidence from Multi-analytical Archaeometry
Niksar Castle, located in the Central Black Sea region of northern Anatolia (modern Tokat Province, Turkiye), represents an important fortified settlement strategically positioned between the Çanakçı and Maduru streams overlooking the Kelkit River basin. Archaeological evidence from the site spans from the Hellenistic and Roman periods to the Medieval era. The ceramic assemblage investigated in this study is primarily dated to the 11th–14th centuries CE, corresponding to the Byzantine and early Turkish periods. Its geographical and topographic setting is presented in Fig. 1.
These materials provide a valuable opportunity to examine production technology and raw material procurement within a strategically significant settlement of the Pontus region. Ceramics are among the most culturally significant materials in archaeology because they persist over long time scales and carry information regarding production technology, raw material sources, organization of production, and exchange networks ( Lozada-Mendieta, Villagran , 2025). Classical approaches to pottery study – morphology, typology, and function – when combined with laboratory methods, can reconstruct the entire «pottery life cycle» from raw material procurement to production and distribution ( Tite , 2008). Within this framework, Tite’s seminal review on «Ceramic production, provenance and use» emphasizes the crucial role of physicochemical methods in addressing questions of provenance, firing technology, and function pottery ( de Caro et al. , 2024; Tite , 2008). Thin-section petrography is a cornerstone technique in ceramic archaeometry. Direct observation of the fabric, matrix, porosity, and non-plastic inclusions (minerals and rock fragments) provides critical data on clay preparation, temper selection, and its linkage to local geology ( Gibbs , 2014; Ixer , 2014). Quinn’s comprehensive guide to thin-section pottery interpretation demonstrates how microscopic data can be translated into answers about provenance and technology ( Quinn , 2013). On a more classical level, Whitbread’s influential work on Greek transport amphorae ( Ixer , 2014; Quinn , 2013) established that the systematic description of thin sections and the definition of «fabrics» can elucidate regional production centers and distribution routes ( Allepuz , 2021; Vasileiou, Vionis , 2024). This approach subsequently inspired widespread studies of Roman and Byzantine pottery ( Fitzpatrick et al. , 2003; Parsons , 2012). Literature on «integrated approaches» in petrography stresses that optimal results are achieved when petrography is combined with geochemistry (e. g., XRF/ICP) and microstructure analysis (SEM-EDS) ( Doménech-Carbó et al. , 2022; Rosiak et al. , 2025). This integration is necessary because certain questions, such as distinguishing similar clay sources or differentiating local from imported production, are often not adequately resolved by a single method ( Ixer , 2018; Integrative Approaches…, 2016; Quinn , 2013).
Chemical characterization of the ceramic paste is a primary focus for provenance determination and grouping production outputs ( Coşkun, Muşkara , 2026). In recent decades, X-ray Fluorescence (pXRF) has gained popularity due to its speed, cost-effectiveness, and field portability. However, specialized literature emphasizes the necessity of calibration, uncertainty control, standardized sam-pling/measurement protocols, and caution in interpreting semi-quantitative data ( Rahman et al. , 2025). Specifically for glazed materials/tiles, recent research
Fig. 1. Location and topographic map of Niksar Castle in Tokat Province, Northern Anatolia indicates that pXRF can be valuable for the body, glaze, and pigments, but the measurement mode, dwell time, and error correction model are critical factors (Li et al., 2024; Travé Allepuz et al., 2025).
SEM-EDS is employed in ceramic archaeometry for two main purposes: 1) studying microstructure and the stages of vitrification/sintering to infer firing conditions ; and 2) analyzing localized composition (e. g., in glazes, secondary phases, or reaction zones) ( Drob et al. , 2021; Gogâltan , 2016). In the classic tradition of firing technology interpretation, works related to the concept of the «degree of vitrification» and its correlation with equivalent firing temperature hold a special place. The literature on firing temperature estimation also highlights that determining the maximum firing temperature is not always straightforward, with various methods (from thermal expansion to magnetometry) proposed for its estimation ( Drob et al. , 2021; Rahman et al. , 2025; Vasileiou, Vionis , 2024).
For the Late Hellenistic, Roman, Byzantine, and Ottoman periods in Anatolia, lead-glazed ceramics and various «ware groups» constitute a significant part of the material culture. Studies, such as one on lead-glazed pottery from Izmir (Smyrna) ( Özçatal et al. , 2014), demonstrate that the composition of the glaze and body can provide insights into workshop technology and the transmission of technical knowledge across different periods. In the Byzantine and medieval spheres, technological studies of glazes (SEM-EDS and XRF) on various assemblages show that combining methods is highly effective for separating «recipes» and probable provenance ( Enayat et al. , 2026; Simsek et al. , 2019). Examples of this approach are seen in glaze-focused research and works on Byzantine productions, as well as more recent studies of medieval ceramics ( Bayazit, Can , 2025). In Anatolia, ceramic archaeometry studies are crucial not only for provenance but also for reconstructing the « production econo-my» . For instance, research concerning the Sagalassos area ( Degryse et al. , 2003) demonstrated that examining clay resources and linking them to workshop production can illuminate the development path of local production and the utilization of environmental resources ( Liard , 2024). Furthermore, archaeometric studies on characteristic Roman-era wares, such as the example in ( Semiz et al. , 2018), from assemblages in ancient Anatolian cities (Tripolis) have shown that XRF/complementary methods can reveal production groups and technological differences. Complementary to these, research related to Iznik tiles and production, utilizing pXRF and other methods, serves as a good example of non-destructive and field applications in Tur-kiye, showing how compositional analysis can differentiate body and pigment variations ( Demirsar Arli, Şimşek Franci , 2024).
Published research on the pottery finds from the Niksar excavations (e. g., the 2021 season and typological form analysis) indicates that this site, particularly in terms of its chronological diversity and medieval assemblages (especially 11th–14th centuries), holds high potential for combining typology and archaeometry (Semiz et al., 2018; Yiğitpaşa et al., 2022). In recent years, color measurement in the CIE Lab space has garnered attention as supplementary data for discussions concerning firing atmosphere, surface grain size, coatings, and even technological classifications. The CIE/ISO standard for defining the L*a*b* space is the main reference for this work (Aljamhan et al., 2022; Douglas, Brewer, 2003; McGrath et al., 2017; NCT03064516…, 2017). Applied studies also demonstrate that colorimetry can be useful for analyzing slip/surface color or for experimental color comparison; for example, (McGrath et al., 2017) discusses the analysis of slip color and its repeatability within the CIELAB framework.
-
2. Materials and Methods
-
2.1. Archaeological Context and Sample Selection. This research focuses on the pottery assemblage recovered from the 2023 excavations in the inner castle of Niksar. The 2023 excavations were conducted in an area that had not yet reached the floor level of the structures, and the layers were predominantly mixed and lacked clear stratigraphy; thus, a definitive connection between spaces and finds is limited at this stage. The studied samples comprise 52 pieces of glazed and unglazed pottery (selected as the collection) chosen from the trenches/test pits KV-a3, KV-a4, KIV-e3, KIV-e4, KIV-d3, and KIV-d4 (Representative ceramic fragments from the studied assemblage are presented in Fig. 2). According to excavation documentation, a total of 441 pottery fragments (178 unglazed and 263 glazed) were registered, and the laboratory samples were selected from this collection.
-
2.2. Sample Preparation and Coding. Each sample was assigned a unique code from NKK-B1 to NKK-B52 (corresponding to the thin-section image set). For quality control and data traceability, the laboratory results and microscopic images were used throughout the analysis and interpretation based on these specific codes.
-
2.3. Thin-Section Petrographic Analysis under Polarizing Microscope. Petrographic thin sections were prepared and examined to determine the textural and mineralogical characteristics of the ceramic paste. The thin-section images presented in this study were recorded under Cross-Polarized Light (XPL) .
-
The following indices were considered in the petrographic interpretation:
-
• Mineralogical Composition (e. g., Q: Quartz; Pl: Plagioclase; Py: Pyroxene; By: Biotite, Am: Amphibole; etc.)
-
• Aggregate Grain Size (fine/medium/coarse based on defined ranges)
-
• Porosity Percentage ( P % ) and the Matrix-to-Aggregate Ratio ( MTA % ) as technological and paste preparation indices.
-
2.4. Elemental/Oxide Analysis with PED-XRF. The Polarized Energy-Dispersive X-ray Fluorescence (PED-XRF) method was utilized to determine the chemical composition of the ceramic bodies.
Based on petrographic features and the assumed source rock type, the samples were classified into eight petrographic groups (Gr1-Gr8). The estimated firing temperature range, porosity, and aggregate ratio were reported for each group. For instance, the groups include sources such as altered andesite, phyllite, andesitic-basaltic, basalt, mudstone, albite/feldspar, chlorite schist, and andesite.
At this stage, the XRF data were used for:
-
• Intra-group and inter-group comparison of the samples.
-
• Checking the consistency of the petrographic grouping with geochemical patterns.
-
• Evaluating the probability of local/non-local production.
-
2.5. Colorimetry. To record the color characteristics of the surface/body (as a complementary index for firing conditions, surface quality, and technological
-
2.6. Data Evaluation and Grouping Rationale. The main analytical logic in this research is based on a multi-analytical approach (Tab. 1), meaning that:
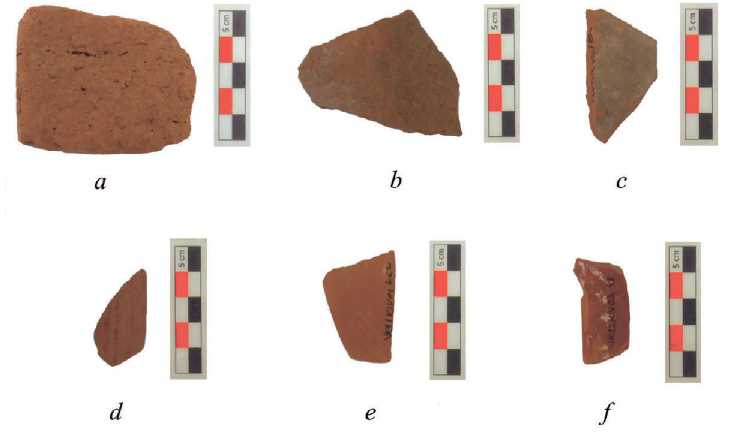
Fig. 2. Representative ceramic fragments selected from petrographic groups a – Gr1; b – Gr3; c – Gr4; d – Gr5; e – Gr6; f – Gr7
The specimens illustrate variability in raw material composition, surface characteristics and technological features
Scale bar: 5 cm differences), color measurement data were used alongside other analyses. This data is interpreted in the results section in a comparative manner and linked to the petrographic groups and XRF data.
-
• First , grouping is performed based on petrography (mineral composition, aggregate size, porosity, and source rock).
-
• Second , geochemical patterns (PED-XRF) are employed to confirm/reinforce
or better differentiate the groups.
-
• Finally , colorimetry is used as complementary data to explain surface differences, firing conditions, and production quality.
-
3. Results
-
3.1. Petrographic Analysis Results (Thin Section – XPL). Petrographic analysis of thin sections from 52 ceramic samples from the 2023 Niksar Castle excavations, under cross-polarized light (XPL), facilitated the identification of mineralogical composition, paste texture, aggregate size and type, and the source rock of the raw materials (The main petrographic features of the identified ceramic groups are summarized in Tab. 2). Based on these results, the samples were classified into eight distinct petrographic groups (Gr1–Gr8) showing clear differences in mineral composition, paste type, and technological features (Representative thin-section micrographs of each petrographic group are presented in Fig. 3).
-
Table 1. Data Evaluation and Grouping Rationale
|
Analytical Method |
Main Objective |
|
Thin Section (XPL) |
Identification of mineralogy, fabric, and aggregate characteristics |
|
PED-XRF |
Determination of bulk chemical (oxide) composition |
|
Color analysis (L*A*b*) |
Evaluation of surface color characteristics and firing conditions |
Table 2. Petrographic characteristics of ceramic samples from Niksar Castle Excavation (2023)
|
Ceramic Groups |
T (°C) |
P (%) |
MTA etc.* (%) |
Grain Size** |
Rocks and Minerals*** |
Rock Origin |
|
Gr1 |
850–900 |
8 |
25–45 |
Medium |
Q, Ç, Pl, By, Am, Op |
Clayey Andesite |
|
Gr2 |
900–950 |
8 |
25 |
Fine |
Q, Pl, Op |
Fillit |
|
Gr3 |
850–900 |
7 |
40 |
Medium |
Q, Pl, Py, A, B, Op |
Andesitic Basalt |
|
Gr4 |
850–900 |
15 |
45 |
Medium |
Q, Pl, Py, Pr, Sr, Mg, Im, B, Op |
Basalt |
|
Gr5 |
900–950 |
3 |
15 |
Fine |
Q, Ç, Pl, Op |
Claystone |
|
Gr6 |
950 < |
1 |
55 |
Fine |
Q, Ç, Pl, Al, Op |
Albite/Feldspar |
|
Gr7 |
< 700 |
5 |
75 |
İri |
Q, Pl, By, Kl, Gt, Op |
Chlorite Shale |
|
Gr8 |
800–850 |
8 |
35 |
İri |
Q, Pl, Py, By, Am, H, Mg, Op |
Andesitic |
Groupings of ceramic samples :
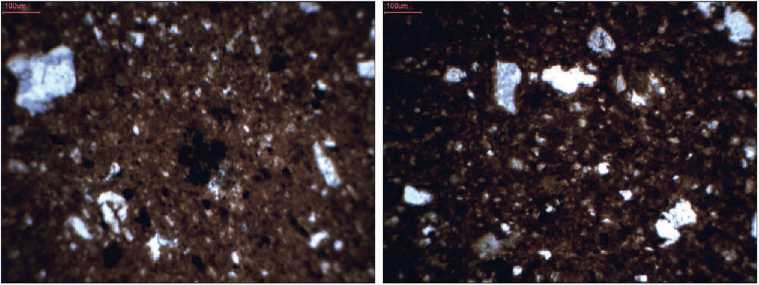
Gr1 : NKK-B1, NKK-B2, NKK-B3, NKK-B4, NKK-B5, NKK-B6, NKK-B7, NKK-B8, NKK-B9, NKK-B11, NKK-B13, NKK-B14, NKK-B15, NKK-B16, NKK-B18, NKK-B19, NKK-B20, NKK-B22, NKK-B24, NKK-B25, NKK-B26, NKK-B33; Gr2 : NKK-B10; Gr3 : NKK-B12; Gr4 : NKK-B17,NKK-B34; Gr5 : NKK-B21, NKK-B23, NKK-B35, NKK-B36, NKK-B39; Gr6 : NKK-B27, NKK-B28; Gr7 : NKK-B29, NKK-B30, NKK-B31, NKK-B32; Gr8 : NKK-B37, NKK-B38, NKK-B40;
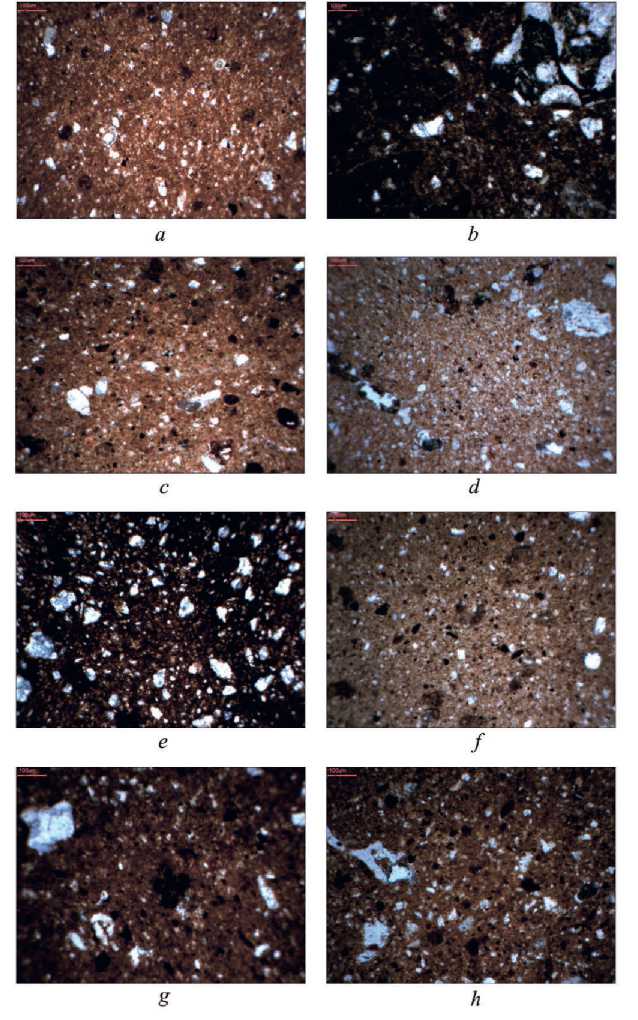
Fig. 3. Representative thin-section micrographs (crossed polarized light, XPL) of the eight petrographic groups identified in the ceramic assemblage from Niksar Castle a – Gr1 (NKK-B22); b – Gr3 (NKK-B12); c – Gr4 (NKK-B34); d – Gr8 (NKK-B38);
e – Gr2 (NKK-B10); f – Gr5 (NKK-B36); g – Gr6 (NKK-B27); h – Gr7 (NKK-B29)
Scale bar = 100 µm
-
3.1.1. Petrographic Group 1 ( ceramic Gr1 ) . In XPL images of this group, Quartz (Q) with first-order interference colors, Plagioclase (Pl) with characteristic twinning, along with smaller amounts of Biotite (By), Amphibole (Am), and opaque minerals are observed. The aggregates are primarily medium-sized (0,5–1 mm), and their distribution within the matrix is relatively uniform. The aggregate-to-matrix ratio is high, and the paste texture indicates the use of volcanic raw materials. These characteristics are consistent with an altered (clarified) Andesite source and suggest that this group is likely the result of local production utilizing the geological resources around Niksar (Fig. 4). The uniformity of the texture and mineralogical composition points to a relatively stable production tradition within this group.
-
3.1.2. Petrographic Group 2 ( Ceramic Gr2 ). This group is represented by only one sample (Fig. 5). In XPL images, the dominant composition includes quartz and plagioclase with a fine-grained texture. The matrix is dense, and the aggregate quantity is lower compared to Group 1. The source rock for this sample is attributed to Phyllite, indicating a different raw material selection than other groups. This feature may suggest limited production or that this sample is an import.
-
3.1.3. Petrographic Group 3 ( Ceramic Gr3 ) . In this group, in addition to quartz and plagioclase, the presence of Pyroxene (Py), amphibole, and lithic fragments of basaltic nature is discernible in the XPL images (Fig. 6). The aggregates are mainly medium-sized, and the paste texture points to an Andesitic – Basaltic source. This mineralogical composition indicates the use of volcanic resources and a relatively uniform firing technology.
-
3.1.4. Petrographic Group 4 ( Ceramic Gr4 ) . This group is characterized by high mineralogical diversity. In XPL images, quartz, plagioclase, pyroxene, sericite, magnetite, and ilmenite are observed. The aggregates are medium to relatively coarse, and the matrix is heterogeneous (Fig. 7). The source rock of this group is attributed to Basalt, indicating a durable paste suitable for everyday functional vessels.
-
3.1.5. Petrographic Group 5 ( Ceramic Gr5 ) . In this group, the mineralogical composition includes quartz, chert, and plagioclase (Fig. 8). The aggregates are predominantly fine, and the raw material source is attributed to Mudstone. These characteristics suggest the use of sedimentary clays and appropriate control over the firing process.
-
3.1.6. Petrographic Group 6 ( Ceramic Gr6 ) . This group is characterized by the dominance of Albite and Feldspar. The aggregates are very fine, and the matrix is dense, indicating a high degree of vitrification of the paste (Fig. 9). Based on petrographic features, the firing temperature for this group is estimated to be above 950 °C. The raw material source is attributed to feldspar-rich sources.
-
3.1.7. Petrographic Group 7 ( Ceramic Gr7 ). In the XPL images of this group, the presence of quartz, plagioclase, biotite, chlorite, and garnet is observed. The aggregates are coarse (˃ 1 mm), and the source rock is attributed to Chlorite Schist (Fig. 10). This group was likely produced at lower firing temperatures (less than 700 °C), representing a different production tradition.
-
3.1.8. Petrographic Group 8 ( Ceramic Gr8 ). This group has a volcanic composition, including plagioclase, pyroxene, amphibole, and biotite. The aggregates are relatively coarse, and the raw material source is attributed to Andesite (Fig. 11). These features suggest local production utilizing the region’s geological resources.
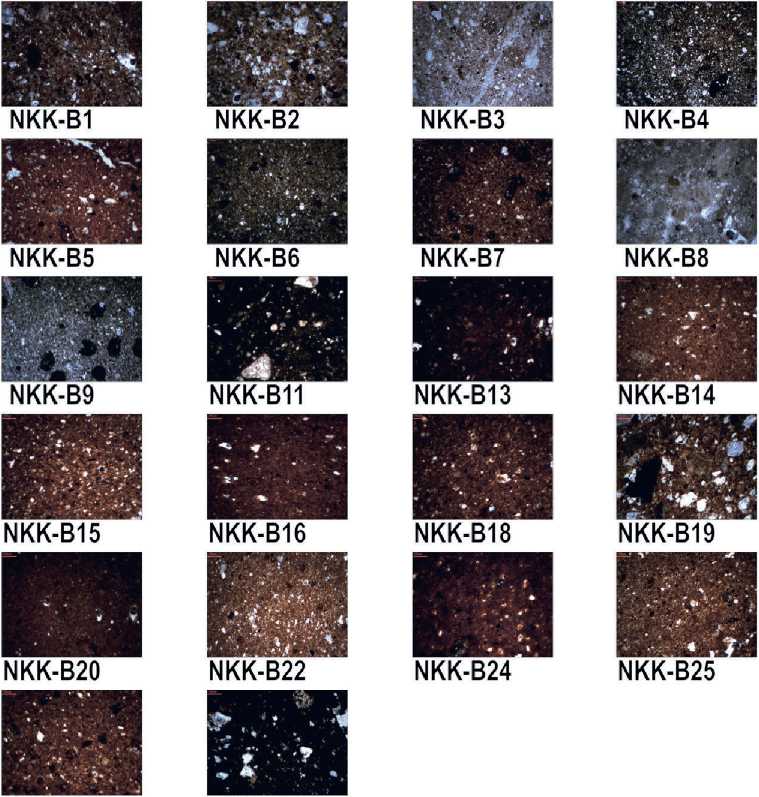
NKK-B26 NKK-B33
Fig. 4. Thin Section Photographs Petrographic Group 1 (samples: NKK-B1, B2, B3, B4, B5, B6, B7, B8, B9, B11, B13, B14, B15, B16, B18, B19, B20, B22, B24, B25, B26, B33)
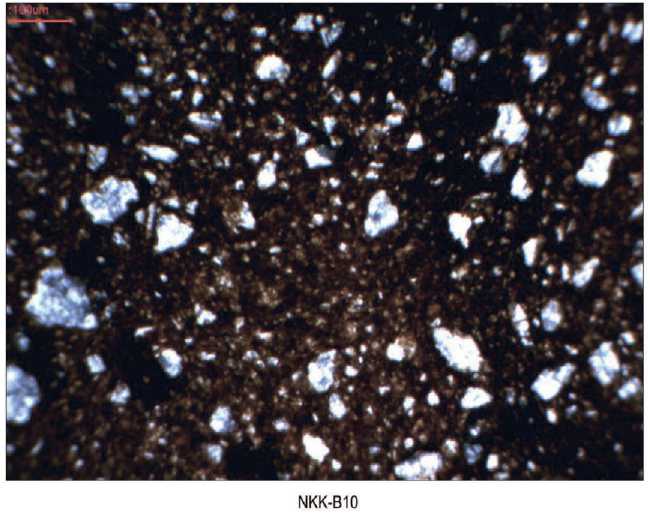
Fig. 5. Thin Section Photographs Petrographic Group 2 (sample: NKK-B10)
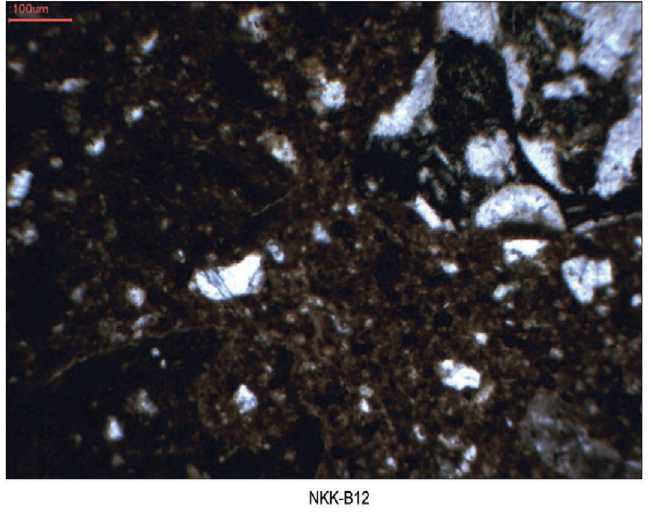
Fig. 6. Thin Section Photographs Petrographic Group 3 (sample: NKK-B12)
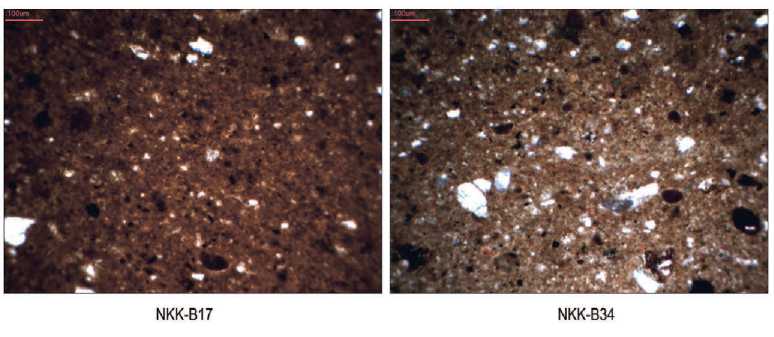
Fig. 7. Thin Section Photographs Petrographic Group 4 (samples: NKK B17 and NKK-B34)
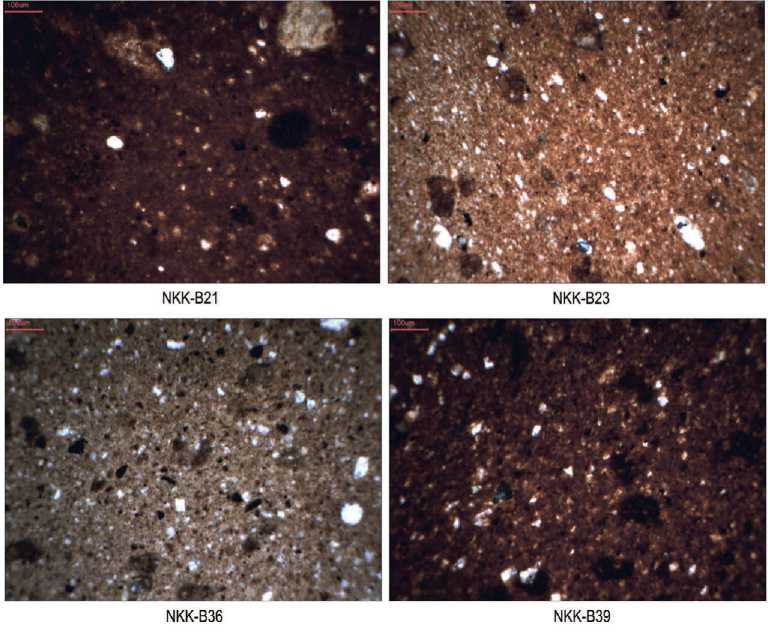
NKK-B21
NKK-B23
NKK-B36
NKK-B39
Fig. 8. Thin Section Photographs Petrographic Group 5 (samples: NKK-B21, B23, B35, B36, B39)
NKK-B27 NKK-B28
Fig. 9. Thin Section Photographs Petrographic Group 6 (samples: NKK-B27 and NKK B28)
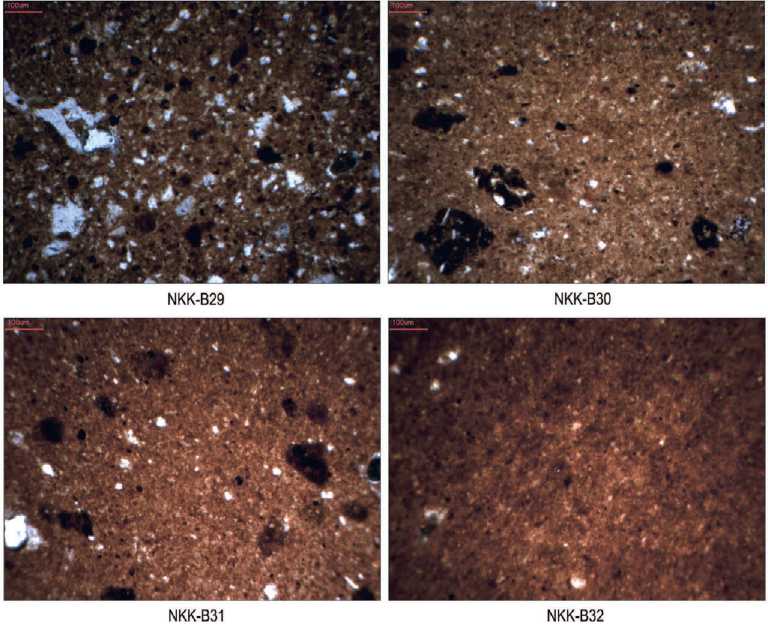
Fig. 10. Thin Section Photographs Petrographic Group 7 (samples: NKK-B29, B30, B31, B32)
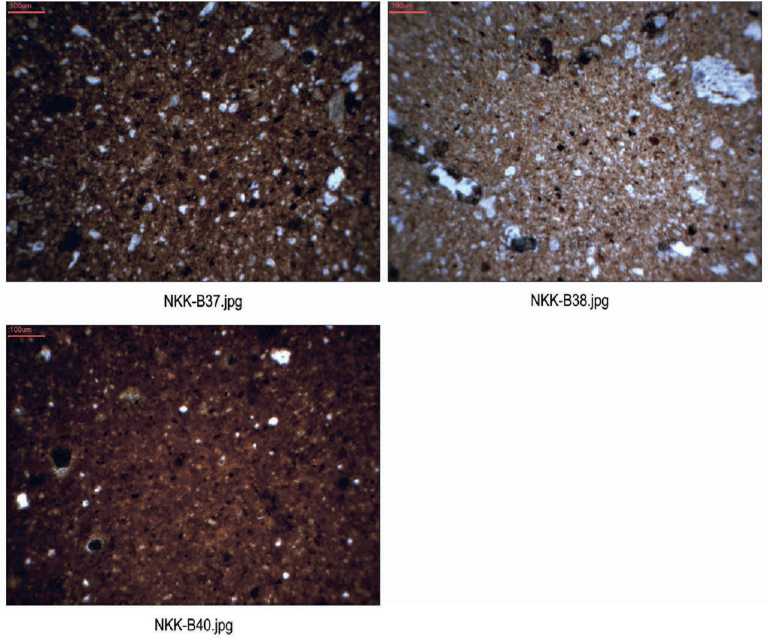
Fig. 11. Thin Section Photographs Petrographic Group 8 (samples: NKK-B37, B38, B40)
-
3.2. PED-XRF Analysis Results. PED-XRF analysis was conducted on the 52 selected pottery samples from Niksar Castle to determine the chemical (oxide) composition of the ceramic bodies. The results of this analysis allow for intra-group and in-ter-group comparisons and were used to evaluate the consistency of the geochemical data with the petrographic grouping (Gr1–Gr8).
-
3.2.1. Overall Oxide Composition. Generally, the chemical composition of the ceramics is characterized by a predominance of SiO2 and Al2O3, indicating the use of silicate-rich clays as the primary raw materials. Following these two major components, CaO, Fe2O3, MgO, K2O, and Na2O constitute substantial proportions of the samples’ chemical composition. Variations in Fe2O3 and MgO concentrations among some samples may reflect the contribution of volcanic raw materials and/or the presence of basaltic and andesitic inclusions.
-
3.2.2. Comparison of PED-XRF Results with Petrographic Groups. The comparison of geochemical results with the petrographic grouping indicates that the XRF data generally show good consistency with the thin-section analysis results.
-
-
• Group Gr1 is characterized by relatively higher SiO 2 and A1 2 O 3 and moderate CaO and Fe 2 O 3 values, which is consistent with the altered andesite source and the mineralogical composition observed in XPL.
-
• Groups Gr3 and Gr4 show higher Fe 2 O 3 and MgO values, confirming the presence of basaltic and andesitic lithic fragments.
-
• Group Gr5 exhibits a different pattern with a relative increase in SiO2 and a decrease in CaO and MgO, which is compatible with the use of sedimentary clays (Mudstone).
-
• Group Gr6 is distinguished by significant Na 2 O and K 2 O values, which can be linked to the dominance of feldspars and albite in the petrographic composition of this group.
-
• Group Gr7 shows greater variability in oxide composition, likely related to the heterogeneity of metamorphic raw materials (Chlorite Schist).
-
3.2.3. Geochemical Patterns and Raw Material Provenance. The overall patterns of the PED-XRF data suggest that most samples fall within the typical compositional range of pottery produced using local Anatolian clays. The observed variations in CaO and Fe 2 O 3 are likely related to differences in clay source selection, the amount of carbonate impurities, and the contribution of volcanic aggregates. In conclusion, the geochemical results support the hypothesis of local production using multiple raw material sources while also indicating chemical differences among groups, suggesting the possibility of more than one production tradition or workshop.
-
3.3. Color Analysis Results (CIE L*a*b*). Color analysis was performed on the 52 ceramic samples to evaluate the surface/body color characteristics and investigate their relationship with raw material composition and firing conditions Measurements were conducted in the CIE L * a * b * color space, which allows for quantitative comparison of lightness (L*) and and two opponent chromatic axes: the red (+a*)–green (-a*) axis and the yellow (+b*)–blue (-b*) axis.
-
3.3.1. General Color Characteristics of the Pottery. The color analysis results show that L* values span a relatively broad range among the samples, indicating differences in body lightness. These variations can be attributed to factors such as the type of raw material, the amount of iron oxides, the oxidizing or reducing conditions of the firing atmosphere, and the firing temperature. a* values are predominantly positive, indicating a prevalence of red-leaning hues, while b* values are generally positive, showing a tendency towards yellow-brown colors. This pattern is consistent with the presence of Fe 2 O 3 and other chromophore oxides in the chemical composition of the bodies.
-
3.3.2. Comparison of Color Results with Petrographic Group. Comparing the colorimetry data with the petrographic grouping (Gr1–Gr8) reveals that some groups show relatively similar color patterns, while distinct differences are observable among others.
-
-
• Groups with a volcanic source (such as Gr1, Gr3, Gr4, and Gr8) generally exhibit higher a* and b* values, which is consistent with the higher presence of iron and magnesium oxides in the chemical composition of these groups.
-
• Group Gr5, made from sedimentary clays (Mudstone), shows higher L* values in many samples, indicating lighter and more uniform bodies.
-
• In Group Gr7, greater variability in color values is observed, likely related to the heterogeneity of the metamorphic raw materials and different firing conditions.
-
3.3.3. Relationship between Color Analysis, Chemical Composition, and Firing Technology. Overall, the color analysis results show good consistency with the petrographic and PED-XRF data. Samples with higher Fe2O3 and MgO values generally tend towards darker, red-brown colors, while samples with a more silicated and lower iron composition show lighter colors. The variations observed in L* values can also reflect differences in firing temperature and/or kiln atmospheric conditions (oxidizing versus reducing).
-
4. Discussion
-
4.1. Raw Material Provenance and Production Traditions. Petrographic results indicate that the ceramic bodies from Niksar Castle are not uniform in geological provenance and aggregate composition, encompassing at least eight tech-nological/provenance groups (Gr1-Gr8). This diversity directly reflects the utilization of varied raw material sources (clay and temper) and likely the existence of multiple production traditions in the region. In the dominant groups (especially Gr1, Gr3, Gr4, and Gr8), the co-occurrence of volcanic minerals and lithic fragments, such as plagioclase, pyroxene, amphibole, and opaque minerals, along with quartz, suggests that the raw material or temper for a significant portion of the samples was supplied from volcanic sources (andesite/basalt and their derivatives). This is fully consistent with attributing the source rock of these groups to altered andesite, andesitic–basaltic, basalt, and andesite. Given that these source rocks are typically accessible within the local/regional geology, the most logical interpretation is that the majority of the pottery was likely produced in a local or near-local setting, but relying on multiple raw material sources rather than a single clay quarry. In contrast, the existence of groups with sources such as Phyllite (Gr2), Mudstone (Gr5), Albite/Feldspar (Gr6), and Chlorite Schist (Gr7) indicates that, alongside volcanic resources, sedimentary and metamorphic raw materials were also utilized. This pattern may reflect diversity in raw material selection by one or several local workshops, depending on functional requirements or seasonal accessibility. Alternatively, it may indicate the limited importation of certain products from nearby supply areas. The variation in aggregate grain size and Matrix-to-Ag-gregate ratios further supports technological differentiation. Groups with coarser aggregate (e. g., Gr7) may indicate deliberate temper selection to enhance thermal or mechanical resistance, whereas groups with finer aggregate and denser matrices (e. g., Gr6) likely reflect better clay refinement and greater control over paste preparation.
-
4.2. Firing Technology, Porosity and Production Quality. A key finding of this research is the wide range of estimated firing temperatures and significant differences in porosity (P %) among the petrographic groups. These variations are directly related to technological control, kiln performance, and possibly vessel function. Gr6 represents the most technologically advanced group, with an estimated firing temperature above 950 °C and the lowest porosity (P ≈ 1 %). This combination suggests more complete
-
-
4.3. Integration of Petrography and PED-XRF Results. The convergence between petrographic observations and PED-XRF data strengthens the reliability of the grouping and technological interpretations. In volcanic groups (Gr1, Gr3, Gr4, Gr8), the relative increase in Fe2O3, MgO, and CaO is consistent with the presence of plagioclase, pyroxene, amphibole, and basaltic–andesitic lithic fragments observed in thin sections. This confirms the volcanic provenance of raw materials and demonstrates that mineral tempers significantly influenced bulk chemical composition. Conversely, sedimentary and metamorphic groups (Gr5, Gr6, Gr7) exhibit distinct chemical signatures. For example, Gr5 shows relative enrichment in SiO2 and reduced Fe2O3 and MgO, compatible with sedimentary clay sources. Gr6 displays higher Na2O and Al2O 3 values, reflecting the dominance of feldspar-rich materials. Gr7 shows greater dispersion in oxide values, consistent with its heterogeneous metamorphic origin. The intersection of mineralogical and geochemical evidence indicates that the Gr1-Gr8 classification is robust and not a product of superficial firing variation. Instead, the differences primarily reflect deliberate raw material selection and distinct production traditions.
-
4.4. Interpretation of Color Analysis (CIE Lab*). Color analysis provides a complementary perspective on the technological variability of the ceramic assemblage. Variations in L* values represent differences in surface lightness and may be influenced by raw material composition, iron content, firing atmosphere, firing temperature, and the degree of vitrification. Lower L* values indicate darker ceramic bodies, which may result from higher concentrations of iron-bearing phases, reducing firing conditions, or incomplete oxidation. In contrast, higher L* values are generally associated with lighter-colored bodies and more uniform oxidation during firing. Positive a* values indicate that the samples are positioned toward the red direction of the CIE L*a*b* color space, whereas positive b* values indicate a shift toward yellow. When positive a* and b* values are considered together with relatively low to moderate L* values, they correspond to reddish-brown or yellowish-brown
-
4.5. Integrated Interpretive Summary. The combined evidence from petrography (XPL), geochemical analysis (PED-XRF), and colorimetry (CIE Lab*) reveals that the Niksar Castle assemblage represents organized yet technologically heterogeneous local production. The use of volcanic, sedimentary, and metamorphic raw materials indicates access to diverse geological resources and possibly multiple workshops or production phases. Differences in firing temperature, porosity, and densification reflect varying levels of technological control and production quality. While some groups demonstrate advanced firing efficiency and refined paste preparation, others suggest more limited control or functional specialization. Color variability further supports the interpretation that kiln atmosphere and firing uniformity played important roles in shaping the final appearance and quality of the vessels. Overall, the assemblage reflects a dynamic production system characterized by technological diversity rather than uniform standardized manufacture, consistent with a strategically significant settlement in the Pontus region during the Roman and Medieval periods.
-
5. Conclusion
This research investigated the technological characteristics and raw material provenance of pottery from the 2023 excavations at Niksar Castle by employing a multi-analytical approach including thin-section petrography (XPL), PED-XRF geochemical analysis, and color measurement in the CIE L*a*b* space. The results yield a coherent and reliable picture of pottery production at this site. The petrographic grouping of samples into eight distinct groups (Gr1–Gr8) demonstrated that the pottery exhibits considerable diversity in mineralogical composition, aggregate size and type, and geological provenance of the raw materials. This diversity, along with the consistency of geochemical patterns, suggests the use of multiple local or near-local raw material sources and the existence of more than one production tradition. Consequently, pottery production at Niksar Castle cannot be restricted to a single source or a uniform method. The examination of firing temperature and porosity indices showed that the quality and degree of technological control varied among the groups. Some bodies with more complete firing and lower porosity
firing, higher body densification, greater mechanical stability, and improved control over kiln conditions. Such features may indicate production in workshops capable of achieving higher firing efficiency and quality standards. In contrast, several groups (Gr1, Gr3, Gr8) fall within the 850–900 °C range and show moderate porosity values. This pattern is consistent with typical utilitarian pottery production, where sufficient firing ensures durability without excessive densification. These groups likely represent standard everyday production. Gr2 and Gr5 show firing temperatures around 900–950 °C but differ in porosity and aggregate ratios. This indicates that temperature alone does not determine final body characteristics; clay composition and paste preparation play equally important roles in densification behavior. Gr4 exhibits the highest porosity (P » 15 %) despite moderate firing temperatures (850-900 °C). High porosity may result from insufficient paste compaction, higher aggregate content, or incomplete densification. Functionally, such bodies may resist thermal shock but could be more susceptible to water absorption and mechanical degradation. Gr7, characterized by firing temperatures below 700 °C, reflects either limited kiln performance or a production tradition that did not require higher firing conditions. This group may represent a distinct technological tradition or lower-quality production associated with specific functional demands.
surface tones rather than two separate colors. Such tones are commonly associated with the oxidation of iron-bearing minerals and the formation of hematite under oxidizing firing conditions. In samples where relatively high a* values coincide with elevated Fe2O3 concentrations in the XRF data, the iron content of the ceramic body may have been an important factor controlling surface redness. However, where redness is not directly proportional to Fe 2 O 3 concentration, differences in firing atmosphere, temperature, mineralogical form of iron, and surface alteration may have exerted a stronger influence. The b* values reflect the yellow component of the ceramic color and may be affected by clay composition, iron-bearing mineral phases, carbonate content, and firing conditions. Nevertheless, neither a* nor b* values should be interpreted independently as direct indicators of provenance or firing technology. Instead, the colorimetric results provide a useful supplementary dataset that, when evaluated together with the petrographic, mineralogical, and XRF findings, contributes to the interpretation of surface characteristics and ceramic production technology.
indicate higher skill and better control over the production process, while other groups with lower firing temperatures or higher porosity point to traditions with more limited control or different functional purposes. This situation may reflect production in multiple workshops or temporal and functional changes in the production process. Colorimetry data also showed that the visual differences in the pottery result from the interaction between the body’s chemical composition (especially iron oxides), the kiln’s atmospheric conditions, and firing uniformity. Therefore, color serves as a supplementary index, providing a more detailed understanding of the visual quality and production technology. In summary, the results of this study indicate that the pottery from Niksar Castle is mainly the result of organized but technologically heterogeneous local production shaped within the framework of functional needs and varying production conditions. These findings provide valuable data for reconstructing the pottery production economy and better understanding the technological organization in the settlement–defensive sites of the Pon-tus region during the Roman and Medieval periods, paving the way for broader comparative studies in the future.
