Climatology of swell and wind-sea in the north of Indian ocean by using satellite altimetry data

Author: Fargsham Hossain, Chapron Bertrand
Journal: Общество. Среда. Развитие (Terra Humana) @terra-humana
Section: Природная среда
Article in issue: 4 (37), 2015.
Free access
Short address: https://sciup.org/14031943
IDR: 14031943 | UDC: 551.466.3
Климатология набухания и ветра-моря на севере Индийского океана с использованием спутниковых альтиметрических данных
Анализ зыби и ветровых волн в северной части Индийского океана, включая акватории Аравийского моря и Бенгальского залива, проведен на основе спутниковых альтиметрических измерений в период с 1993 по 2014 гг. Вклад зыби и ветровых волн в полную энергию ветра при разных скоростных режимах анализируется для обоих бассейнов. Для анализа годового и полугодового циклов волнового поля в Аравийском море и Бенгальском заливе применяется вейвлет-преобразование. Показано, что годовые и полугодовые циклы сильнее в Аравийском море по сравнению с Бенгальским заливом. Выявлено аномальное поведение значений высоты волн в обоих бассейнах в период 2004-2005 гг. Вероятно, это обусловлено высокой активностью тропических циклонов в период с 15 ноября 2004 до 30 апреля 2005 г. в юго-западной части Индийского океана.
Text of the article Climatology of swell and wind-sea in the north of Indian ocean by using satellite altimetry data
Farjami H., Chapron B. Climatology of Swell and Wind-Sea in the North of Indian Ocean by Using Satellite Altimetry Data // Общество. Среда. Развитие. – 2015, № 4. – С. 182–189.
Общество. Среда. Развитие ¹ 4’2015
In the oceans, wind and waves have important role in the interaction of ocean and atmosphere dynamic. Wave characteristics and sea surface wind are significantly important and useful in several aspects. This information is playing functional role in ports and coastal designing, the operation of shipping and navigation, military science, fisheries, climate change, and etc. Moreover, in environmental aspect, the winds and waves have important effect on transport of pollution and dispersion in the coastal regions. The height and energy of wave are affected by wind characteristics such as wind speed, wind duration, fetch length and etc. In the oceans, there is correlation between wind and waves. The greater waves are the results of the greater winds [11].
The Indian Ocean is the third largest of the world which in this ocean, oceanic ecosystems and rainfall patterns are controlled by semiannual and annual wind and wave patterns. Monsoon winds reverse their direction semi-annularly over the Indian Ocean, driving one of the Earth’s most dynamic interactions between atmosphere, oceans and continents [12].
In recent decades satellites help us observing oceans and understanding sea surface phenomenon and long term records altimeters data provide an opportunity to understand annual and inter-annual variability in the oceans. It gives us a chance to understand interaction of ocean and atmosphere process in the different basins. A coupled ocean-atmosphere phenomenon in the Indian Ocean has been extensively studied by satellite data [1; 6; 14; 15].
Young and et al., in 2011, studied the global trends in wind speed and wave height by using 23-years satellite altimeter measurements. They established general trends of wind speed and wave height. They showed trends of wind speed and wave height had been increased in the period of study and also, they found rate of increasing extreme events compared to the mean condition. [16].
Eduardo et al., in 2012, presented swell and wind-sea field analysis and an analysis of wave-age in the absence of young-seas condition for mid-latitude and tropical Atlantic for the period 2002–2008 by using satellite data and model results. They showed a dominance of swell over wind-sea regimes during the year [4]. Bhaskaran et al., in 2014, investigated the effect of climate change on variability of maximum significant wave height and wind speeds in the Indian Ocean by using satellite altimeter data from 1992 to 2012. They found because of swell field the activity of wave and wind has been increasing [1]. Different methods have been used for swell and wind-sea patterns in the oceans and basins. Some studies established on wave model [5; 8–10]. Other studies used satellite data by using significant wave height or Synthetic Aperture Radar wavenumber spectra and also wave model [2; 3; 4] or altimetry data [1].
Satellite technology provides ability to study basins in different scales in the passes of satellites. The presence of 22 years satellite altimeters data that cover the global oceans allow us to analyze measured winds and waves data that can improve our understanding on the wind wave climate in the oceans and especially in seas and bays. The aim of this work is to provide a general vision of climate of wind waves and swell in regional basins “Arabian Sea and Bay of Bengal” based on observational satellite altimeter.
Data and Methodology
For the present paper, daily wind and wave data come from L4 level altimetry data including ERS1, ERS2, ENVISAT, TOPEX, POSIDON, JASON1, GFO, JASON2, CRYOSAT, SARAL in the north of Indian Ocean “ftp:// ifremer.fr” and does not perform any data filtering to ensure accuracy data as measured by satellites. The North Indian Ocean bounded to the Arabian Sea (with latitude from 0° to 25° N and longitude from 46° to 75° E) and the Bay of Bengal (with latitude from 0° to 25° N and longitude from 75° to 100° E). These basins have different wind and wave regimes, therefore in the present research we are studying wind waves separately in the each basin.
In this research, at first we investigated general pattern of sea surface wind in the North of Indian Ocean by using datasets EC-MWF during 1979–2014. Analysis of the sea surface wind in the North of Indian Ocean that shows dominated winds in December, January, February, March and April (DJFMA) blow from northeast with wind mean speed (3–7 m/s). It is winter monsoon, and during summer monsoon – it means in June, July, August, September and October – dominated wind blow from southwest with mean wind speed (5–11 m/s). May and sometimes April, November and sometimes September are the transition period [17].
Also mean wind speed in the Arabian Sea is stronger than in the Bay of Bengal during both of monsoons. Because of different wind patterns in these basins, wind waves patterns are different. Therefore in the present study we are looking at swell and wind sea separately from 1993 to 2014 basing on altimeter data in these basins.
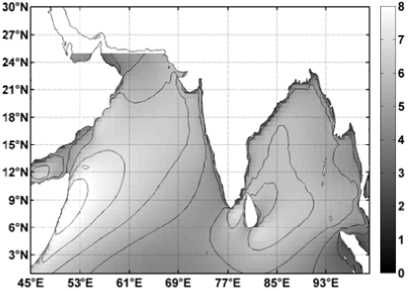
Fig. 1. Mean wind speed from 1979–2014 by using ECMWF data in the North Indian Ocean.
Then, swell and wind sea are analyzed separately in these basins during winter monsoon and summer monsoon by using the theories of Pierson-Moskowitz, in 1964, (eq. 1) and Hasselman et al., in 1988, based on the WAM model (eq. 2) for fully developed sea condition [2; 4].
H P = 0.22 — (1)
g
Where H p is predicted wave, U 10 , in m/s, is wind speed in the 10 m height and g is acceleration of gravity (9,8 m/s2). Based on the WAM model, the predicted H p for fully developed sea condition can be calculated as:
H p = 1.61410 - 2 X U 20 (0 < U 10< 7.5 ms - 1 ) (2)
Hp = 10-2 X U 2 + 8.134*10-4 X xU130(7.5 ms-1 < U10 < 50 ms-1)
“Where, U 10 (m/s) is wind speed in the 10 m height. If N W and N S are, respectively, the number of wind-sea and swell events, the probability of wind-seas, P W , and swell events, P S , can be estimated by P W = N W / N , P S = N S / N , where N = N W + N S . Since, N = N W + N S , P W + P S = 1. The N S and N W are calculated by comparing H P against H S . Points where H S > H P are considered swell and those for H S < H P are taken as wind-sea. We can estimate wind-sea and swell degree through wind and significant wave height. By using H s = 4^0 we can estimate total energy, and to estimate wind wave energy partition can
Среда обитания
use product of a probability of wind-sea, P W ,
H S 2
and predicted wind-sea energy, E S - yy. H S is the significant wave height derived from the fully developed spectrum. The fraction of the swell energy, E S , to total energy, E total , is estimated from S = E S / E 0 , similarly, it is possible
EP - Ew to define a wind-sea given by W -------, EP
EP is predicted energy and EW is energy of windsea. For a purely swell regime, U10 = 0 and HS > 0, and S = 1. For a purely and beginning case of wind sea, H10 > 0 and HS = 0. For a fully developed wind-sea and no swell, for a given U10, HS, S = W = 0” [4, p. 3].
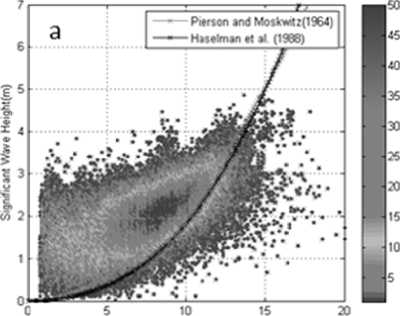
Figure 2 shows scatter diagram of sea surface wind speed and significant wave height based on altimetry dataset during winter and summer monsoons in the Arabian Sea and the Bay of Bengal. Also overlaid are the theoretical relations between wind speed and significant wave height for fully developed seas according to Has-selmann et al. theory (1988) and Pierson and Moskowitz theory (1964). According to these figures dominated significant wave height during summer monsoon is 1–4 m in the Arabian Sea, and it is 1–3 m in the Bay of Bengal. While winter monsoon dominates, significant wave height is 1–3 m in the Arabian Sea and in the Bay of Bengal it is 0,5–2 m. Also these figures show that dominated significant wave height during summer monsoon more near to the fully developed condition in the both of basins.
Also we analyzed time series of mean wind and mean significant wave height by using continuous wavelet transform in both basins. The wavelet transform deforms a one-dimensional time series into two-dimensional timefrequency space [13].
Results and Conclusion
Analysis of wind-sea and swell can be helpful to study interaction of ocean and atmosphere
Общество. Среда. Развитие ¹ 4’2015
Bengal Biy SWM ind WodSpted 2013 JJASO
Wind Sp<*d(m/s)
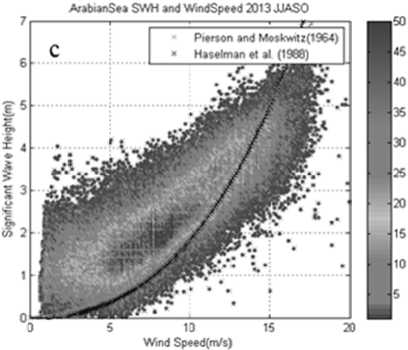
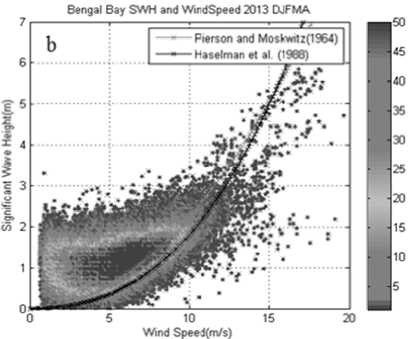
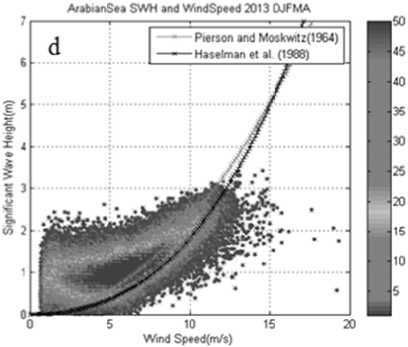
Fig. 2. Scatter diagram of sea surface wind speed and significant wave height during winter monsoon in the Bay of Bengal “a” and in the Arabian Sea “c”; during summer monsoons in the Bay of Bengal “b” and in the Arabian Sea “d”. Overlaid are the theoretical relations between wind speed and significant wave height for fully developed sea according to Hasselmann et al., 1988, theory “dash line”, Pierson and Moskowitz ,1964, theory “bold line”.
processes. This part of paper is focused on time-frequency analysis of dominated significant wave height and dominated wind speed in the Arabian Sea and the Bay of Bengal during 2 decades by using continues wavelet.
Swell and wind-sea probability in the Arabian Sea
The comparative magnitudes of the wind seas and swells during the monsoon seasons are approximately identical during 2013. According the scheme proposed in section 2, Fig.2, at first we estimate the swell and wind sea probability during winter monsoon (DJF-MA) and summer monsoon (JJASO) separately in the Arabian Sea and the Bay of Bengal. As shown in Fig. 3, probability of swell and wind sea in the Arabian Sea during summer and winter are different. In summer percentage of swell is more than in winter, and it is also clear that in summer monsoon when wind speed is less than 13 m/s, dominated waves are swells. It means in the summer monsoon 70% of waves are swell, and in winter monsoon it is 60% of all wind waves in the Arabian Sea.
Wind and wave climatology in the Arabian Sea The evolution of daily mean wind of Arabian Sea is shown in Fig. 4 from 1993 to 2014 by us- ing altimetry data. It shows there are annual and seasonal cycles for mean wind speed and mean significant wave height, and also this time series shows that maximum wind speed is about 10 m/ s, but maximum significant wave height is about 3 m, and it means regular swell is in the Arabian Sea according to Pierson-Moskowitz theory.
Fig. 5a shows the power of the wavelet transform for mean significant wave height in the Arabian Sea. It gives information on the relative power at a certain scale and a certain time. Plot of the phase shows actual oscillations of the individual wavelets, rather than just their magnitude. Fig 5b shows variance of annual summer monsoon and winter mon- soon during two decades. It shows that summer monsoon is stronger than winter monsoon. Analysis of data during 2 decades in the Arabian Sea shows unusual behavior during 2004–2005 maybe, which could be caused by tropical cyclone, that started on 15 November 2004 and finished on 30 April 2005 in the south-west of the Indian Ocean. This cyclone was monitored by the Regional Specialized Meteorological Centre in Rйunion in this basin.
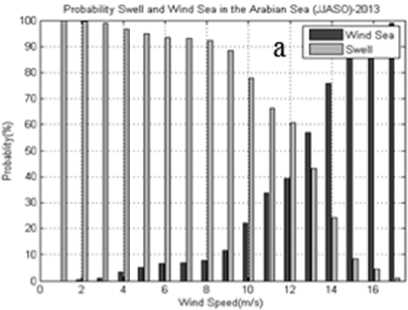
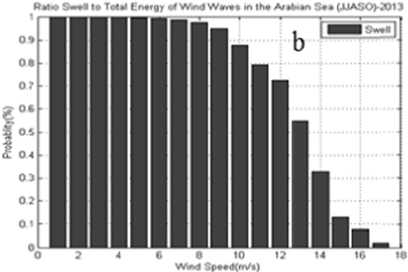
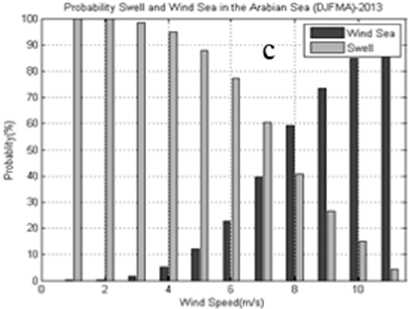
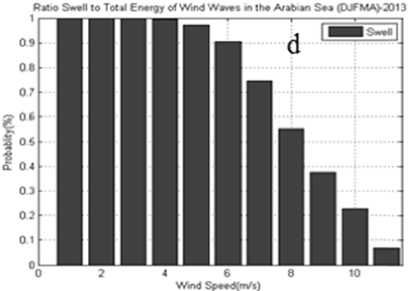
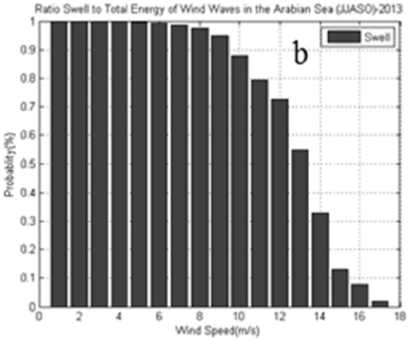
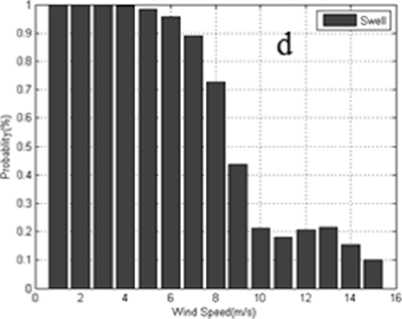
Fig. 3. Probability of swell and wind sea a” and ratio energy of swell to total energy “b” during the summer monsoon (JJASO); Probability of swell and wind sea “c” and ratio energy of swell to total energy “d” during the winter monsoon(DJFMA) in the Arabian sea.
Среда обитания
Общество. Среда. Развитие ¹ 4’2015
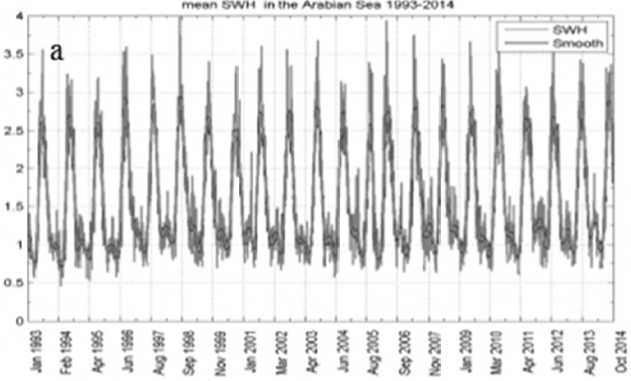
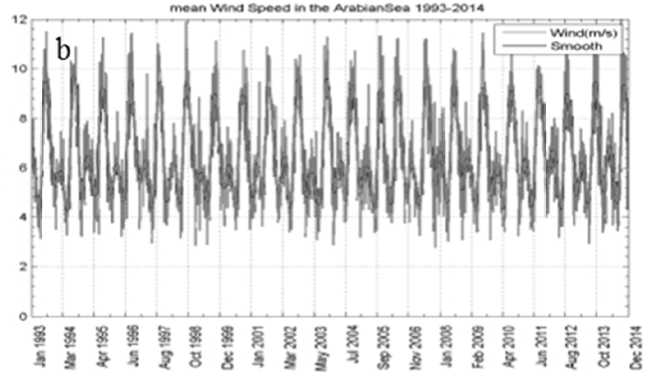
Fig. 4. Time series of mean significant wave height “a” and mean wind speed “b” in the Arabian Sea in the period 1993–2014.
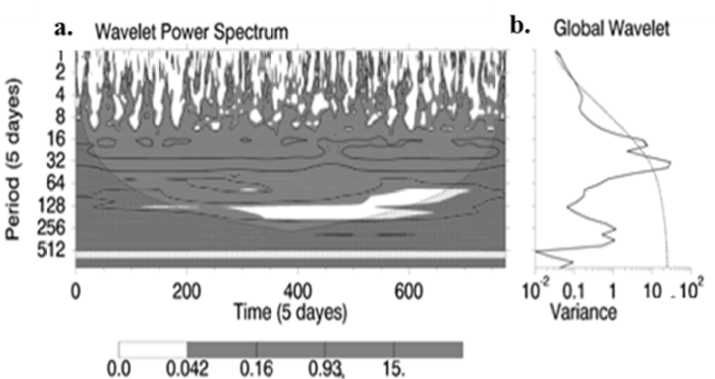
Fig. 5. the wavelet power spectrum “a” and the global wavelet power spectrum “b” (Torrence, C. and G. P. Compo, 1998) in the Arabian Sea.
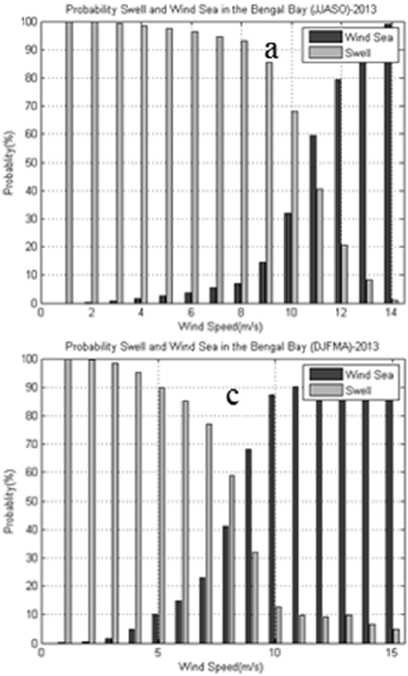
Fig. 6. Probability of swell and wind sea “a” and ratio energy of swell to total energy “b” during the summer monsoon (JJASO); Probability of swell and wind sea ”c” and ratio energy of swell to total energy “d” during the winter monsoon(DJFMA) in the Bay of Bengal.
Rat«S>*
Swell and wind-sea probability in the Bay of Bengal
Similar to Arabian Sea, in the Bay of Bengal we calculated probability of wind-sea and swell in different scales of wind speed. The Fig. 6 shows that in the Bay of Bengal swell is more than windsea, too. But in the Bay of Bengal height of significant wave height and wind speed are less than in the Arabian Sea. The analysis of data shows in the summer monsoon, when wind speed is less than 9 m/s, more waves are swell (Fig. 5). Moreover, during summer monsoon, swell in the Bay of Bengal is less than in the Arabian Sea.
Wind and wave climatology in the Bay of Bengal
Daily analyzing of mean significant wave height and mean wind speed of altimetry data from 1993–2014 in the Bengal Bay, show a strong seasonal signal with primary maximum during Summer monsoon and secondary maximum during winter monsoon. Second peak that occurs during winter monsoon is weaker than first peak. It means the Bay of Bengal is less sensitive to the winter monsoon (fig. 7). Also it shows maximum wind speed is about 9 m/s but maximum significant wave height is about 2 m.
It is important to remind that the daily mean significant wave height over the Arabian Sea is greater than the Bay of Bengal. Annual and semi-annual cycle are happening in the northwest of the Indian Ocean because of strong and sustained southeast trade winds and southwest winds from the Arabian continent. As the magnitude of the wave depends on the availability of fetch and duration, these wind fields over Indian Ocean can be well explained by the position of ITCZ [7].
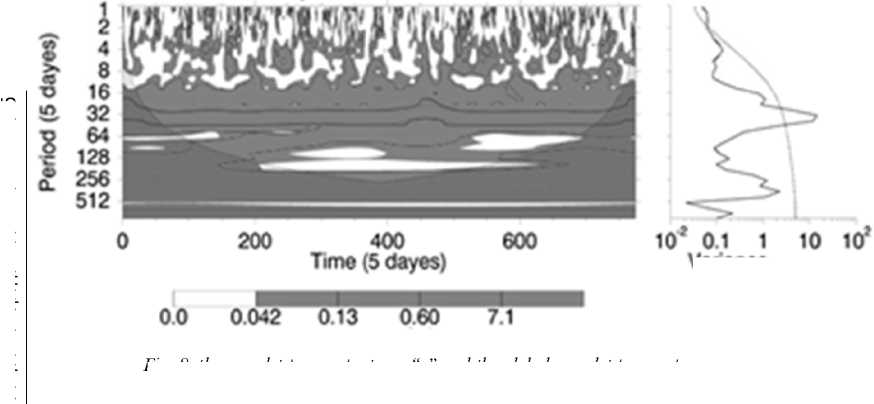
The dominant mode of mean significant wave height is shown in Fig. 8 by wavelet with time scale from 1993–2014 in the Bay of Bengal. It shows summer monsoon is stronger than winter monsoon in the Bay of Bengal and it variance is similar to the Arabian Sea basin. Fig. 8b shows variance of significant wave height in the Bay of Bengal. According to this figure this variance during the summer period is more than the winter period.
Среда обитания
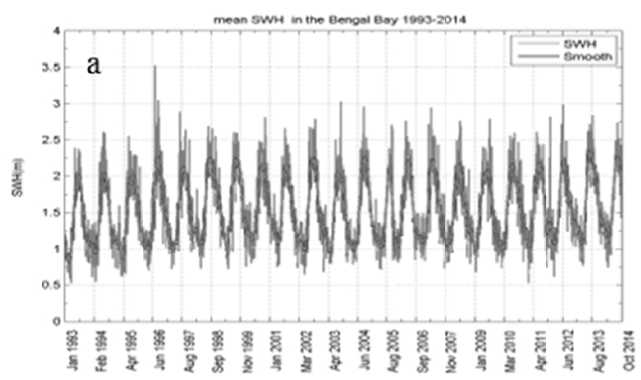
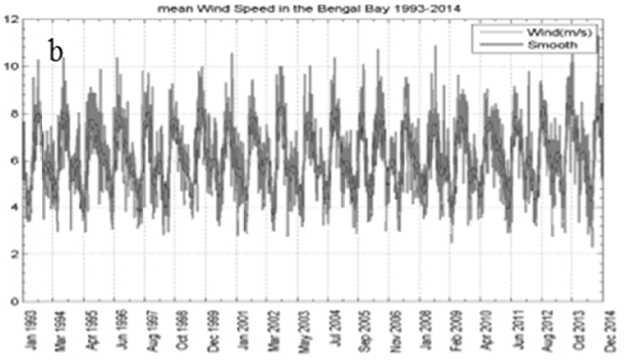
Fig. 7. Time series of mean significant wave height “a” and mean wind speed “b” in the Bay of Bengal in the period 1993–2014.
b. Global Wavelet a. Wavelet Power Spectrum
Общество. Среда. Развитие ¹ 4’2015
variance
Fig. 8. the wavelet power spectrum “a” and the global wavelet power spectrum “b” (Torrence, C. and G. P. Compo, 1998) in the Bay of Bengal.
As mentioned above, during 2004–2005, probably because of tropical cyclone, that started on 15 November 2004 and ended on 30 April 2005 in the south-west of the Indian Ocean, behavior of mean significant wave height is different.
Daily mean significant wave height and mean wind speed of altimeters is used to analyze annual and semiannual wind and wave characteristics in the North Indian Ocean. Because of different wave and wind patterns in the Arabian Sea and the Bay of Bengal the wind and waves are analysed separately in these basins from 1993 to 2014. The swell and wind-sea separation was first done using the theories of Pierson-Moskowitz (1964), and Hasselman et al. (1988), by exclusively satellite altimetry data. The results of this study show the swell dominance during summer and winter monsoons in both basins, but the Arabian Sea has been more affected by swell. Also, we estimated percentage of swell and windsea in different wind scales in the both basins.
Then by using continuous wavelet transform for time series we analyzed mean significant wave height and mean wind speed during 2 decades to observe annual and semi-annual cycle in the Arabian Sea and the Bay of Bengal.
Long time analysis of mean wind speed and mean significant wave height (22 years) in the Bengal Bay shows maximum wind speed is about 9 m/s, but maximum significant wave height is about 2.5 m. In the Arabian Sea maximum wind speed is about 10 m/s, but maximum significant wave height is about 3 m. The wavelet analysis of daily data shows annual and semi-annual cycle in the Arabian Sea. It also confirmed greater variance during summer monsoon. Data analysis shows that Bengal Bay is less sensitive to the winter monsoon. Analysis of mean significant wave height data reveal unusual behavior during 2004–2005, which may be explained by tropical cyclone, that started on 15 November 2004 and ended on 30 April 2005 in the south-west of the Indian Ocean.
References Climatology of swell and wind-sea in the north of Indian ocean by using satellite altimetry data
- Bhaskaran P.K., Gupta N., Dash M.K. Wind-wave Climate Projections for the Indian Ocean from Satellite Observations//Journal of Marine Science Research & Development. -2014, S11:005.
- Chen G., Chapron B., Ezraty R., Vandemark D. A Global View of Swell and Wind Sea Climate in the Ocean by Satellite Altimeter and Scatterometer//Journal of Atmosphere and Oceanic Technology. -2002, № 19. -P. 1849-1859.
- Collard F., Ardhuin F., Chapron B. Monitoring and analysis of ocean swell fields from space: New methods for routine observations//Journal of geophysical research. -2009, vol. 114, C07023. - DOI: 10.1029/2008JC005215
- Farias,de, E.G.G., Lorenzzetti J.A., Chapron B. Swell and Wind-Sea Distributions over the Mid-Latitude and Tropical North Atlantic for the Period 2002-2008//International Journal of Oceanography. -2012, vol. 2012. -Article ID 306723, 8 pages.
- Hanley E., Belcher E., A Global Climatology of Wind-Wave Interaction//Journal of physical oceanography. -2010, vol. 40, P. 1263-1283.
- Kostianoy A. G., Ginzburg A. I., Frankignoulle M., Delille B. Fronts in the Southern Indian Ocean as inferred from satellite sea surface temperature data//Journal of Marine Systems. -2004, № 45. -P. 55-73.
- Maharana P., A. P. Dimri, Study of seasonal climatology and interannual variability over India and its subregions using a regional climate model (RegCM3)//Journal of Earth System. Science., 2014, 123, No. 5, July 2014, pp. 1147-1169.
- Raj K. and et al. Improvement in predictability of waves over the Indian Ocean//Natural Hazards, 2009, 49:275-291, DOI 10.1007/s11069-008-9310-y.
- Semedo and et al. The wind sea and swell waves climate in the Nordic seas//Ocean Dynamics. Vol. 65. -2014, Issue 2. -P. 223-240.
- Semedo A., Suљelj K., Rutgersson A., Sterl A. A Global View on the Wind Sea and Swell Climate and Variability from ERA-40//Journal of Climate. -2011, № 24. -P. 1461-1479. - DOI: 10.1175/2010JCLI3718.1
- Shirkhani H., Seidou O., Mohammadian A., Qiblawey H. Climate Change Impacts on Wind Climatology//The International Conference on New Trends in Transport Phenomena Ottawa, Ontario, Canada, 2014.
- Shukia J., Misra B.M. Relationships Between Sea Surface Temperature and Wind Speed Over the Central Arabian Sea, and Mosnsoon Rainfall Over India//Monthly Weather Review. -1977, vol. 105. -P. 998-1002.
- Torrence Ch., Compo P. A Practical Guide to Wavelet Analysis//Bulletin of the American Meteorological Society. Vol. 79. -1998, № 1.
- Turiel A., Isern-Fontanet J., Garcia-Ladona E., Young J.A. Detection of wave fronts in the Indian Ocean from geostationary sunglint satellite imagery//International Journal of Remote Sensing. Vol. 28. -2007, № 17. -P. 3953-3962.
- Vinayachandran P.N., Kurian J. Modeling indian ocean circulation:bay of bengal fresh plume and arabian sea mini warm pool//Proceedings of the 12th Asian Congress of Fluid Mechanics 18-21 August 2008. -Daejeon, Korea.
- Young I.R., Zieger S., Babanin A.V. Global Trends in Wind Speed and Wave Height//Science 332, 451 (2011). - DOI: 10.1126/science.1197219
- Фарджами, Х., Шапрон Б. Особенности поля ветра в северной части Индийского океана на основе анализа данных NCEP за период 2010-2014//Учёные записки РГГМУ. -2015, № 39. -С. 142-148.
