
Concrete mix optimized with glass powders
Journal: Construction of Unique Buildings and Structures @unistroy
Article in issue: 2 (122), 2026.
Free access
The object of the research is the use of glass powder and ultrafine glass powder as sustainable alternatives to natural sand in M25-grade concrete, addressing the environmental and resource challenges caused by sand depletion in Jordan. Method. The study examines the effects of replacing fine aggregate with glass powder (10% to 20%) on concrete's compressive strength, using the water absorption method. The concrete mixes were designed following ACI 211.1 guidelines, with materials hand-mixed and each component precisely weighed. The mix was placed in cubic molds, compacted, and cured in water for 28 days. A total of 24 specimens were prepared and tested for compressive strength after 28 days using a universal testing machine C040PN. Results. Incorporating 10% glass powder as a cement replacement optimizes the mechanical performance of concrete, achieving a 28-day compressive strength of 61.98 MPa—10.83% of the control mix strength (55.92 MPa). This mix also demonstrates an ultrasonic pulse velocity of 5.51 km/s, a slump of 60 mm, and a modulus of elasticity of 37 GPa. These results confirm that using 10% glass powder enhances or maintains key structural properties while promoting the sustainable reuse of waste glass—offering a viable, eco-friendly solution for the construction industry in Jordan without compromising performance.
Short address: https://sciup.org/143186132
IDS: 143186132 | UDC: 69 | DOI: 10.4123/CUBS.122.2
Бетонная смесь, оптимизированная с использованием стеклянного порошка
Целью исследования является использование стеклянного порошка и ультрадисперсного стеклянного порошка в качестве устойчивой альтернативы природному песку в бетоне марки М25, что позволяет решить экологические и ресурсные проблемы, вызванные истощением запасов песка в Иордании. Метод. В исследовании изучается влияние замены мелкого заполнителя стеклянным порошком (от 10% до 20%) на прочность бетона на сжатие с использованием метода водопоглощения. Бетонные смеси были разработаны в соответствии с рекомендациями ACI 211.1, материалы смешивались вручную, и каждый компонент точно взвешивался. Смесь помещали в кубические формы, уплотняли и выдерживали в воде в течение 28 дней. Всего было подготовлено 24 образца, которые были испытаны на прочность при сжатии через 28 дней с использованием универсальной испытательной машины C040PN. Результаты. Добавление 10% стеклянного порошка в качестве заменителя цемента оптимизирует механические характеристики бетона, достигая прочности при сжатии через 28 дней 61,98 МПа — 10,83% от прочности контрольной смеси (55,92 МПа). Эта смесь также демонстрирует скорость распространения ультразвукового импульса 5,51 км/с, осадку конуса 60 мм и модуль упругости 37 ГПа. Эти результаты подтверждают, что использование 10% стеклянного порошка улучшает или поддерживает ключевые структурные свойства, одновременно способствуя устойчивому повторному использованию отходов стекла — предлагая жизнеспособное, экологически чистое решение для строительной отрасли Иордании без ущерба для эксплуатационных характеристик.
Text of the scientific article Concrete mix optimized with glass powders
Concrete is a composite material consisting of cement, fine aggregate, coarse aggregate, and water [1], sometimes additives [2]. Most construction structures depend on concrete rather than bricks [3] or earth bricks [4], not because of its cost but because of its workability, strength, and durability. However, the common use of natural sand as a fine aggregate is reducing global sand reserves to a critical point [5]. This over-extraction is triggering serious environmental consequences, such as the destruction of aquatic resources. Considering these mounting challenges, identifying sustainable obeid, m.a.a.; abu-mahadi, m.i.; markovich, a.s.; qais, a.a.q.; nasrat, n.a.g.; pirot, o.m.; abebe, t.a.; jazzan, m.; kveng., P.
substitutes for natural sand has become critically important. The same urgency applies to coarse aggregate, which also demands more eco-friendly alternatives.
Glass is one of the world’s most versatile materials, valued for its excellent chemical stability, optical clarity, high strength, and low permeability [6]. As industrialization advances and living standards rise, global glass production—and consequently, waste glass generation—has surged. In 2017 alone, Chinese cities generated approximately 20.255 million tons of waste glass. Globally, the average recovery rate for waste glass stands at around 50%, but in China, it remains as low as 20%. This means that roughly 80% of waste glass is not properly managed and often ends up in landfills or is discarded indiscriminately [7]. Due to its inherent chemical stability, waste glass does not readily decompose in landfills, leading to long-term occupation of valuable land resources. Compounding the problem, waste glass is frequently contaminated with metals, plastics, adhesives, labels, and other materials. When left exposed to the environment over time, these complex mixtures can leach harmful substances, posing serious risks of pollution to water, soil, and air [8].
Growing awareness of environmental protection has spurred increased interest in incorporating solid wastes and industrial by-products as constituents in concrete. Beyond conserving raw materials and energy, the reuse of certain waste materials can enhance concrete performance in specific aspects. For instance, using waste glass as a fine aggregate has been shown to improve the concrete’s resistance to chloride ion penetration, thereby increasing its durability—particularly in aggressive environments such as marine or de-icing salt-exposed conditions [9].
This study experimentally investigated the pozzolanic reactivity of waste glass powder used as a cement replacement at levels of 0%, 15%, 30%, 45%, and 60% by weight of cement. The results demonstrated that concrete compressive strength at 28 days remained uncompromised up to a 30% replacement level, attributable to the pozzolanic reaction between the glass powder and calcium hydroxide produced during cement hydration. Moreover, durability significantly improved with higher glass powder content: resistance to chloride ion and water penetration increased progressively, even up to 60% cement substitution. At this level, electrical resistivity rose by 95%, and water penetration depth decreased by 80%, while compressive strength remained at 85% of the control mix. These enhancements are attributed to a refined microstructure, especially in the interfacial transition zone, as confirmed by pore size distribution analysis showing a reduction in capillary pores that hinder the ingress of water and chlorides. Notably, incorporating just 15% glass powder was sufficient to produce high-performance concrete—delivering both improved strength and superior impermeability—demonstrating that glass powder acts not merely as an inert filler but as an active pozzolanic material [10].
This study examined the effect of waste glass powder (WGP) as a partial cement replacement on the flexural performance of reinforced concrete beams (R-C-Bs). Nine beam specimens were cast with WGP replacing cement at 0%, 10%, 20%, and 30% by weight, and the influence of stirrup spacing on behavior was also assessed. Results showed that 10% WGP replacement yielded optimal performance; higher percentages—especially beyond 10%—led to a noticeable reduction in beam capacity, particularly in beams with high longitudinal reinforcement ratios [11].
This study addresses environmental and economic challenges in the concrete industry by using waste glass powder (GP) as a partial replacement for natural fine aggregate in M20 concrete. Natural sand is replaced by GP at 0%, 5%, 10%, 15%, 20%, and 40% by weight, and compressive strength is evaluated at 4, 7, and 28 days, then compared with a control mix containing only natural sand. Waste glass is sourced from discarded glass sheets and shop cuttings that would otherwise go to landfill, improving resource efficiency and reducing waste-disposal impacts. The results from similar works indicate that GP can effectively replace fine aggregate up to about 15–20% with equal or higher compressive strength than conventional concrete, while higher replacement levels generally reduce strength [12].
This research analyzes the potential of using glass powder and ultrafine glass powder as sustainable partial replacements for fine aggregate in 25 MPa concrete, responding to increasing construction material demands and growing environmental concerns. Limited natural sand resources and the accumulation of glass waste in Jordan highlight the need for alternative fine aggregates that are both technically viable and environmentally responsible. Although various studies have explored waste glass in concrete, there is a lack of research on combining glass powder with locally available quartz sand and quartz stone in structural-grade concrete intended for Jordanian conditions, especially at the strength level of 25 MPa. This scientific gap—insufficient data on the performance of 25 MPa concrete o beid , m.a.a.; a bu -m ahadi , m.i.; m arkovich , a.s.; q ais , a.a.q.; n asrat , n.a.g.; p irot , o.m.; a bebe , t.a. ; j azzan , m.; k veng ., P.
incorporating glass powder with quartz-based aggregates under realistic mix designs relevant to Jordan—motivates the present study.
The research object is the use of glass powder and ultrafine glass powder as sustainable partial replacements for fine aggregate in 25 MPa concrete containing quartz sand and quartz stone. The goal of the study is to evaluate the mechanical and durability performance of such concrete mixes and to assess their suitability as an environmentally friendly alternative to conventional sand-based concrete for Jordan. The main objectives are threefold. First, to design and produce 25 MPa concrete mixes using different amounts of glass powder and ultrafine glass powder as partial replacements for fine aggregate. Second, to examine how these replacements affect workability and compressive strength. Third, to assess how these mixes could help reduce waste and support the sustainable use of locally available quartz-based materials in Jordan’s construction and industrial sectors.
-
2 Materials and Methods
Preparations
Materials & Tools
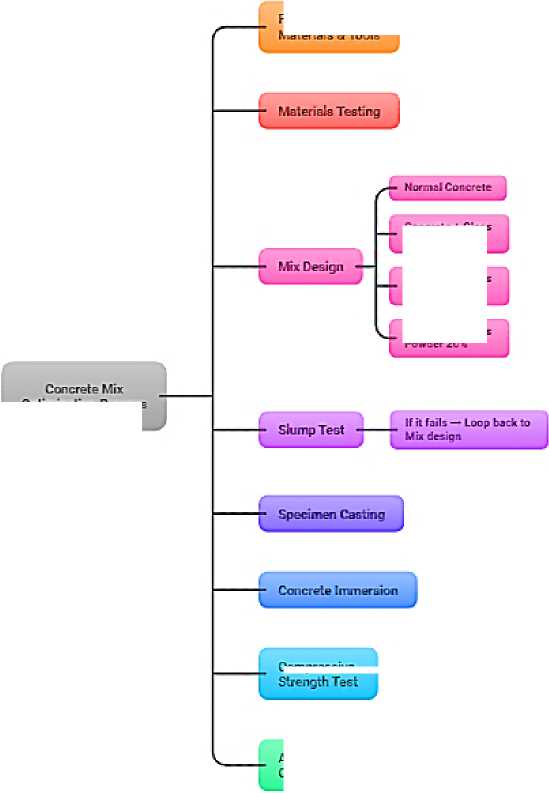
Optimization Process
Analysis and Conclusion
Concrete + Glass Powder 10%
Concrete + Glass Powder 15%
Concrete * Glass Powder 20%
Compressive
Flowchart. 1- Study method
The experimental procedure involved uniformly blending cement, sand, coarse aggregates, Ultrafine & glass powder, and superplasticizer with a controlled water-cement ratio of 0.38. The fresh concrete was systematically placed into steel molds—pre-treated as shown in Figure 1 with a releasing agent—in three layers, each compacted 25 times to ensure proper consolidation. After demolding at 24 hours, specimens were water-cured for 28 days. A total of 24 specimens were prepared and tested for compressive strength at 28 days using a universal testing machine, as shown in Figure 2 . Post-curing, compressive strength, water absorption, and Ultrasonic Pulse velocity (UPV), as shown in Figure 3, tests were conducted to evaluate mechanical and physical performance. This standardized methodology ensured reliable comparison of strength characteristics across glass powder replacement levels.
o beid , m.a.a.; a bu -m ahadi , m.i.; m arkovich , a.s.; q ais , a.a.q.; n asrat , n.a.g.; p irot , o.m.; a bebe , t.a. ; j azzan , m.; k veng ., P.
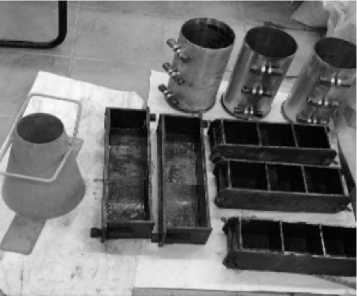
Fig. 1 –Molds with treatment
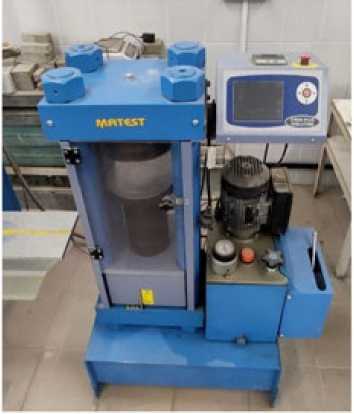
Fig. 2 – Testing machine C040PN

Fig. 3 – Ultrasonic device PULSAR-2.1 [13]
Table 1. Technical specifications of Ultrasonic device PULSAR-2.1 [13]
|
Limits of permissible supplementary absolute error under deviation of operation temperature (for each 10 °C), as a fraction of general error |
0.5 |
— |
|
Optimized energizing pulse |
450/600 |
V |
|
Bandwidth |
60 ±10/20.200 |
kHz |
|
Memory capacity |
up to 4 |
GB |
|
Display resolution |
320 x 240 |
pixels |
|
Electronic unit dimensions (max) |
205 x 115x35 |
mm |
|
Weight of electronic unit/pulse-echo transducer |
0.44/0.58 |
kg |
Materials. The materials used in this experimental study were carefully selected to ensure consistency and reliability in the results. The key components include :
Cement. Ordinary Portland Cement (OPC) M500 (Russia) was used as the primary binding material, as shown in Figure 4 . Cement provides the necessary adhesive properties to bind all the constituents of concrete together.
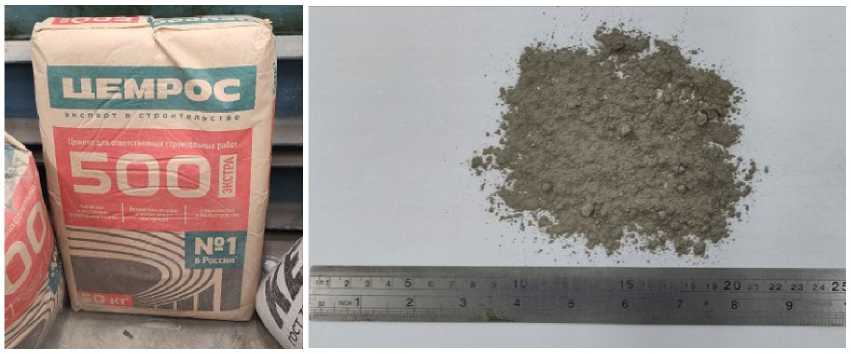
Fig. 4 – Ordinary Portland Cement (OPC) M500
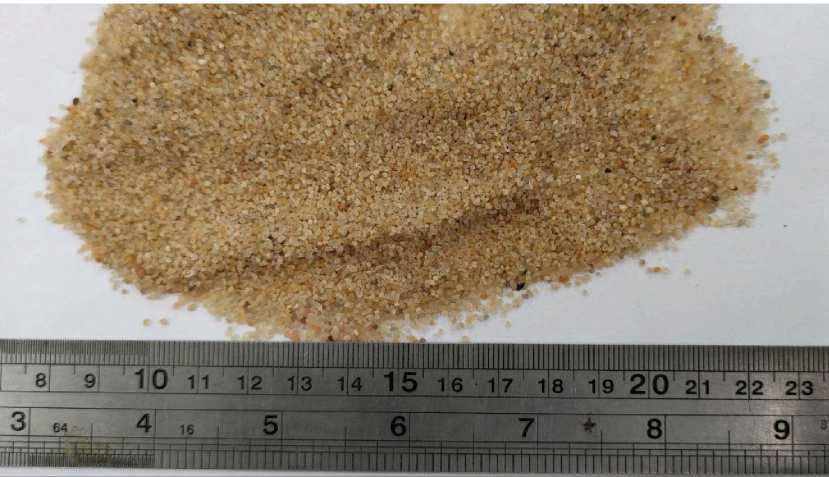
Fine Aggregates. Fractionated quartz sand passing through a 4.75 mm sieve was used as fine aggregate, as shown in Figure 5 . The peculiarity of the offered quartz is the presence of coarse-grained sands, with a large fineness modulus up to M 3.5 [13]. Quartz sand has a rounded shape of the part with a low content of clay inclusions and inclusions of soft rocks. The resulting quartz sand undergoes additional enrichment and drying. The moisture content is up to 0.2% Table 2 .
o beid , m.a.a.; a bu -m ahadi , m.i.; m arkovich , a.s.; q ais , a.a.q.; n asrat , n.a.g.; p irot , o.m.; a bebe , t.a. ; j azzan , m.; k veng ., P.
Fig. 5 – Fractionated quartz sand
Table 2.Comparing the Chemical Properties of Quartz Sand
|
Major oxides |
In Jordan (Ras En Naqb) Ministry of Energy and Mineral Resources [14] |
In Russia (Crystal Mountain-гора хрустальная) [15] |
|
SiO 2 |
98.7 |
98.9 |
|
Al 2 O 3 |
0.52 |
0.62 |
|
Fe 2 O 3 |
0.04 |
0.07 |
|
Na 2 O+K 2 O |
0.11 |
0.105 |
Coarse Aggregates. Crushed stone aggregates (vein quartz) with a maximum nominal size of 20 mm were used as shown in Figure 6 . Crushed vein quartz is sharp-edged, rough-surfaced, and has flat edges with an uneven, unlike rounded river or quarry sands. Its grains are chemically clean, have a minimal clay content, and are completely free of organic inclusions.
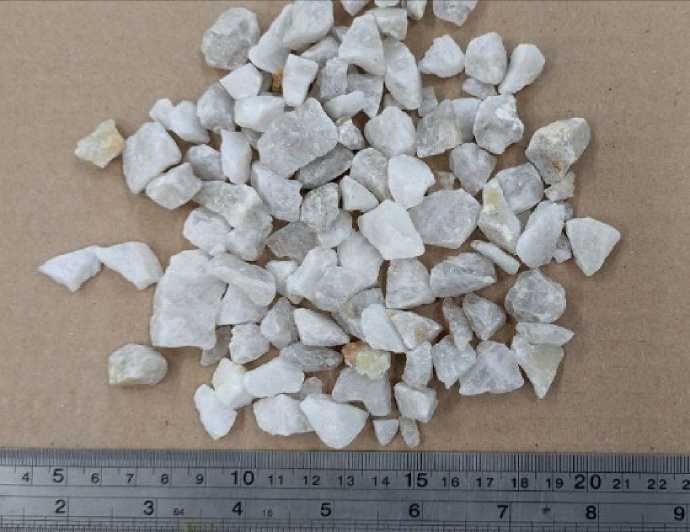
Fig. 6 – Crushed stone aggregates (vein quartz)
Micro glass beads are tiny spherical glass particles with a diameter of 106–600 µm and 0-50 µm, as shown in Figure 7 .
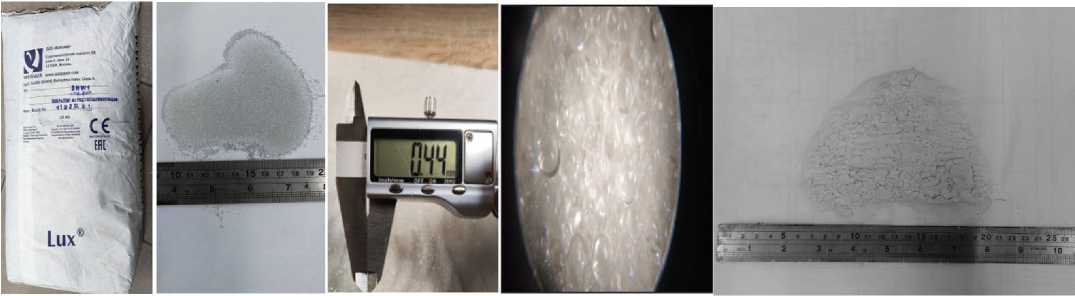
Fig. 7– Micro glass beads
Water. Potable water, free of harmful chemicals and impurities, was used for mixing and curing concrete samples. The water-cement ratio (W/C = 0.38) was maintained in accordance with the mix design requirements to achieve the required workability and strength according to ASTM C187 [16].
o beid , m.a.a.; a bu -m ahadi , m.i.; m arkovich , a.s.; q ais , a.a.q.; n asrat , n.a.g.; p irot , o.m.; a bebe , t.a. ; j azzan , m.; k veng ., P.
The materials used in this experimental study were selected with exceptional care, meticulousness, and careful consideration of all possible factors that could affect the reliability, reproducibility, and scientific validity of the data obtained. Each component, substance, and instrument underwent a multistage evaluation to ensure compliance with strict criteria for quality, purity, stability, and compatibility with experimental conditions. This meticulous and deliberate approach to material selection was driven by a desire to minimize the influence of extraneous variables, eliminate potential sources of systematic and random error, and ensure maximum internal and external validity of the entire research process. This thoughtful and responsible selection resulted in the creation of a reliable experimental framework that not only yielded robust and consistent results but also laid a solid foundation for subsequent interpretations, conclusions, and potential practical applications of the data obtained.
2.1 ACI (American Concrete Institute [17]) Concrete Mix Design Method (All steps for calculating the mix design of concrete)
The volume of fresh concrete is equal to the sum of the absolute volumes of its components, including naturally entrapped or intentionally introduced air.
Vcon = Vfa+ Va +Vw + Vc +Vca (1)
Where:
V con = Volume of fresh concrete.
V a = Air volume.
V w = Volume of water.
-
V c = Absolute volume of cement.
V fa = Absolute volume of fine aggregate.
V ca = Absolute volume of coarse aggregate.
Step 1: Determining the required compressive strength (f'c)
Set the design compressive strength of concrete (usually after 28 days) to 25 MPa.
Consider tolerances and manufacturing variability to set the required average strength (f'cr) using ACI 211.1 formulas as in Table 3 .
Table 3. Required average compressive strength when data are not available to establish a standard deviation (ACI 211.1) [17]
|
Specified compressive strength, f c , MPa |
Required average compressive strength, f cr , MPa |
|
Less than 21 |
f c + 7.0 |
|
21 to 35 |
f c +8.5 |
|
Over 35 |
1.1 f c +5.0 |
Set the design compressive strength of concrete to 25 MPa. Then the required average strength (f'cr) = 25 + 8.5 = 33.5 MPa.
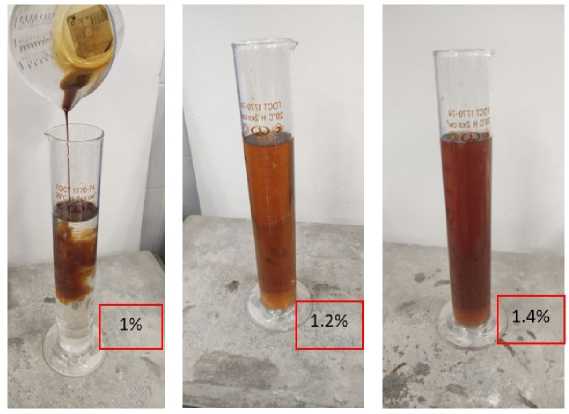
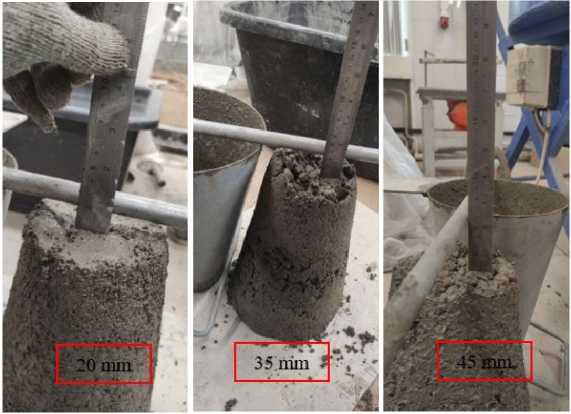
Step 2: Selecting recommended settlement values as shown in Figures 8 & 9 for different types of structures. Selection of cone settlement depending on the type of structure from Table 4 , 45 mm.
o beid , m.a.a.; a bu -m ahadi , m.i.; m arkovich , a.s.; q ais , a.a.q.; n asrat , n.a.g.; p irot , o.m.; a bebe , t.a. ; j azzan , m.; k veng ., P.
Fig. 9 – Determination of concrete mix (control) mobility (slump)
Table 4 . Recommended settlement values for different types of structures (ACI 211.1)[17]
|
Types of construction |
Slump (mm) |
|||
|
maximum |
minimum |
|||
|
Reinforced foundation and footings |
75 |
25 |
||
|
Plain footings, caissons, and substructure walls |
75 |
25 |
||
|
Beams and reinforced walls |
100 |
25 |
||
|
Building columns |
100 |
25 |
||
|
Pavements and slabs |
75 |
25 |
||
|
Mass concrete |
75 |
25 |
||
|
Step 3: Determine the amount of water and air The slump of the cone is 45 mm , and the maximum size of the coarse aggregate is 20 mm Table 5 , it can be found that Vw = 190 kg/m3 and Va = 2%. |
. From |
|||
Table 5. Approximate requirements for water and air content in the mixture for different cone slump and nominal maximum aggregate size (ACI 211.1)[17]
|
Slump (mm) |
Water, kg/m3 of concrete for the indicated nominal maximum size of aggregate |
|||||||
|
9.5 |
12.5 \ |
19 \ |
25 |
37.5 |
50 \ |
75 \ |
150 |
|
|
Non-air-entrained concrete |
||||||||
|
25 to 50 |
207 |
199 |
190 |
179 |
166 |
154 |
130 |
113 |
|
75 to 100 |
228 |
216 |
205 |
193 |
181 |
169 |
145 |
124 |
|
150 to 175 |
243 |
228 |
216 |
202 |
190 |
178 |
160 |
- |
|
Approximate amount of entrapped air, % |
3 |
2.5 |
2 |
1.5 |
1 |
0.5 |
0.3 |
0.2 |
|
Air-entrained concrete |
||||||||
|
25 to 50 |
181 |
175 |
168 |
160 |
150 |
142 |
122 |
107 |
|
75 to 100 |
202 |
193 |
184 |
175 |
165 |
157 |
133 |
119 |
|
150 to 175 |
216 |
205 |
197 |
184 |
174 |
166 |
154 |
- |
|
Recommended average total air content, % for level of exposure: |
||||||||
|
Mild exposure |
4.5 |
4.0 |
3.5 |
2.5 |
2.0 |
2.0 |
1.5 |
1.0 |
|
Moderate exposure |
6.0 |
5.5 |
5.0 |
4.5 |
4.0 |
4.0 |
3.5 |
3.0 |
|
Extreme exposure |
7.5 |
7.0 |
6.0 |
3.0 |
5.5 |
5.5 |
4.5 |
4.0 |
Fig. 8 – Selecting the optimal percentage of superplasticizer
Step 4 : Determining the Water-Cement Ratio (W/C).
o beid , m.a.a.; a bu -m ahadi , m.i.; m arkovich , a.s.; q ais , a.a.q.; n asrat , n.a.g.; p irot , o.m.; a bebe , t.a. ; j azzan , m.; k veng ., P.
The maximum W/C ratio is determined using ACI 211.1 tables based on:
-
• Required strength.
-
• Service conditions (interior, exterior, frost resistance, sulfate resistance, etc.)
-
• For high-strength concrete, a lower W/C ratio can be used.
To determine the water-cement ratio, interpolation must be performed as shown in Table 6 .
The water-cement ratio was determined to be approximately 0.49.
Table 6. Relationship between water-cement ratio and concrete compressive strength (ACI 211.1)[17]
|
Compressive strength, at 28 days, MPa |
Water-cement ratio, by mass |
|
|
Non-air-entrained concrete |
Air-entrained concrete |
|
|
40 |
0.42 |
- |
|
35 |
0.47 |
0.39 |
|
30 |
0.54 |
0.45 |
|
25 |
0.61 |
0.52 |
|
20 |
0.69 |
0.60 |
|
15 |
0.79 |
0.70 |
Cement consumption, Vc, is now determined. Given a W/C ratio of approximately 0.49 and a water consumption of Vw=190 kg/m3 , the following relationship holds:
Vw = 0.49 .
Vc
Therefore, the cement consumption will be:
Vc = »390 kg / m3 .
0.49
Superplasticizer consumption:
0.014 * 390 = 5.46kg/m3 .
Water consumption after adding superplasticizer:
0.78*190 » 149 kg/m3 .
Accordingly, the adjusted water-cement ratio will be:
W
C
» 0.38 .
Step 5: Selecting the ratio of fine to coarse aggregates.
The volume of coarse aggregate relative to the total volume of aggregates is determined ( Table 7 ).
Depends on:
-
• Sand fineness modulus - 2.8 mm
-
• Maximum aggregate size - 20 mm
-
• Bulk density - 1.45 t/m³
To determine V ca , interpolation is performed using Table 7 . This yields V ca = 0.63 * 1.45 * 1000 ≈ 914 kg/m³. To find V con and V fa, interpolation is also required using Table 8.
37.5
0.75
0.73
0.71
0.69
50
0.78
0.76
0.74
0.72
75
0.82
0.80
0.78
0.76
150
0.87
0.85
0.83
0.81
Vfa = Vcon - Va - Vw - Vc - Vca . (7)
V fa
= 2350-0.02-149-390-914 » 897kg/m3 .
Table 7. Volume of coarse aggregate per unit volume of concrete (ACI 211.1) [17]
Table 8. First estimate of fresh concrete mass (ACI 211.1) [17]
|
Max, size of aggregate (mm) |
First estimate concrete wt. kg/m 3 |
|
9.5 |
2380 |
|
12.5 |
2310 |
|
19 |
2345 |
|
25 |
2380 |
|
37.5 |
2410 |
|
50 |
2445 |
|
75 |
2490 |
|
150 |
2530 |
Table 9 . Volumes of proportions in concrete mix design
|
V con = Volume of fresh concrete. |
2350 kg/m 3 |
|
V a = Air volume. |
2% |
|
V w = Volume of water. |
149 kg/m 3 |
|
V c = Absolute volume of cement. |
390 kg/m 3 |
|
V fa = Absolute volume of fine aggregate. |
897 kg/m 3 |
|
V ca = Absolute volume of coarse aggregate. |
914 kg/m 3 |
|
W/C |
0.38 |
|
Superplasticizer |
1.4% |
As demonstrated in Figure 10 , the increase in slump (workability) with higher glass powder content in concrete is mainly due to the smooth, non-porous, and often spherical nature of glass particles. This reduces internal friction and water absorption, while improving particle packing. With the mix water kept constant, these effects leave more free water available to lubricate the mixture, enhancing flowability and resulting in a higher slump.
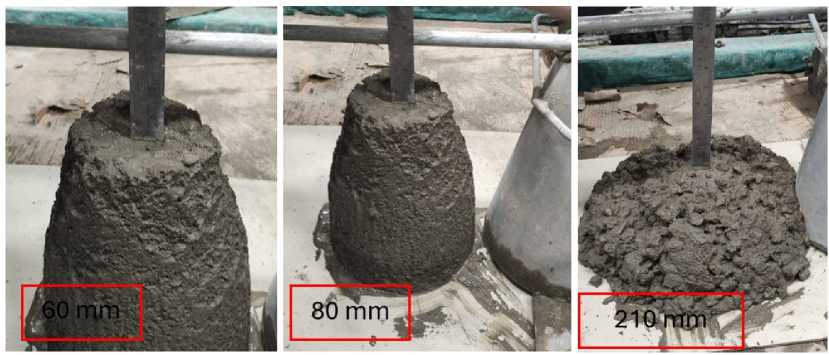
Fig. 10 – Determination of concrete mix (with glass powder) mobility (slump)
Table 10.Proportional volumes in concrete mix design, representing absolute volumes of each ingredient
|
Coarse aggregate |
914 |
Coarse aggregate |
914 |
Coarse aggregate |
914 |
Coarse aggregate |
914 |
|
Water |
149 |
Glass powder 0.106-0.6mm 10% (25%+75%) |
67.275 |
Glass powder 0.106-0.6mm 15% (25%+75%) |
100,91 |
Glass powder 0.106-0.6mm 20% (25%+75%) |
134.55 |
|
Superplasticizer 1.4% |
5.46 |
Ultra-fine glass powder 0.00.05 mm |
22,42 |
Ultra-fine glass powder 0.0-0.05 mm |
33,67 |
Ultra-fine glass powder 0.00.05 mm |
44.85 |
|
Water |
149 |
Water |
149 |
Water |
149 |
||
|
Superplasticizer 1.4% |
5.46 |
Superplasticizer 1.4% |
5,46 |
Superplasticizer 1.4% |
5.46 |
||
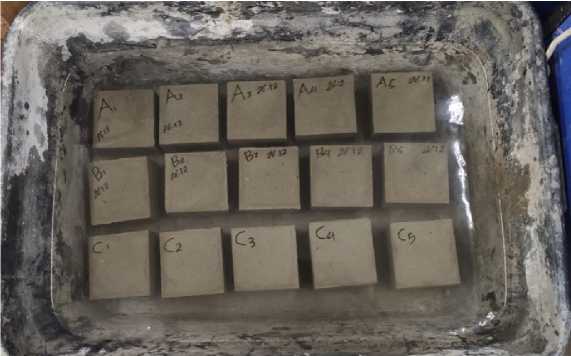
Fig. 11 – Specimens of concrete water-cured for 28 days
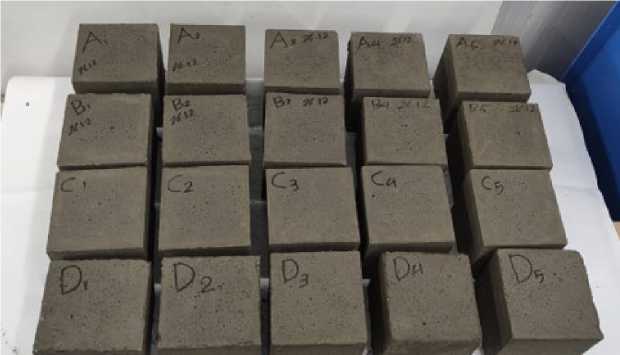
Fig. 12 – Specimens of concrete obeid, m.a.a.; abu-mahadi, m.i.; markovich, a.s.; qais, a.a.q.; nasrat, n.a.g.; pirot, o.m.; abebe, t.a.; jazzan, m.; kveng., P.
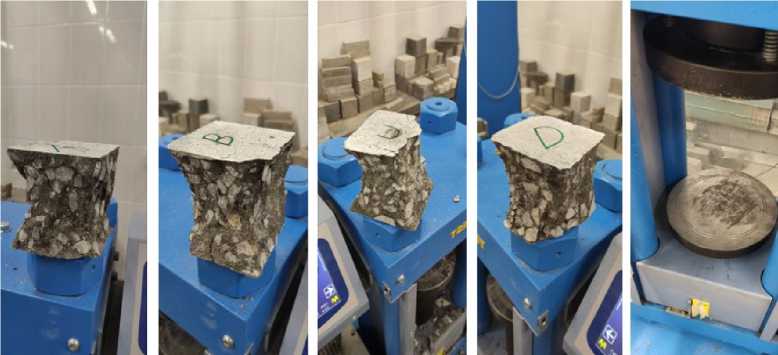
Fig. 13 – Concrete specimens after testing on the C040PN machine
2.2 Higher-Order Elements in Finite Element Analysis
Higher-order elements are finite elements that use polynomial shape functions of degree two or higher (quadratic, cubic, etc.) to approximate the solution within each element. This differs from linear (first-order) elements, which rely on straight-sided geometry and linear interpolation [18] . The stiffness matrix for higher-order elements follows the standard FEM procedure but employs higher-degree shape functions derived from midside nodes on linear elements, while strains are obtained from displacement derivatives via the strain-displacement matrix [ B ].
-
ϵ x ,ϵ y : Normal strains in x and y directions.
γ xy : Engineering shear strain (γ xy = 2ϵ xy )
[ B ]: Strain-displacement matrix (key to FEM).
{ d }: Nodal displacement vector ({ d }={ u,v } T for 2D).
In higher-order elements (e.g., quadratic, cubic), the geometry and displacement field are interpolated using the same shape functions over a natural coordinate system (ξ, η). This requires transforming derivatives from the element's natural coordinates (ξ, η) to global coordinates (x, y). The transformation uses the Jacobian matrix[19] [J]:
d x К d x I n
s y d t S y d n
where:
where:
д 9 1 д у д 9 д у д 9 l x = [ J ] ( д п д , - & д п д 9 1 д x д 9 д x д 9
=( - )
д у [ J ] д , д п д п д ,
д x д у д x д у
[ J ] ~det< [ I ] ^^g—TN . д , д п д п д ,
This equation represents the strain-displacement relationship in natural coordinates for isoparametric higher-order finite elements. It is the mathematical foundation for accurately computing strains in elements with curved boundaries (e.g., quadratic, cubic elements). Let's dissect its significance and why it's critical for higher-order formulations:
|
0x 0у |
1 = [ I ] |
д у д 9 д п д , |
д у д 9 |
0 д x д 9 д п д , |
{ v } , (15) |
|
|
д , д п 0 |
д x д 9 д , д п |
|||||
|
I YxУ |
д x д 9 |
д x д 9 |
д у д 9 |
д у д 9 |
||
|
_д , д п |
д п д , |
д п д , |
д , д п _ |
|||
{ 0 } - [ D '][ N ] { d } . (16)
Formulate element matrix [ B ] to evaluate [ k ] such that [ B ] =[ D' ] [ N ]
[ B11,11) ] = 11Ц Ч ^ ^ B2 ^....... D ^ ^,
where submatrices [ B ] with index i = 1 to n, the number of nodes in the element is.
[ B ] = и
ду д (Ni) ду д (Ni) дп д, д, дп дx д(Ni) дx д(Ni)
д , д п д п д ,
S x д (N i ) S x д (N i ) i u д , д п д п д , [ v д у д (N i ) ду д (N i ) д п д , д , д п
Stiffness matrix of an element with constant thickness h:
[K] - JJ [B]T [D][B]hdxdy , A express the stiffness matrix in terms of ξ and η by a general type of transformation:
JJ f ( Х,У ) hdxdy = JJ f ( ^4 ) Jj\hdddr i.
AA
After applying the transformation equation, [k] can be written as:
[ K ] = f - 1 J ^BT [D][B]h\j\dNn
Shape functions, also known as interpolation functions or basis functions, constitute a fundamental mathematical construct in computational mechanics and numerical analysis—particularly within the finite element method (FEM) [20], finite volume method, and other mesh-based discretization techniques. These functions serve as the essential bridge between discrete nodal data and continuous field representations, enabling the approximation of unknown solution variables (such as displacement, temperature, pressure, or velocity) at arbitrary points within a computational domain based solely on their known or computed values at discrete nodal locations distributed throughout the mesh (8-noded Quadratic square element).
o beid , m.a.a.; a bu -m ahadi , m.i.; m arkovich , a.s.; q ais , a.a.q.; n asrat , n.a.g.; p irot , o.m.; a bebe , t.a. ; j azzan , m.; k veng ., P.
Shape functions derived from incomplete cubic polynomial bases represent a sophisticated and computationally efficient class of interpolation functions widely employed in finite element analysis—most notably in serendipity elements such as the eight-node quadrilateral (Q8) and twenty-node hexahedral elements [21], [22]. Unlike their Lagrangian counterparts that employ complete polynomial expansions up to a specified order, these shape functions strategically omit certain higher-order polynomial terms that do not contribute meaningfully to boundary representation or solution accuracy, thereby reducing the number of required nodal degrees of freedom while preserving essential completeness properties. When formulated within the framework of global Cartesian coordinates (x,y)—as opposed to the more common natural or parent coordinate systems (ξ,η)—these shape functions demand careful consideration of geometric mapping, Jacobian transformations, and the preservation of interpolation properties across arbitrarily shaped physical elements embedded in the global computational domain.
222 2
222 2
Shape functions:
N1-1 ( 1- & )( 1-n )( -t-v1 )
N2-1 ( + & & )( 1-4 )( i-Ч-1 )
N3=1 ( +& & )( 1 + n )( i + 4-1 ) N4 =1 ( 1- & ( 11 + П )( 4 + Ч-1 )
N5-2 ( 1-& ) ( 1-n )
N6 =2 (1+1 ) ( 2 )
N7-2 ( 1-& ) ( 1 + n )
N8-2 ( 1 — i ) ( 1 + n2 )
2.3 The Critical Role of Particle Size in Governing Pozzolanic Activity versus ASR Expansion.
Glass powder in concrete undergoes pozzolanic reactions with calcium hydroxide (portlandite, CH) from cement hydration, primarily forming additional calcium silicate hydrate (C-S-H) gel [23].
-
• Pozzolanic Reaction (Beneficial).
SiO 2 (glass) + Ca(OH) 2 + H 2 O ^ Additional C-S-H gel
-
• Alkali-Silica Reaction (ASR).
Reactive SiO 2 + Na + /K + (alkalis) + OH “ ^ Expansive alkali-silica gel ^ Swelling ^ Cracking
Glass in cementitious systems exhibits a remarkable—and counterintuitive—phenomenon: its reactivity shifts from deleterious to beneficial as particle size decreases, as shown in Table 11. This sizedependent reversal governs whether glass acts as a source of destructive expansion or as a performance-enhancing supplementary cementitious material [24].
Table 11 . Glass powder particle size vs. dominant reaction
|
> 600 μm (coarse glass aggregate/sand) |
Harmful ASR dominant |
Coarse waste glass used as sand or aggregate (≈0.6– 2.36 mm) shows the highest ASR expansion; slow surface dissolution produces expansive gel and severe cracking in mortar bars.[25] |
|
300–600 μm (coarse–medium) |
ASR risk remains high |
Several works indicate that when the average size is in the 0.15–0.60 mm region, ASR expansion is still significant; mitigation is poor, especially at higher replacement ratios (>30%). [25] |
|
≤300 μm (general “glass powder”) |
Overall, mitigating / pozzolanic |
Multiple studies report that when the average WGP size is <300 μm, ASR expansion is strongly reduced and can fall below limits; smaller size and higher content increase the mitigation effect, mainly via pozzolanic C–S–H formation and lower pore-solution pH.[26] |
|
150–300 μm (upper powder range) |
Mixed: weak pozzolanic, residual ASR |
Fine enough to start showing pozzolanicity, but not as reactive as finer fractions; reviews note that some residual expansion can remain, especially at lower replacement levels.[27] |
|
75–150 μm (fine powder) |
Pozzolanic reaction is clearly dominant |
Experimental pozzolanic activity tests (Chapelle, PAI, conductivity) show that 75 μm and finer fractions are active pozzolans; matrix densification and CH consumption are evident, while ASR is controlled. [27] |
|
45–75 μm (fine–very fine) |
Strong pozzolanic, good ASR control |
Studies with maximum grain sizes of 75 μm and 45 μm show higher pozzolanic indices and better strength; smaller fractions give higher reaction rates and better control of ASR. [27] |
|
38–53 μm (narrow fine band) |
Very effective ASR mitigation |
ACI/ICAP work on 38–53 μm WGP shows “excellent” mitigation: at 20–30% replacement, expansion is lower than or comparable to fly ash, due to intensive pozzolanic C–S–H and alkali binding. [26] |
|
<45 μm (very fine) |
High pozzolanic reactivity |
Chapelle and lime tests show clear pozzolanic activity; performance index with cement confirms SCM behavior, with a smaller size giving better reaction rates and higher strength gain. [27] |
|
<20 μm (ultrafine range in some studies) |
Accelerated pozzolanic, ASR suppression |
Work cited in Borges et al. shows that the smallest fraction studied (<20 μm) has the best pozzolanic behavior; reviews note that 5–20 μm particles are strongly reactive and associated with effective ASR control. [27,28] |
Total Material Costs refers to the complete expense incurred by a business for all raw materials, components, and supplies used in producing goods or delivering services during a specific period. It's a key component of Cost of Goods Sold (COGS) in manufacturing and production accounting [29]. Table 12 shows the total cost in rub/m³ of the control (A) and the optimal mix (B).
Table 12. Total Material Costs
|
Ultra-fine glass powder 0.00.05 mm |
- |
22.42*67.6=1515.592 |
67.6 |
|
Superplasticizer |
5.46*65=354.9 |
5.46*65=354.9 |
65 |
|
Total |
33067.4 rub/m³ |
37830.132 rub/m³ |
-
3 Results and Discussion.
Compressive strength. The study evaluated the compressive strength of concrete with 0–20% replacement of fine aggregate by glass powder over 28 days. The results revealed two key findings: although all specimens gained strength with age, the glass-modified concrete consistently outperformed the conventional mix, exhibiting compressive strengths of 55.92, 61.98, 58.36, and 55.95 MPa at replacement levels of 0%, 10%, 15%, and 20%, respectively, as shown in Figure 14 . Arivalagan [30] found that the compressive strengths at 0%, 10%, 20%, and 30% glass replacement were 23.57 MPa, 26.88 MPa, 27.11 MPa, and 22.76 MPa, respectively. Bimantara [31]reported that when fine aggregate was partially replaced with glass at 0%, 5%, 10%, and 15%, the corresponding compressive strengths were 35.10 MPa, 35.01 MPa, 35.10 MPa, and 35.57 MPa, respectively.
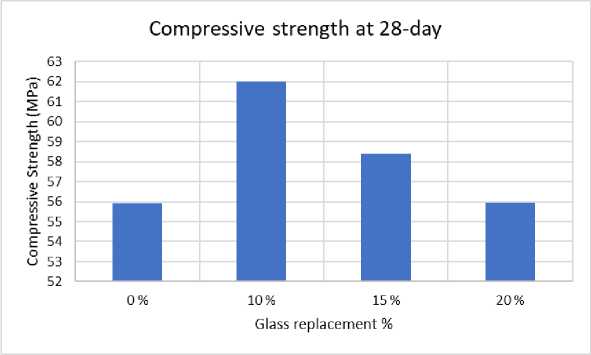
Fig. 14 – Compressive strength at 28-day
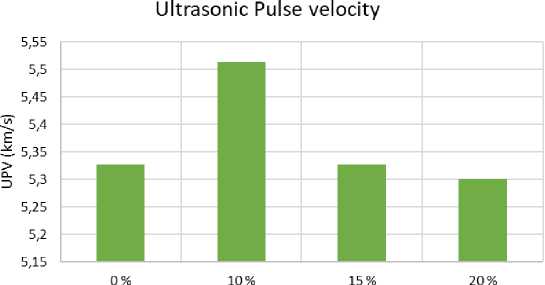
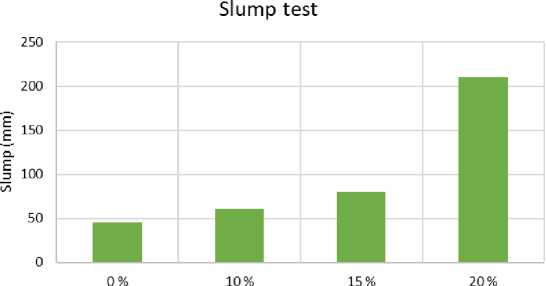
Ultrasonic Pulse velocity of cube specimens was measured using the PULSAR-2.1 device (Chelyabinsk, Russian Federation). The recorded values of UPV were 5.33, 5.51, 5.33, and 5.30 km/s, respectively. As shown in Figure 15 , the velocity increased with the addition of glass up to 15% replacement compared to the control; however, it decreased at 20% replacement. The workability of the concrete mixture, assessed via the slump test, increased with the addition of increasing percentages of glass powder. As shown in Figure 16 , slump values rose from 45 mm at 0% replacement to 60 mm at 10%, 80 mm at 15%, and sharply increased to 210 mm at 20%, indicating significantly enhanced flowability at higher replacement levels.
In comparison, Arivalagan [14] reported decreasing slump values with increasing glass content: 97 mm at 0%, 95 mm at 10%, 72 mm at 20%, and 65 mm at 30% — suggesting reduced workability at higher replacement percentages in their study.
Similarly, Bimantara observed relatively stable workability: 70 mm at 0%, 85 mm at 5%, 75 mm at 10%, and 77.5 mm at 15% — with only minor fluctuations across replacement levels.
These variations may be attributed to differences in glass particle size, fineness, water-cement ratio, or mix design methodology between studies.
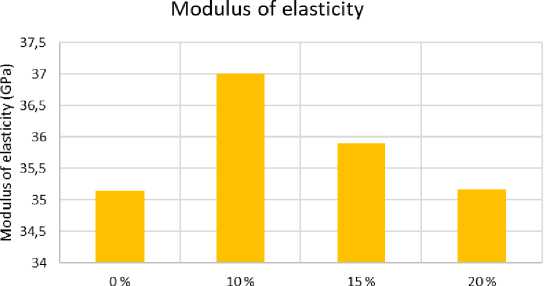
The modulus of elasticity was affected by the addition of glass powder: it was 35.14 GPa at 0%, increased to 37.0 GPa at 10%, then decreased to 35.9 GPa at 15%, and further declined to 35.16 GPa at 20%—indicating a general reduction with higher percentages of glass powder beyond 10% as shown in Figure 17. Yassen [32] also found that the modulus of elasticity was affected by the addition of glass powder. The values were 19.752 GPa at 0% replacement, 20.625 GPa at 10%, 20.400 GPa at 15%, 20.390 GPa at 20%, and 19.650 GPa at 25%, indicating an initial increase followed by a gradual decline as the glass powder content exceeded 10%. Figure 18 shows the variation of load with time for different percentages of glass replacement.
o beid , m.a.a.; a bu -m ahadi , m.i.; m arkovich , a.s.; q ais , a.a.q.; n asrat , n.a.g.; p irot , o.m.; a bebe , t.a. ; j azzan , m.; k veng ., P.
Figures 19–37 show the simulation results for different types of concrete in the SCAD++ program (SCAD Office is an advanced system of new generation designed by engineers for engineers and developed by a team of skillful programmers) [33].
Specifically, Figures 19, 24, 29, and 34 present the 3D models [34] of Type A, B, C, and D concrete specimens [35], respectively. Figures 20, 25, 30, and 34 illustrate the simulated displacements for these specimen types. Additionally, the distributions of principal and equivalent stresses, along with simulated failure modes, are shown in:
-
• Figures 21–23 for Type A,
-
• Figures 26–28 for Type B,
-
• Figures 31–33 for Type C, and
-
• Figures 35–38 for Type D.
Glass replacement%
Fig. 15 – Ultrasonic Pulse velocity of cube specimens
Glass replacement %
Fig. 16 – Slump test obeid, m.a.a.; abu-mahadi, m.i.; markovich, a.s.; qais, a.a.q.; nasrat, n.a.g.; pirot, o.m.; abebe, t.a.; jazzan, m.; kveng., P.
Glass replacement %
Fig. 17 – Modulus of elasticity
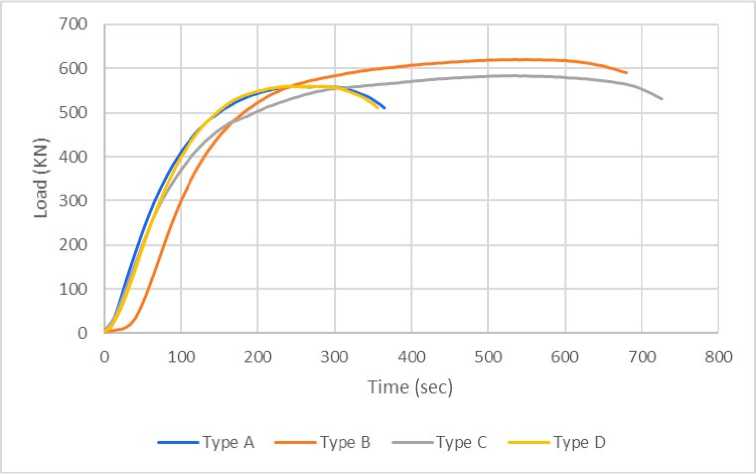
Fig. 18 – Loads for different types of concrete specimens after testing on the C040PN machine
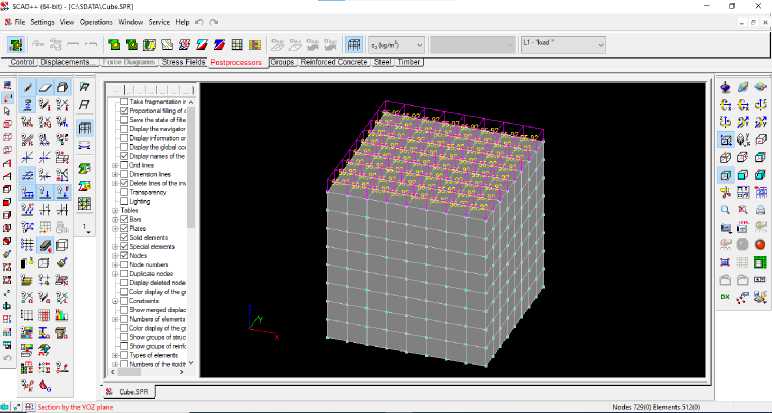
Fig. 19 – 3D modeling in SCAD++ of Type A concrete specimens exhibiting maximum compressive strength after testing on the C040PN machine obeid, m.a.a.; abu-mahadi, m.i.; markovich, a.s.; qais, a.a.q.; nasrat, n.a.g.; pirot, o.m.; abebe, t.a.; jazzan, m.; kveng., P.
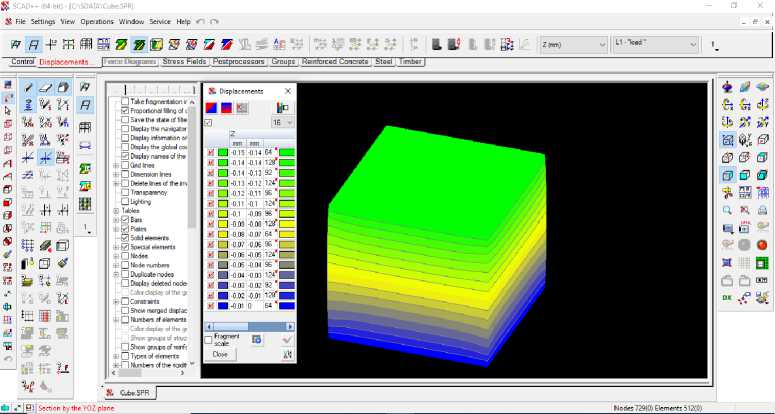
Fig. 20 – Simulated displacements of Type A concrete specimens using SCAD++
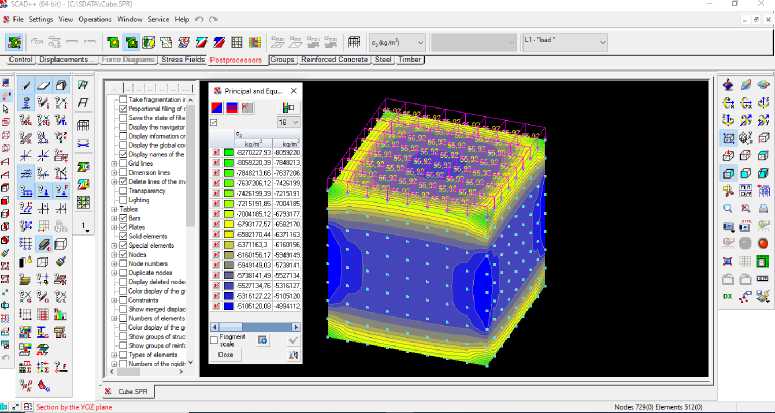
Fig. 21 – Distribution of Principal and Equivalent Stresses in Type A Concrete Specimens (SCAD++ Simulation)
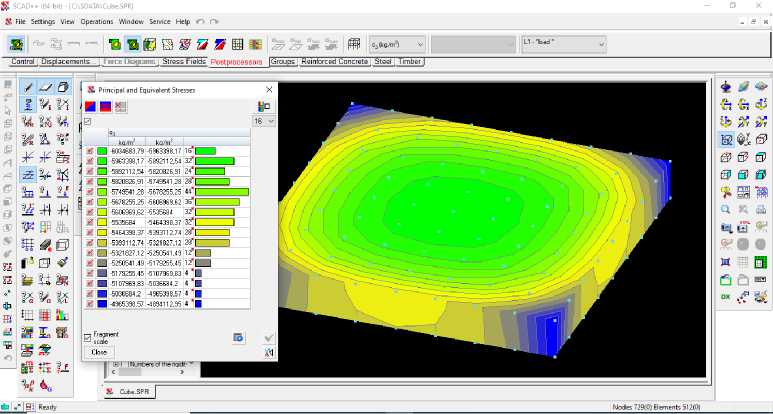
Fig. 22 – Principal and Equivalent Stresses at the Center of the Type A Concrete Specimen — SCAD++ Finite Element Simulation
o beid , m.a.a.; a bu -m ahadi , m.i.; m arkovich , a.s.; q ais , a.a.q.; n asrat , n.a.g.; p irot , o.m.; a bebe , t.a. ; j azzan , m.; k veng ., P.
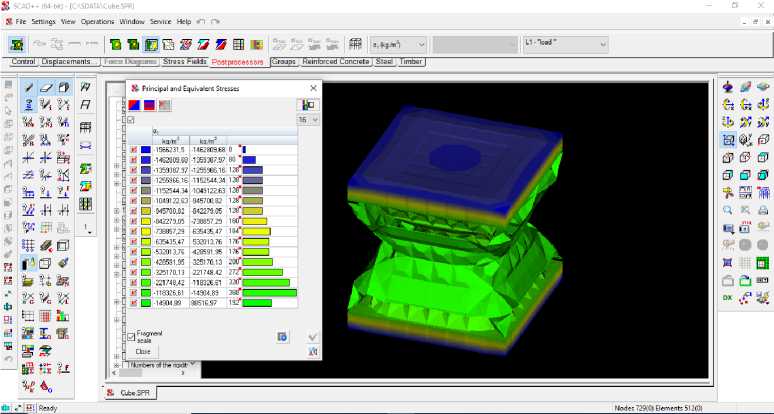
Fig. 23 – Simulated Failure Modes of a Concrete Cube under Uniaxial Compression in SCAD++
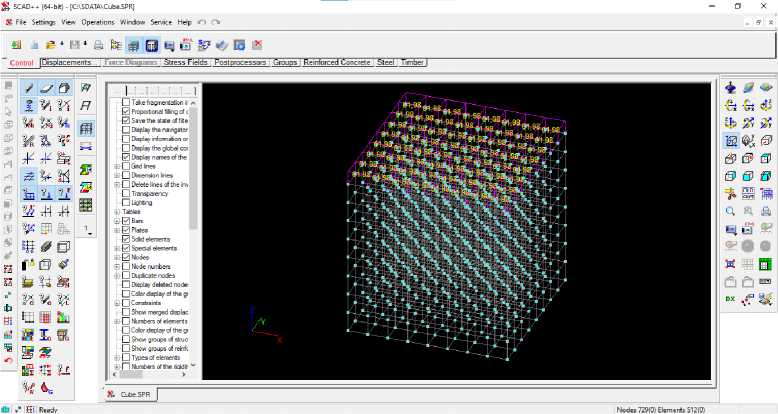
Fig. 24 – 3D modeling in SCAD++ of Type B concrete specimens exhibiting maximum compressive strength after testing on the C040PN machine
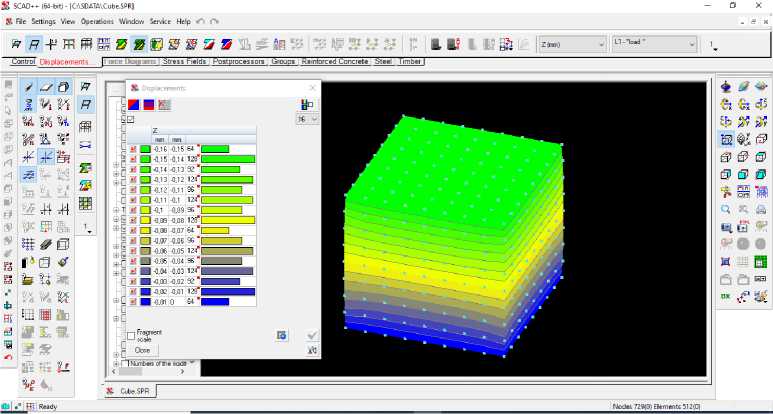
Fig. 25 – Simulated displacements of Type B concrete specimens using SCAD++
o beid , m.a.a.; a bu -m ahadi , m.i.; m arkovich , a.s.; q ais , a.a.q.; n asrat , n.a.g.; p irot , o.m.; a bebe , t.a. ; j azzan , m.; k veng ., P.
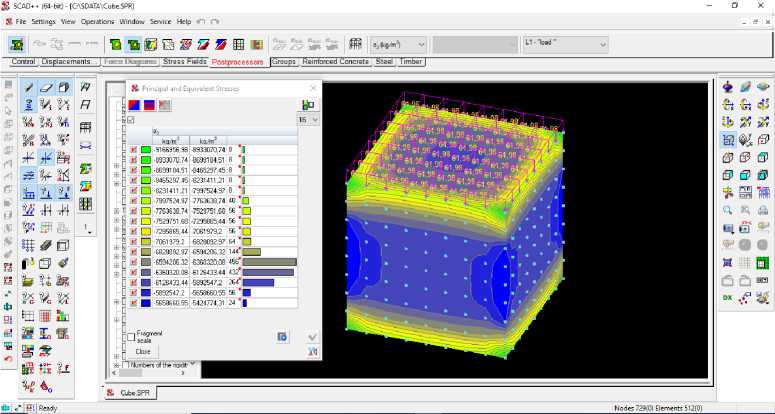
Fig. 26 – Distribution of Principal and Equivalent Stresses in Type B Concrete Specimens (SCAD++ Simulation)
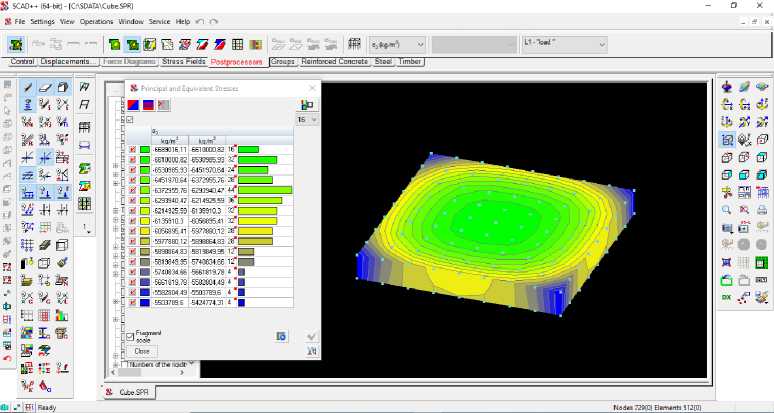
Fig. 27 – Principal and Equivalent Stresses at the Center of the Type B Concrete Specimen — SCAD++ Finite Element Simulation
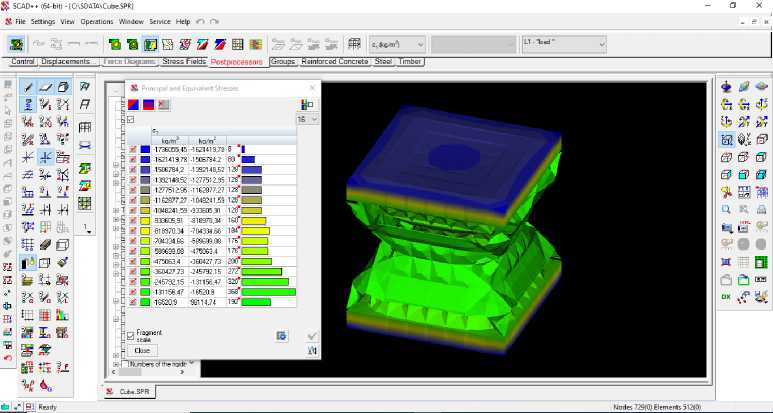
Fig. 28 – Simulated Failure Modes of a Concrete Cube under Uniaxial Compression in SCAD++
o beid , m.a.a.; a bu -m ahadi , m.i.; m arkovich , a.s.; q ais , a.a.q.; n asrat , n.a.g.; p irot , o.m.; a bebe , t.a. ; j azzan , m.; k veng ., P.
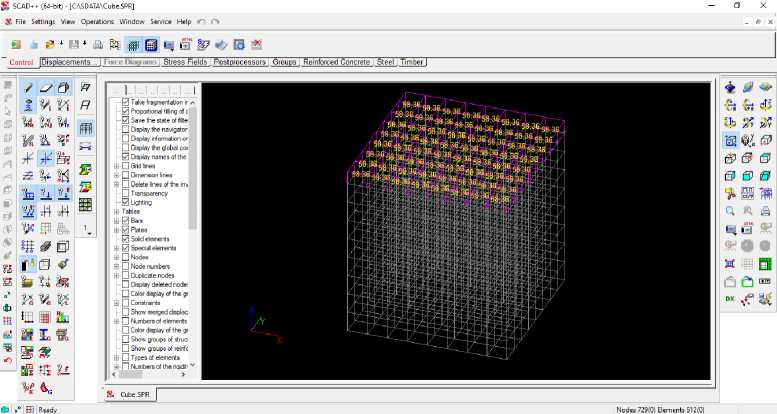
Fig. 29 – 3D modeling in SCAD++ of Type C concrete specimens exhibiting maximum compressive strength after testing on the C040PN machine
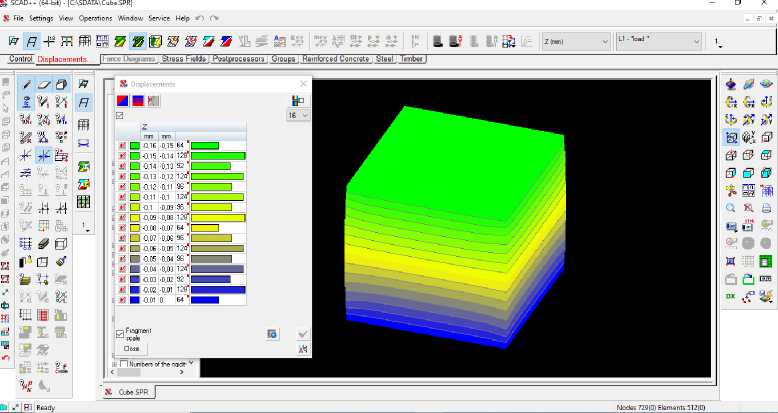
Fig. 30 – Simulated displacements of Type C concrete specimens using SCAD++
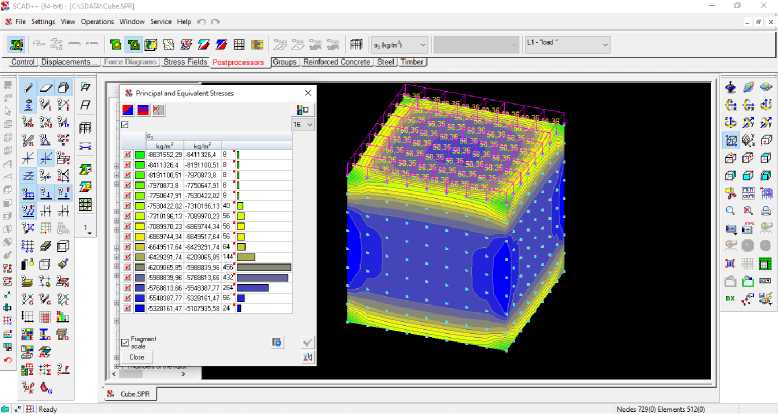
Fig. 31 – Distribution of Principal and Equivalent Stresses in Type C Concrete Specimens (SCAD++ Simulation)
o beid , m.a.a.; a bu -m ahadi , m.i.; m arkovich , a.s.; q ais , a.a.q.; n asrat , n.a.g.; p irot , o.m.; a bebe , t.a. ; j azzan , m.; k veng ., P.
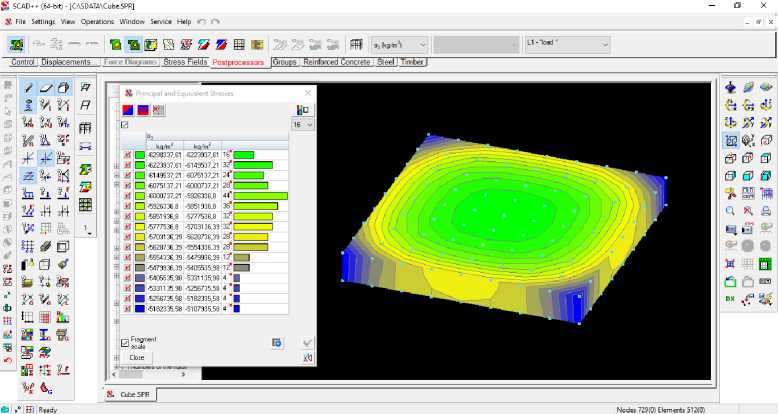
Fig. 32 – Principal and Equivalent Stresses at the Center of the Type C Concrete Specimen — SCAD++ Finite Element Simulation
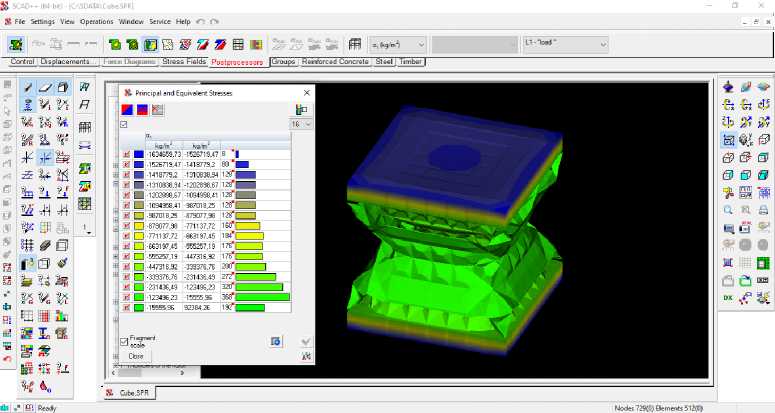
Fig. 33 – Simulated Failure Modes of a Concrete Cube under Uniaxial Compression in SCAD++
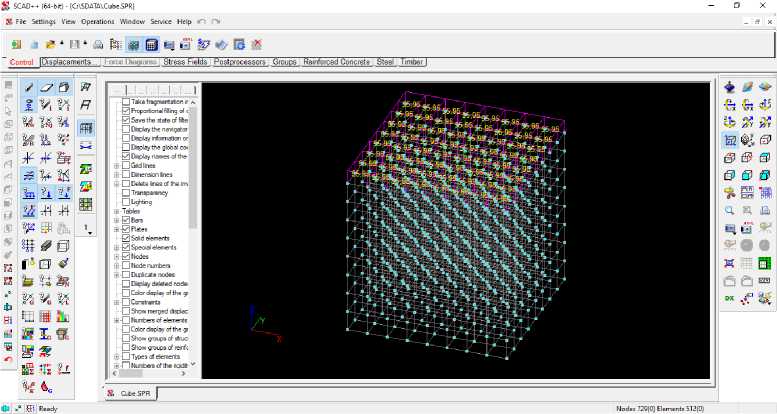
Fig. 34 – 3D modeling in SCAD++ of Type D concrete specimens exhibiting maximum compressive strength after testing on the C040PN machine
o beid , m.a.a.; a bu -m ahadi , m.i.; m arkovich , a.s.; q ais , a.a.q.; n asrat , n.a.g.; p irot , o.m.; a bebe , t.a. ; j azzan , m.; k veng ., P.
* я+-ряии»гв®»э®а^5в 5|s*^««|i: ■,№ lk® « u-'-
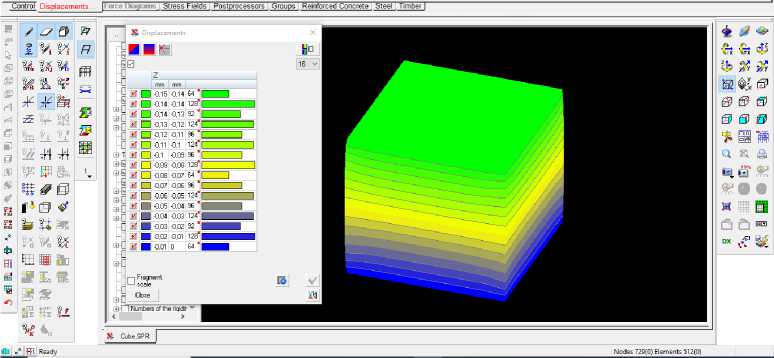
Fig. 35 – Simulated displacements of Type D concrete specimens using SCAD++
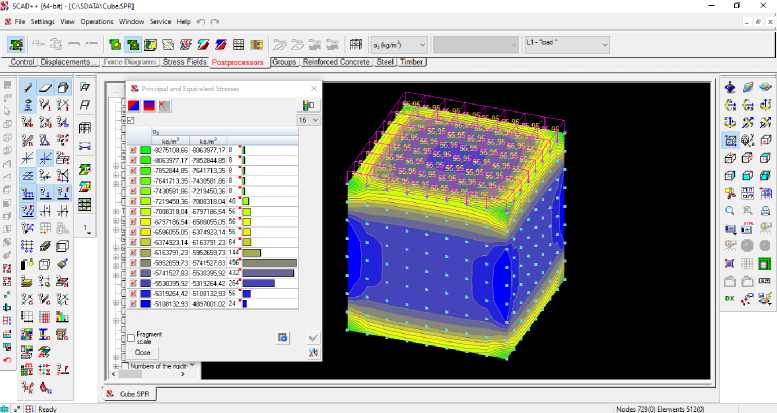
Fig. 36 – Distribution of Principal and Equivalent Stresses in Type D Concrete Specimens (SCAD++ Simulation)
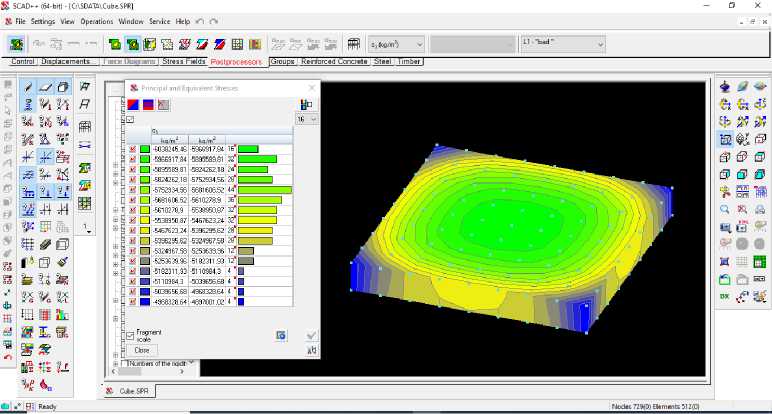
Fig. 37 – Principal and Equivalent Stresses at the Center of the Type D Concrete Specimen — SCAD++ Finite Element Simulation
o beid , m.a.a.; a bu -m ahadi , m.i.; m arkovich , a.s.; q ais , a.a.q.; n asrat , n.a.g.; p irot , o.m.; a bebe , t.a. ; j azzan , m.; k veng ., P.
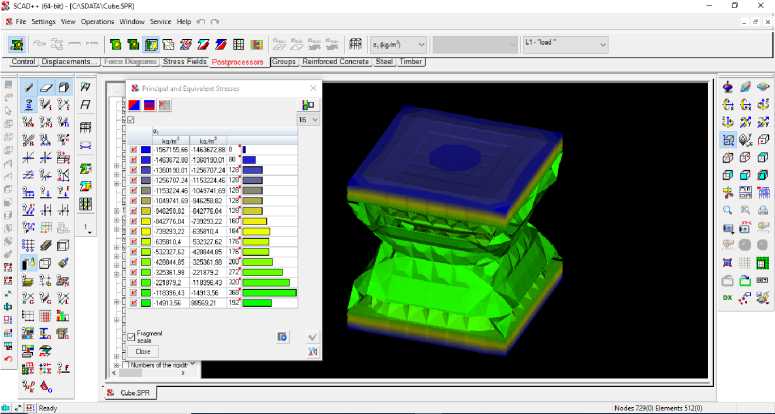
Fig. 38 – Simulated Failure Modes of a Concrete Cube under Uniaxial Compression in SCAD++
Figure 39 shows the compressive strength of the specimens evaluated both experimentally (using the C040PN compression testing machine) and numerically (via SCAD++ simulation). As can be seen, there is a small difference between the experimental and simulated results. Figure 39 further illustrates this discrepancy by comparing the compressive strength values obtained from the C040PN machine with those predicted by SCAD++ simulation.
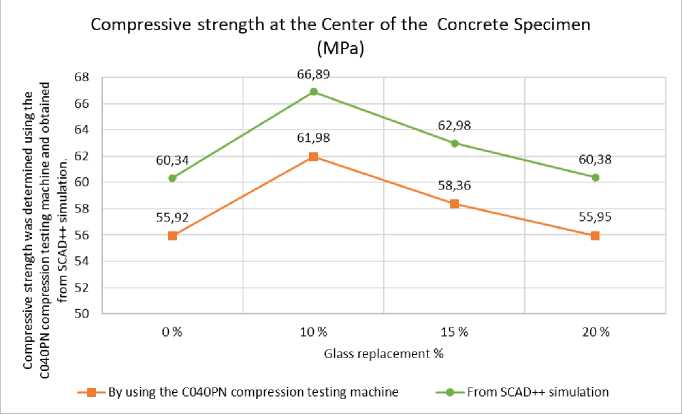
Fig. 39 – Compressive strength was evaluated both experimentally (using the C040PN compression testing machine) and numerically (via SCAD++ simulation)
o beid , m.a.a.; a bu -m ahadi , m.i.; m arkovich , a.s.; q ais , a.a.q.; n asrat , n.a.g.; p irot , o.m.; a bebe , t.a. ; j azzan , m.; k veng ., P.
The difference between compressive strength obtained using the C040PN compression testing machine and that obtained numerically via SCAD++ simulation.
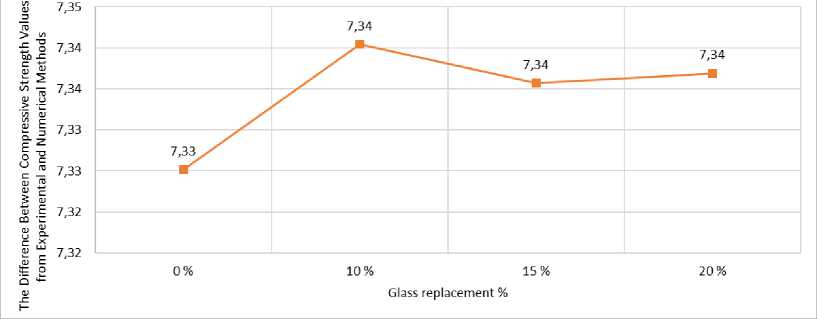
Fig. 40 – The difference between compressive strength obtained using the C040PN compression testing machine and that obtained numerically via SCAD++ simulation
Glass replacement %
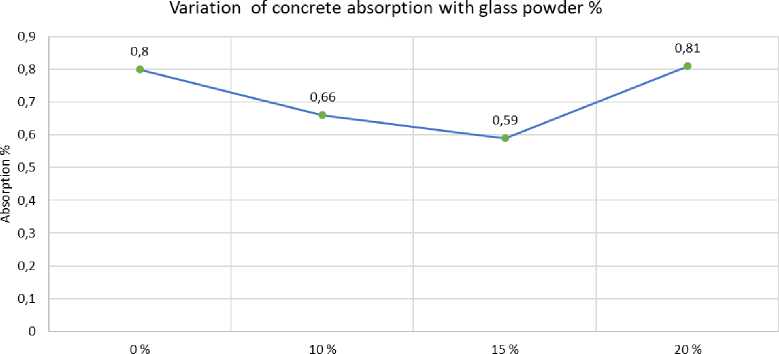
Fig. 41 – Variation of concrete absorption with glass powder %
Figure 41 shows the % absorption versus glass powder content [36]. The results show that some GP mixes gave lower absorption percentages compared to the reference mix, while others gave higher. The percentage decrease in % absorption was 17.5% and 26.25% for 10% and 15% GP, respectively, and then it increased by 1.25% compared to the reference mix for 20% GP. Yassen [32] also found that the percentage decrease in %absorption was:15.47%, 26.58%, 30.44%, and 35.27% for 10%, 15%, 20% and 25% GP replacement, respectively.
-
4 Conclusion
This study investigated glass powder and ultra-fine glass powder as a sustainable partial replacement for natural sand in M25-grade concrete, employing experimental methods to evaluate their mechanical and physical feasibility. The research process involved:
-
1. Preparing concrete mixes with 10–20% glass powder replacement (by weight of fine aggregate) following ACI 211.1 standards.
-
2. Testing compressive strength at 28 days.
-
3. Testing water absorption.
-
4. Comparing results with conventional concrete to identify optimal replacement thresholds.
Optimal Replacement Threshold:
-
• 10% glass powder replacement maximizes compressive strength (61.98 MPa at 28 days), achieving 10.83 % of control mix performance (55.92 MPa).
o beid , m.a.a.; a bu -m ahadi , m.i.; m arkovich , a.s.; q ais , a.a.q.; n asrat , n.a.g.; p irot , o.m.; a bebe , t.a. ; j azzan , m.; k veng ., P.
-
• Water absorption was 0.66% for 10% replacement and 0.59% for 15% replacement.
-
• Ultrasonic Pulse velocity of the cube with 10 % glass powder replacement was 5.51 km/s
-
• Slump was 60 mm with 10% glass powder replacement.
-
• The modulus of elasticity was 37 GPa for 10%
-
• Baseline material cost (no glass powder) 33067.4 rub/m³ and with glass powder 37830.132 rub/m³ with Incremental cost 4762.732 rub/m³ and relative increase 14.4%
Performance Degradation Beyond Thresholds:
-
• At 28 days, glass powder replacement levels of 10%–20% resulted in an increase in compressive strength of 0.05%–10.8% and in modulus of elasticity of 0.05%–5.29%.
Microstructural Advantage:
-
• The finer particle size and angular morphology of glass powder—inferred from the strength data—enhance packing density at replacement levels of up to 20%. However, scanning electron microscopy (SEM) validation is recommended in future work to confirm these microstructural characteristics.
Sustainability Validation:
-
• The 20% replacement threshold aligns with circular economy principles, reducing natural sand demand by ~1.8 tons per 10 m³ of concrete while repurposing industrial byproducts.
5 Acknowledgements
The authors would like to acknowledge the technical support of the concrete laboratory in the Civil Engineering Department at the Faculty of Engineering Technology, RUDN University.
-
6 Conflict of Interests
The authors declare no conflict of interest.
