Diffusion of innovation in modern school

Author: Lazar Stošić, Irena Stošić
Journal: International Journal of Cognitive Research in Science, Engineering and Education @ijcrsee
Section: Original research
Article in issue: 1 vol.1, 2013.
Free access
This paper presents the results of research aimed to examine how teachers are interested in the application of innovation in teaching and in their personal development. An attempt was made to determine their opinion on the application of innovation in education. Sample consisted of 162 teachers (N = 162) in primary and secondary schools. We used the technique of scaling and instrument evaluation scale that was specifically designed for this research. The results show that teachers easily and smoothly implement innovations in their educational work and the knowledge gained by applying innovation far better in terms of practical application and durability of the knowledge acquired without the use of innovation. A qualitative analysis has shown that the majority of respondents had positive views of the use of innovations in their schools.
Innovation, modern schools, information technology, teacher education
Short address: https://sciup.org/170198367
IDR: 170198367
Text of the scientific article Diffusion of innovation in modern school
Modern information technology has changed the way of working in all areas of life. This new information technology has influenced major changes in the school system. Alexander King points out that ''after the steam engine no other single invention has had such a huge impact on all areas of human activity as the phenomena of chips and integrated circuits''. Educative work continues to be performed according to the formula of J. A. Komenski, which was introduced more than three centuries ago. Schools must fundamentally change the approach to work as influenced by information technology, gradually abandoning the tradition established by Komenski. It was a revolutionary step in the development of education, but over time, its possibilities are exhausted so that it is in the present circumstances it has become a factor that limits the the contemporary role of schools [8]. Teachers, students and the school itself have now found themselves in a very different information environment than before. Schools that accept this environment will be much more modern and more successful and will not look like traditional schools where the teacher and the textbook are the only available sources of knowledge. By applying information technology, schools can continually innovate their new knowledge. Innovation is the requirement that the school does not remain at the traditional level.
The term ''innovation'' came into use in 1930, as a term used in sociology and cultural anthropology, and is directly connected with the idea of expanding cultural phenomena. This approach is different in spatial and temporal distribution of time, which has different rates, widespread at present. The innovation in this approach is considered as the basis of changes in culture and dissemination of cultural features or subculture of their own borders. The term innovation is of Latin origin (novus - new, inovatio - novelty, change, innovate - to do something new). Innovation is considered to be improving, upgrading, modernization and development. However, there are various definitions of the concept of innovation. Everett Rogers says that “the idea that innovation is the new individual. It does not matter if the idea is objectively new or not, it is time that has elapsed since its first use or discovery.” LaPiere points out that innovation is a new idea. D. McClelland says that innovation is something new or different from the previous time or special situation. V. Djurić notes that it is an idea that has been recently created, or we recently got in touch with, and is different from the existing ones. B. Vlahović believes that every educational innovation consciously constructs and creates a change that brings new moments and positively changes the essence of the current state of the educational process [8]. Most authors agree, however, that Rogers's understanding is correct. P. Mandić said that innovation in the upbringing and educational activities is a synchronized system of pedagogical, social, organizational and economic measures (based firmly on educational and other sciences) aimed at raising the level and quality of educational work, the rational use of human resources, time and creativity of teachers and students. He gives a more extensive classification of innovation that includes the education system and work in schools. He distinguishes innovation as changes in educational objectives, the function of the school system, teaching contents and function of teachers, resources, work, organization, implementation and evaluation of teaching.
We tried to find out the perception of teachers towards the implementation of innovations in educational work.
reliability, examine whether the results obtained from SPISŠ1 scales meet the criteria of normality curvature distribution, i.e. parametric criteria, examine whether there is interconnection among the items of SPISŠ1 scale on the basis of which they can be reduced to a smaller number of more fundamental variables (factors) that explain this inter-connectedness; to examine whether the beliefs of male teachers are more positive beliefs than female teachers.
The method applied in this study is selected in accordance with the objectives, goals and tasks of research, and in accordance with the hypotheses. The survey will use scaling technique and instrument evaluation scale (Likert), which will be specially designed for this research. It consists of 15 items that include statements that describe the perceptions of teachers towards the implementation of school innovation. Every statement is offered as a five-point response scale from 1 to 5, where the numbers mean the following: 1-very strongly disagree, 2-Disagree, 3-Tend to agree, 4-agree, 5-agree very.
3. The organization and flow of the experimental research
2. Methods
The goal of this research is reflected in the effort to investigate how teachers are interested in the application of innovations in teaching and for their personal development. The study sample consisted of 162 teachers, 57 in primary and 105 in secondary schools.
The tasks of this study were to: examine whether, based on the beliefs of teachers, SPISŠ1 scale meets the criteria of
The study was conducted in primary and secondary schools; primary schools “Branko Radičević” in Vranje, and “Vuk Karadžić” in Surdulica, and in Technical Secondary School and Secondary School of Economics in Vranje. There were 57 (35.2%) elementary school teachers (20 primary school and 37 middle school teachers), and 105 (64.8%) secondary school teachers (Table 1).
Table 1. The structure of the sample of teachers
|
Variables |
f |
% |
|
|
Male |
68 |
42 |
|
|
Gender |
Female |
94 |
58 |
|
Total |
162 |
100 |
|
|
Elementary School |
57 |
35,2 |
|
|
Type of school |
Secondary school |
105 |
64,8 |
|
Total |
162 |
100 |
|
|
Up to 10 years |
41 |
25,3 |
|
|
Work experience |
10-30 years |
100 |
61,7 |
|
Over 30 years |
21 |
13 |
|
|
Total |
162 |
100 |
|
|
Primary school teacher |
20 |
12,3 |
|
|
Middle school teacher |
37 |
22,8 |
|
|
Profession |
Secondary school teacher |
105 |
64,8 |
|
Total |
162 |
100 |
SPSS17 software was used to process the data (Statistical Package of Social Sciences for Windows-and for parallel Monte Carlo analysis).
4. Results and Discussion
In the preliminary research there were 15 primary manifest variables. Since the number of participants should not be less than 100, or less than the number of initial variables multiplied by 5, it met the initial criteria. Table 2 shows the communality of prominent variables that tells us how much of the variance of each variable explained with a certain number of retained components (factors).
Table 2. Communality manifest variables
|
Initial |
Derived |
|
|
V1 |
1.000 |
.681 |
|
V2 |
1.000 |
.550 |
|
V3 |
1.000 |
.519 |
|
V4 |
1.000 |
.319 |
|
V5 |
1.000 |
.480 |
|
V6 |
1.000 |
.079 |
|
V7 |
1.000 |
.490 |
|
V8 |
1.000 |
.561 |
|
V9 |
1.000 |
.592 |
|
V10 |
1.000 |
.682 |
|
V11 |
1.000 |
.645 |
|
V12 |
1.000 |
.344 |
|
V13 |
1.000 |
.635 |
|
V14 |
1.000 |
.477 |
V15 1.000 .575
Extraction method (Extraction Method): The analysis of the main factors
The scale was subjected to a principal components analysis (PCA Principal Component Analysis) to SPSS v. 17. Prior to the implementation of the PCA, the suitability of data for factor analysis was ranked. A review of the correlation matrix revealed many coefficient values of 0.3 and above. The value of the Kaiser-Meyer-Okinov indicators (Table 3) was 0.877, which exceeds the recommended value of 0.6. [2,
-
3] The Bartlett test of sphericity (Bartlett, 1954) also reached statistical significance. Value Bartlett test for statistical significance of the correlation matrix 2 = 980 594 with 105 degrees of freedom and sig. 1% confirms the appropriateness of statistical analysis of the data collected by factor analysis. Bartlett indicator is significant (p = 0.000), and factor analysis was justified.
Table 3. Testing assumptions of reliability data for factor analysis Kaiser-Meyer-Olkin Measure of Sampling Adequacy.877
Approx. Chi-Square 980.594
Bartlett's Test of Sphericity
df105
Sig.000
According to Kaiser Gutmann criteria only those factors that best explain the variability are taken into account, i.e. with a value greater than one. Principal components analysis revealed the presence of three components with characteristic values exceeding 1, explaining 38.110%, 50.862% and 58.245%. Only the first three components have characteristic value above 1 (5,716, 1,913, 1,107). As the third component has the approximate value of 1, it should not be taken into consideration. The first two components explain 50.86 percent of the variance. Table 4 shows the variance explained by individual factors.
Table 4. Principal components analysis
Rotated sum of
|
Component |
Initial eigenvalues |
Featured sum of squares of saturation |
squares of saturation |
||||
|
Total |
% variance |
Cumulative series % |
Total |
% variance |
Cumulative series % |
Total |
|
|
1 |
5.716 |
38.110 |
38,110 |
5,716 |
38,110 |
38,110 |
4,762 |
|
2 |
1.913 |
12.752 |
50,862 |
1,913 |
12,752 |
50,862 |
4,535 |
|
3 |
1.107 |
7.383 |
58,245 |
||||
|
4 |
.967 |
6.449 |
64.694 |
||||
|
5 |
.855 |
5.701 |
70.394 |
||||
|
6 |
.704 |
4.695 |
75.090 |
||||
|
7 |
.617 |
4.112 |
79.202 |
||||
|
8 |
.534 |
3.563 |
82.765 |
||||
|
9 |
.514 |
3.425 |
86.189 |
||||
|
10 |
.449 |
2.995 |
89.184 |
||||
|
11 |
.401 |
2.673 |
91.856 |
||||
|
12 |
.356 |
2.376 |
94.233 |
||||
|
13 |
.337 |
2.245 |
96.478 |
||||
|
14 |
.271 |
1.806 |
98.284 |
||||
|
15 |
.257 |
1.716 |
100.000 |
||||
Extraction method (Extraction Method): The analysis of the main factors
For further confirmation of the factor analysis and determining the number of factors a parallel analysis was performed (Table 5) and the results were compared with those obtained in SPSS (Table 6).
Table 5. The results of the parallel analysis
Monte Carlo PCA for Parallel Analysis
Version 2.5
1/26/2013 10:49:53 AM
Number of variables: 15
Number of subjects: 162
Number of replications: 100
Eigenvalue # Random Eigenvalue Standard Dev
|
1 |
1.5595 |
.0730 |
|
2 |
1.4326 |
.0494 |
|
3 |
1.3287 |
.0372 |
|
4 |
1.2433 |
.0421 |
|
5 |
1.1668 |
.0392 |
|
6 |
1.0955 |
.0321 |
|
7 |
1.0336 |
.0324 |
|
8 |
0.9692 |
.0314 |
|
9 |
0.9140 |
.0283 |
|
10 |
0.8541 |
.0289 |
|
11 |
0.8011 |
.0296 |
|
12 |
0.7436 |
.0305 |
|
13 |
0.6860 |
.0320 |
|
14 |
0.6201 |
.0330 |
|
15 |
0.5518 |
.0376 |
1/26/2013 10:49:55 AM
Monte Carlo PCA for Parallel Analysis
Table 6. Comparison of characteristic values obtained by PCA and threshold values obtained by the parallel analysis
|
Serial number of components |
The actual characteristic values of PCA |
Values obtained by parallel analysis |
Decision |
|
1 |
5,716 |
1.5595 |
Accept |
|
2 |
1,913 |
1.4326 |
Accept |
|
3 |
1,107 |
1.3287 |
Reject |
|
4 |
0,967 |
1.2433 |
Reject |
The outcome of the parallel analysis supports our conclusion to keep the two components. Here is a review of Cattell’s landslide method. Diagrams show
(Scree Plot) the existence of a clear break point after the third component. Based on Cattell’s criteria it was decided to retain for further exploration of two components.
This is supported by the results of parallel analyzes, with only two components whose characteristic values exceed the corresponding threshold values obtained with the equally large array of random numbers (variable 15 * 162 respondents).
Fig. 1 A number of factors of Cattell’s method by landslides (Scree Plot)
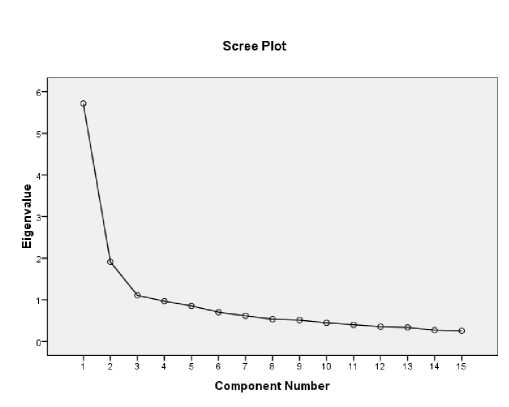
The attached chart clearly shows fracture at the junction of the second and third components. And the first component explains much more of the variance of the remaining components. The greatest burden lies on the first factor, which has the highest value in explaining manifest variables. Each successive factor explains a smaller proportion of the total variance.
Processing of data in a table shows that the component 1 has eight weight factors, component 2 also has eight factors, component 3 has only one factor above 0.3. It would be ideal if each component had three or more of the weight factors, so this solution is not optimal, which means that it should accept only two factors.
This two-component solution explained a total of 50.86% of the variance, with a contribution of 1 component of 38.11%, and 2 components of 12.75%. To help interpret these two components rotations were performed. Rotated solution revealed the presence of a simple structure, in which both components have a lot of big weight factor and all variables provide considerable weight of only one component.
Two-factor solution explained only 50.86 percent of the variance. After the rotation two-factor solutions we can see that the main component weight factor 1 the items 9, 11, 8, 10 and 15 The main items of Component 2 are 13, 1, 2 and 5 (Table 7).
Table 7. Primary Factors to evaluate
Component
V9.834
V11.792
V8.778
V10.752
V15.727
V7.648
V12.416
V13.847
V1.832
V2.748
V5.732
V14.625
V4.496
V3 .381.466
V6
Extraction method: principal component analysis
Rotation Method: Oblimin with Kaiser normalization
Factor 1, which has the highest value, can be called ''Innovation in teaching'' because it is characterized by variables related to the implementation of innovations in teaching, use of the Internet in teaching and the use of innovation in teaching.
Factor 2 is related to the school system and the use of innovations in schools which is why we can name it “Innovation in schools”. Variables that describe this factor are: use of systemic innovation in schools, the use of space and technical innovations in schools, the implementation of the evaluational and docimological innovations.
By using two-factor univariate ANOVA on data obtained SPISŠ1 scale we tried to determine the interconnection of independent variables (gender and occupation) in relation to the beliefs of teachers in the interest of application innovation in teaching (Table 8).
Table 8. Tests influences between variables
|
Gender |
Profession |
M |
SD |
N aF ap bF bp |
cF cp |
|
1 Male |
Primary school teacher |
4.00 |
. |
1 |
|
|
Middle school teacher |
4.62 |
.719 |
16 |
||
|
Secondary school teacher |
4.27 |
.802 |
51 |
||
|
Total |
4.35 |
.787 |
68 |
||
|
2 Female |
Primary school teacher |
4.11 |
.994 |
19 |
|
|
Middle school teacher |
4.19 |
.814 |
21 |
||
|
Secondary school teacher |
4.28 |
.763 |
54 |
||
|
Total |
4.22 |
.819 |
94 |
||
|
Total |
Primary school teacher |
4.10 |
.968 |
20 |
|
|
Middle school teacher |
4.38 |
.794 |
37 |
||
|
Secondary school teacher |
4.28 |
.778 |
105 |
||
|
Total |
4.28 |
.806 |
162 ,136 ,713 ,546 ,580 |
1,024 ,362 |
From Table 8 we can see that the beliefs of male teachers (M = 4.35) were not significantly different from those of female teachers (M = 4.22), which confirms the F ratio (f = 0.136) was not statistically significant. We conclude that the result is not consistent with the assumption that the responses of male subjects are more positive than the responses of female respondents. Also, the value of F ratio indicates that there is no statistically significant difference between the average degree of deviation from the standard of results between the male members (SD = 0.78) and female members (SD = 0,81).
As for the interaction of gender and occupations, it can be said that there is a mutual relationship between these independent variables in relation to the factor of interest in the application of innovation (bf = .54). From this we can conclude that there is no statistically significant difference in the beliefs of male and female teachers.
The beliefs of male middle school teachers (M = 4.62) were more positive than those from female teachers (M = 4,19). Overall, middle teachers’ beliefs (M = 4.38) were more positive than those of secondary school teachers (M = 4.28) and primary school teachers (M = 4,10). That's all we can see and the inclination of the line on the graph where the line 2 steepest, followed by line 3 and at the end of line 1
Fig. 2 Means - The interest of teachers in the use of innovations in teaching
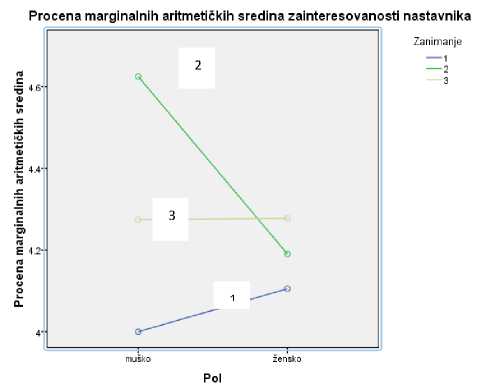
Note: 1-primary school teachers, 2-middle school teachers, 3-secondary school teachers
Given the overall high scale value of M = 4.28 we can say that middle school teachers are interested in the application of innovation in education. Despite these results, it is desirable to conduct a new research on the beliefs of teachers in the implementation of innovations in education and look for the dominant factors that increase teachers' motivation for innovation in education.
5. Conclusion
This paper was written with the aim to investigate and determine what the attitudes toward implementation of innovation in education are. In the paper, we set up a hypothesis on which we have conducted research and have come to the following conclusions.
The first hypothesis is related to the fact that the scale meets the criteria of reliability. As the value of the Cronbach alpha coefficient equals 0.875, the scale meets the criteria of reliability, which we confirmed the first hypothesis.
The second hypothesis is related to the fact that the set items meet the parametric criteria. Using the Kolmorgor-Smirn test and Shapiro-Vilkov test we found that the distribution of results SPISŠ1 scale is at the level of significance of p = 0.001 and for all 15 claims which have confirmed the second hypothesis. This means that further analysis of the results we can use parametric tests.
Among the items of SPISŠ1 scale interconnection exists on the basis of which they can be reduced to a small number of fundamental variables (factors) that explain the interconnection. Factor analyses of the 15 items of the scale are factorized and get two fundamental variables: innovations in teaching and school innovation.
The results are consistent with the assumption that the responses of male subjects are more positive than the responses from female respondents. From this we can conclude that there is no statistically significant difference in the beliefs of male and female teachers.
The overall grade of middle school teachers’ beliefs (M = 4.38) was more positive than that of high school teachers (M = 4.28) and primary school teachers (M = 4,10).
Modern schools have extensive experience in teaching, which must be carried out in certain educational activities. Very often it remains unused because most teachers do not see the need for its study and application. In practice, teachers often do not think about the need and feasibility analysis of their own teaching experience. The innovative nature of the teacher involves the creation, development and use of pedagogical innovation and the creation of conditions for their successful development and implementation. The introduction of new items requires constant search for new forms of organization, ICT education. The innovative nature of a teacher includes the introduction of practical results of teaching activities in psychological and educational research.
The introduction of optimality in the application and dissemination of innovations in modern school means efforts and resources for teachers to achieve results. With the help of innovations, all of which are present due to the development of information and communication technologies, different teachers can achieve equally good results in different areas and with different intensity of their own work. Analysis of the literature and the results obtained by empirical studies suggests a lack of intensity of use of innovation in education. The reasons for this are that the innovation and application of new ICTs does not bring the expertise needed to use innovative means and that the application of innovation is not preceded by organizational or technical preparation in schools and individuals. The hesitation to introduce innovations in school is mostly the result of psychological aversion of teachers (not all) due to a lack of technical expertise in implementation. This suggests that teachers need to prepare for the implementation of innovations in education in order to get the most out of them and therefore shift from a traditional to a modern school.
