Effect of GS-MS on different steaming time on nutrition and flavor of red shrimp

Free access
In this paper, method of gas chromatography -mass spectrometry(GC-MS) is used to systematically analyze the effects of the three different steaming times (15 min, 20 min, 25 min) that are purposely used to differentiate any flavor substances of the red shrimp samples. The results show that the timing of the three chosen steaming times have great influence on the flavor(alcohols, sulfur, nitrogen and carbonyl compounds) of the red shrimps, In addition, steaming the red shrimps that are approximately weighted at a value of 28.89 g/100 g at 20 min have the highest amount of amino acid (except tryptophan) present in the muscles as well as other contents that are volatile substances. Therefore, the red shrimps steamed for 20 min have higher nutritional value and better flavor.
Red shrimp, cooking time, gas chromatography - mass spectrometry, amino acids content, flavor analysis
Short address: https://sciup.org/147160754
IDR: 147160754 | UDC: 639.28
Влияние времени варки красных креветок на их пищевую ценность и вкусовые характеристики
Рассматривается использование метода газовой хроматографии и масс-спектрометрии при варке красных креветок в разные временные отрезки (15; 20; 25 минут) с целью выявления изменений вкусовых характеристик продукта. Результаты показывают, что изменения временных рамок варки очень влияют на вкус, а также на содержание спирта, серы, азота и карбонильных соединений. Кроме того, красные креветки весом 28,89 г после варки в течение 20 минут характеризуются наибольшим количеством аминокислот в мышечных тканях (за исключением триптофана). Таким образом, красные креветки после варки в течение 20 минут имеют высшую питательную ценность и лучшие вкусовые свойства.
Text of the scientific article Effect of GS-MS on different steaming time on nutrition and flavor of red shrimp
China pipe whip shrimp that is commonly known as red shrimp, Solenocera Melantho, belongs to medium-sized shrimp with a body length of 5.0–10.0 cm. It is widely distributed and more importantly, it is rich in protein and minerals such as calcium, phosphorus, and iron while it is easy to digest. Additionally, it is rich in iodine and thus provides great beneficial to human health. The nutritious shrimp is rich in magnesium in which it has an essential role in the heart activities in which it helps regulate the cardiovascular system to be well protected by reducing the blood cholesterol level to prevent atherosclerosis and expanding the coronary arteries to prevent hypertension and myocardial infarction. Shrimp meat is soft, frail and an excellent choice of food to be ingested by any person who experience sickness. In addition, scientists from different university have recently found that shrimp’s astaxanthin has a relatively good biological effect (Aoi W et al, 2003; Hussein G et al., 2005; Oh-gami K et al., 2003; Hussein G et al., 2005).
Improvements in modern technology and living standard has increase the high demand of nutrients pursuit that is related to the sensory because the flavor has great relevance to the final data for the sensory evaluation according to the relevant foreign based photographic experiments (K. Raesa et al., 2003; Verbeke, W et al., 1999). For the flavor component of the studied shrimps, the impact of the volatile components is larger because during digestion, olfactory receptors in the nasal cavity has stimulated (Linforth R.S. et al., 1993). Therefore, flavor volatile aroma, is the main sensory quality. The basis connection between volatile compounds and the nutrient’s vo- latile profiles are defined as the elements of distinct flavors of individual foods. The flavor volatiles are derived from an array of nutrients, including amino acids, etc. Consequently, the ascendancy of the flavor volatiles is from essential nutrients in which it suggests that these flavor volatiles provide major information about the nutritional makeup of individual food item (Goff, S.A. et al., 2006).
Up to now, shrimp flavor research has made great progress. Crustacean meat is composed mainly of volatile alcohols, furyl, carbonyl compounds, nitrogen compounds, sulfur compounds, hydrocarbons, esters and phenols (J. Tétreault et al., 2013; Thongtham Nalinee et al., 2008; Hau Yin Chung, 1991).
Determination of flavour compounds are commonly used through the methods of UV, IR, GC, LC, LC-MS, and NMR. Recently, GC-MS analysis in the field of flavor occupies the most important dominance. Moreover, MS’s advantage includes GC separation that can provide the best performance and the identification of unknown compounds. In our previous studies, a modified headspace SPME method was developed for the analysis of flavor volatiles (Mjos S.A. et al., 2006; Wierda R.L. et al., 2006; Edirisinghe R.KB. et al., 2007). Therefore, this study investigates gas chromatography – mass spectrometry method.
By measuring the different time for cooking the flavor substances in the red shrimps, this article determines the best steamed time for the processing flavor substances of red shrimp and provides a theoretical basis for pre-cooking red shrimp.
Materials and methods
Instruments and materials
Electronic balance was supplied by Mettler-Toledo Instruments Co., Ltd. Thermo Trace DSQII gas chromatography – mass spectrometry was purchased from Thermo Fisher company, U.S. Hitachi L-8800 high speed amino acid analyzer was acquired from Japan's Hitachi. All the chemical agents used were of analytical grade. Red shrimps fished in the East China Sea were frozen under –30 °C and transported to the laboratory within 30 min.
Sample preparation
Red shrimps were rinsed by tap water to remove impurities. Red shrimps were divided into three groups and steamed separately at a temperature of 100 °C for 15 min, 20 min, and 25 min. After cooling to room temperature, the prawn and shrimp heads were removed. Afterwards, the shrimps were taken out, minced with a paste mixer and stored the rest at –20 °C in the Samsung refrigerator.
SPME procedure
According to previous studies, 4 g sample was introduced into a hermetically sealed 15 mL vial. The vial was placed in the sample tray where it was heated at 55 °C for 20 min. After this equilibrium time, the CAR/PDMS SPME fiber was inserted into the headspace of the sample and held there for 30 min at 55 °C, then GC-MS (Thermo Trace DSQ II) was used to analyze afterwards (Duflos G et al., 2010).
GC-MS procedure
The electron impact of MS conditions were as follows: temperature of interface, 250 °C; ionization voltage, 70 eV; mass range, m/z 33–450; and scan speed, 250 Hz per 0.5 s. All experiments were performed in triplicate.
Analysis of amino acids
Adopted Hitachi is an instrument that automatically analyzes amino acid. It is function accurately to claim and fetch dry the weighted permanent sample by dry powder ration. Added 6NHCL solution and afterward continue the process of hydrolysis for 22 ~ 24 hours in 110 °C filters. Filtrated the solutions at low steaming temperature and dissolved the filtrates among the water at a certain amount then diluted to certain density and reserved the solution. The amount of solution that was approximately used in the machine is 50 ul. All of the experiments that were performed in triplicate resolution.
Compound Identification
Volatile compounds were identified by matching their mass spectra with Mass Spectral of the National Institute of Standards and Technology (NIST 2.0).The results from the volatile analyses were provided in chromatographic peak area counts whereas no external or internal standards were used in the present work.
Results and discussion
Because of the acid hydrolysis of protein in this experiment, it does not however causes racemization to get the L-amino acid but it of course destroyed almost all the present tryptophan by the acid. In addition, hydroxy amino acids such as serine, threonine and tyrosine, etc. may also be decomposed in a small part by acid. Hydrolysis from glutamine and aspartic acid was reacted to convert to the corresponding amide group of the amino acid.
Table1 shows the highest Total amino acid (except tryptophan) (TAA) 28.89 g/100 g in the group of labeled for 20 min steaming of red shrimp muscle; followed by steaming 15min group of 28.05 g/100 g; and steaming 25 min amino acid group in which it has the least content of 24.69 g/100 g. There are 16 kinds of amino acids measured in red shrimp muscle, including all 8 essential amino acids (EAA). Among these 16 kinds of amino acids, aspartic acid, alanine, glutamic acid and glycine are flavor amino (Spindler M et al., 1984) in which in fact they are occupying approximately 11 to 12 % of the total content of amino acid; however, red shrimp muscle is in short of cystine (CYS). In addition to the 16 kinds of amino acids and the steaming 20 min group of red shrimps, there are 15 types of amino acids’ content greater than the measured content cooked for 15 min and 25 min group of red shrimp samples.
Among the 16 types of amino acids measured in red shrimp muscle, there are three sets of samples that have the highest amino acid concentration of glutamic acid, 5.38 %, 5.56 %, 4.74 %, that are accounting for 19.18 %, 19.25 %, and 19.20 % of total amino acids respectively. Glutamate that is present in the brain, liver and other tissues plays a role of detoxification and is involving in the synthesis process of a variety of biologically active substances. In essential amino acids, three sets of samples have the highest content of lysine, 3.04 %, 3.17 %, 2.69 %, that are accounting for 10.85 %, 10.98 %, 10.91 % of the total amino acids respectively. Then followed by leucine, isoleucine acid; and histidine in which they represent the lowest content were 0.52 %, 0.53 %, 0.46 %, that are accounting for 1.84 % of the total amino acids of three groups samples. Lysine is the first limited amino acid exists in the human milk and cereal protein. Thus, red shrimp can compensate the exact lysine content that are lacked in cereal proteins, thereby it effectively improve the utilization of protein (Sara Barrento et al., 2010). In addition, Table 1 shows the total flavor of amino acid contents ranges from 11 to 13 % in three groups of the red shrimp. Of those, the content of glutamate and aspartate is higher in which it shows the characteristic flavor of amino acid while the content of alanine and glycine is relatively small in which it shows the characteristic of sweet flavor of amino acids and thus lead to the fact that the presence of these amino acids makes red shrimp good flavor.
The essential amino acids in the muscle of red shrimp accounts for about 38% of the total amount of amino acids and the ratio of essential amino acids to non-essential amino acid is about 61 % can both be obtained from Table as well.
According to the ideal model of FAO / WHO, the good quality protein of EAA / TAA was about 40% whereas EAA / NEAA was above 60 % (FAO /WHO /UNU, 1985) and more im- portantly, the composition and the contents of amino acid in red shrimp tend to approach toward the percentages. Therefore, the red shrimp can provide an abundant amount of amino acids to the human body, especially the essential amino acids.
Different cooking time red shrimp flavor analysis
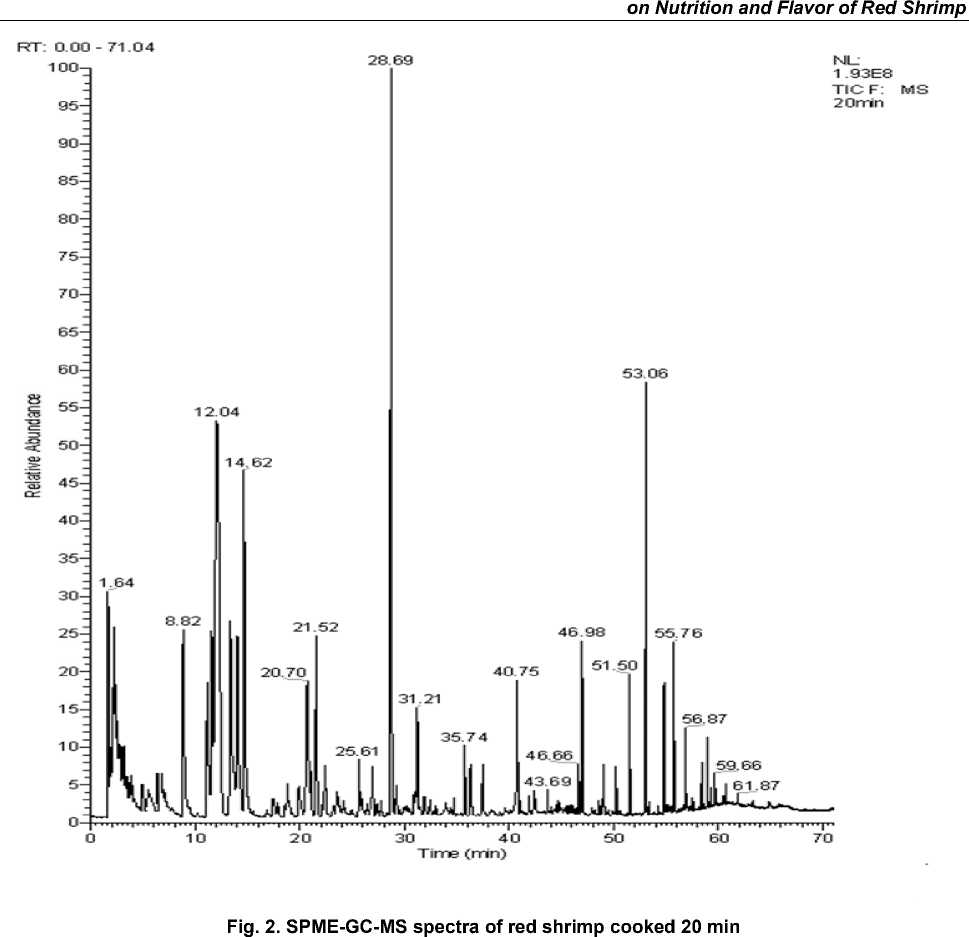
Volatile components were extracted by SPME method from the three groups of red shrimp samples and identified by GC-MS analysis and afterwards each component of peak in MS spectra was searched using NIST2.0 spectral library. The potential results will be compared with the MS standard pattern and combined component peak retention rules to confirm various flavor components. Three samples SPME-GC-MS spectrum was shown in Fig. 1–3.
Red shrimp flavor components
Red shrimp flavor substances include amines, carbonyl compounds, hydrocarbons and alcohols such as 2 – acetyl thiazole, 1 – octen, 3 – ol and straight-chain aldehyde in which they are the representative flavor substances by making the red shrimp unique barbecue and seafood fla-
Table 1
Different cooking time to red shrimp amino acid content
|
Component |
Content (g/100 g) |
Mass percentage % |
||||
|
15 min |
20 min |
25 min |
15 min |
20 min |
25 min |
|
|
Aspartate (ASP)* |
3.9543 |
4.1173 |
3.469 |
14.1 |
14.25 |
14.05 |
|
Alanine (ALA)* |
1.5731 |
1.6117 |
1.4003 |
5.61 |
5.58 |
5.67 |
|
Glutamate (GLU)* |
5.3802 |
5.5614 |
4.7421 |
19.18 |
19.25 |
19.2 |
|
Glycine (GLY)* |
1.6322 |
1.6203 |
1.3996 |
5.82 |
5.61 |
5.67 |
|
Serine (SER) |
0.9991 |
1.0297 |
0.8798 |
3.56 |
3.56 |
3.56 |
|
Arginine (ARG) |
2.2595 |
2.2791 |
1.9588 |
8.05 |
7.89 |
7.93 |
|
Proline (PRO) |
0.7657 |
0.7824 |
0.6804 |
2.73 |
2.71 |
2.76 |
|
Tyrosine (TYR) |
0.888 |
0.9125 |
0.7931 |
3.17 |
3.16 |
3.21 |
|
Histidine (HIS)# |
0.5201 |
0.5292 |
0.4553 |
1.85 |
1.83 |
1.84 |
|
Threonine (THR)# |
0.9494 |
0.9895 |
0.8455 |
3.38 |
3.42 |
3.42 |
|
Valine (VAL)# |
1.1463 |
1.1794 |
1.0158 |
4.09 |
4.08 |
4.11 |
|
Methionine (MET)# |
0.6316 |
0.6453 |
0.546 |
2.25 |
2.23 |
2.21 |
|
Lysine (LYS)# |
3.0439 |
3.1716 |
2.6952 |
10.85 |
10.98 |
10.91 |
|
Isoleucine (ILE)# |
1.2203 |
1.2666 |
1.0827 |
4.35 |
4.38 |
4.38 |
|
Leucine (LEU)# |
1.9911 |
2.0562 |
1.753 |
7.1 |
7.12 |
7.1 |
|
Phenylalanine (PHE)# |
1.0973 |
1.1427 |
0.9766 |
3.91 |
3.95 |
3.95 |
|
Total amino acids |
28.0521 |
28.895 |
24.6932 |
100 |
100 |
100 |
|
The total amount of essential amino acids (EAA) Delicious amino acids |
10.6 |
10.9805 |
9.3701 |
37.78 |
37.99 |
37.92 |
|
12.5398 |
12.9107 |
11.011 |
44.71 |
44.69 |
44.59 |
|
|
EAA/TAA |
37.79 |
38 |
37.95 |
/ |
/ |
/ |
|
EAA/NEAA |
60.74 |
61.29 |
61.15 |
/ |
/ |
/ |
Note: * delicious amino; # essential amino acid; / no computational analysis
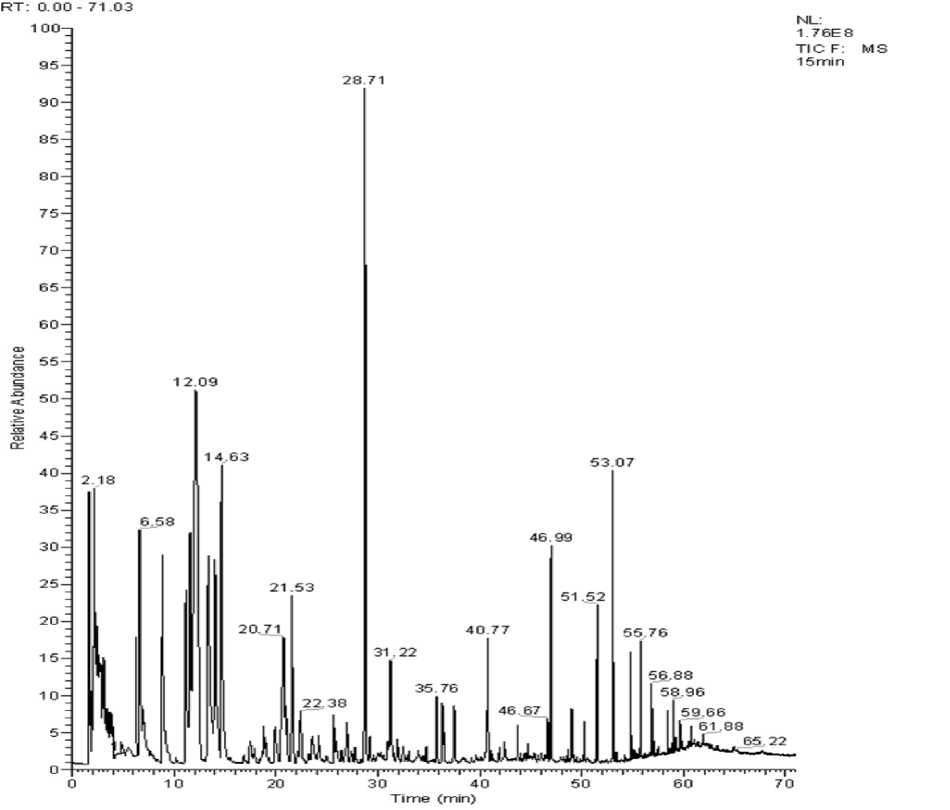
Fig. 1 SPME-GC-MS spectra of red shrimp cooked 15 min
vors. From the figure, the three groups of red shrimp sample spectrum is basically the same as the flavor components of the red shrimp can be constituted through the identification and analysis of substances in which these peaks such as.
Determination of Volatile Compounds shrimp results
In Fig. 1–3, the total ion chromatogram of the three groups of volatile constituents of red shrimp steaming cook timed for 15 min, 20 min and 25 min. The peak area of the volatile components is seen in Table 2. Fig. 1–3 shows the total ion of the current shrimp is consistent. In Table 2, 73 kinds of volatile components are obtained from flesh in which 29 kinds are in the same composition. The red shrimp cooked for 20min has the highest content of volatile substances, 15 min samples do less, and the 25 min samples get the minimum. The main active volatile constitu- ents are hydrocarbons, ketones, aldehydes, esters and sulfur in which it contains compounds such as nitrogen compounds as well. In addition, hydrocarbons, aldehydes chemicals and silicon compounds are at higher levels, representing 18.38, 13.19, 15.97, 30.43, 27.76, 27.86 and 36.39 %; 41.12, 40.59 % of total volatile compounds of the three group red shrimp samples respectively. In these three substances, the silicon is containing compounds account for the largest proportion in which it mainly consisting of octamethyl siloxane, eighteen methyl siloxane ring azelaic, etc. These substances slightly affect the flavor of red shrimp while aldehydes have much influence on the red shrimp flavor substances.
Shrimp of sulfur, nitrogen compounds characteristic flavor
According to the flavor characteristics and contents, sulfur-containing heterocyclic com-
pounds are the main component of meat flavor. However, it is also an important volatile component of the marine crustacean fish. All 3 samples of red shrimps contain 2 – acetyl thiazole in which is identified in the boiled shrimp served as an important volatile sulfur component with a roast beef flavor resulted from the thermal degradation of sulfur amino acids during the heating and its structure is very stable (Kikue Kubota et al, 1980). In the third group of sample (ie cooking 25 min), the highest content may be associated with higher methionine contained in shrimp. Meanwhile, the third group of samples does not contain methyl mercaptan components as other two groups do.
A large number of nitrogen-containing compounds are detected in the three samples in a total of 13 species of which Trimethylpyrazine is the product of the lipid oxidation in the Maillard reaction with a roasted meat that has great effects on the flavor of the shrimp (M.S. Brewer, 2009). Taurine (2 – amino-ethanesulfonic acid) is widely present in sulfur-containing amino acids in fish. The cleavage of amino acid residues facilitates the formation of pyrazine compounds during heating and resulted as a rich meat flavor of shrimp. Nitrogenous substances, N'-ethyl-N, N'-dimethyl ethylenediamine, N-benzyl-2 – phenylethylamine and N-methyl acetamide have a great contribution to the shrimp flavor (Shengying Zhou et al, 1999).
The flavor characteristics of alcohols in shrimp
The alcohol compound detected is mainly 1-octen-3- ol (unsaturated alcohol) and saturated alcohols such as ethanol and octanol. Generally,
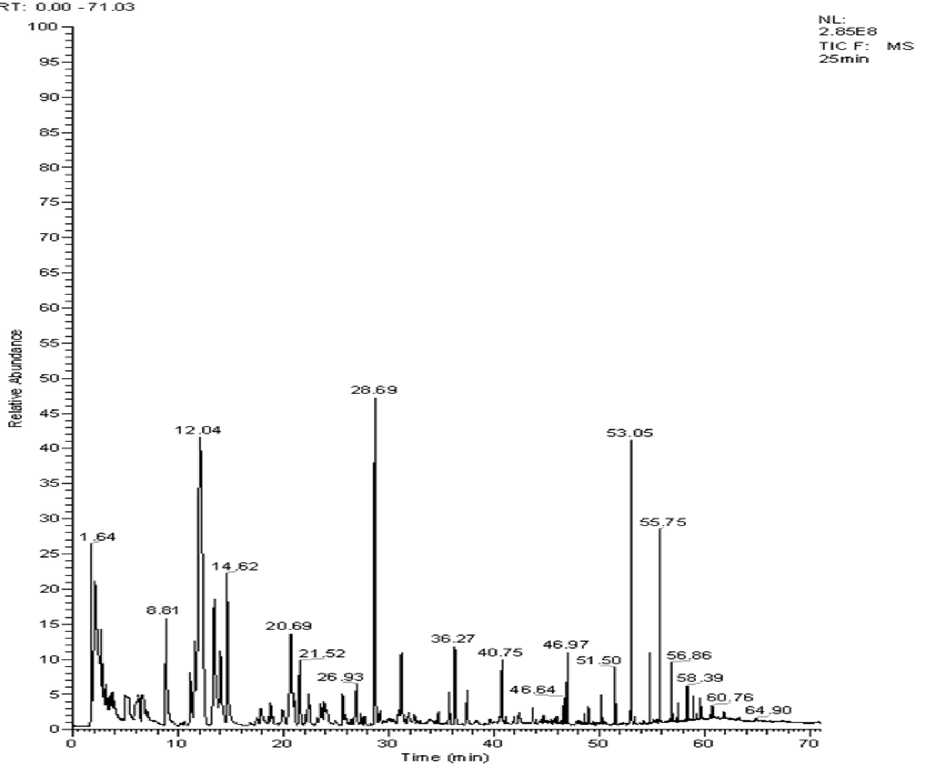
Fig. 3. SPME-GC-MS spectra of red shrimp cooked 25 min
alcohol belongs to high threshold compounds, contributing little to flavor. In the detection of alcohols, the 1-octen-3-ol is shared by the three samples in which is a linoleic acid hydroperoxide degradation product that is the showing similar aroma to mushrooms, existing in volatile flavor substances of shrimp (Donald S et al., 1998). Saturated alcohols may be produced by decomposition of the fat oxidation in the heating process or a carbon-based compound that is reduced to be an alcohol due to their relative high threshold value unless they are present in high concentrations; they make small contribution to flavor.
The shrimp flavor characteristics carbonyl compounds
Aldehyde content in the red shrimp is high, accounting for 32.83, 29.79, 32.65 % of volatile components respectively. Particularly the pentan-al, hexanal, heptyl, octyl aldehyde, nonanal and decanal occupy such a large proportion that is usually showing some unpleasant grassy and spi- cy pungent odor. In addition, their threshold is very low that imply them a role in the generation of the red shrimp’s smell. Generally, it is believed that the aquatic unsaturated fatty acids were oxidized by the action of oxygen and thus degraded to generate short-chain saturated and unsaturated aldehydes in which it has been confirmed that hexanal is the main product of degradation of ω6-fatty acids peroxides where octyl aldehyde and nonyl aldehyde are acid oxidation products (Kikue Kubota et al., 1980). Ketones mainly show eucalyptus leaves taste, fat flavor and burning coke taste; however, the influence from the shrimp odor is relatively small. The difference between the different flavors of meat mainly stems from qualitative and quantitative is carbonyl compounds; therefore, ketone compounds remain some of its impact on the flavor formation of meat (Shengying Zhou et al., 1999). Ketones mainly enhance the right flavor of substances because their presence can enhance or
Table 2
|
Number |
RT/min |
Category |
Peak area (%) |
||
|
15 min |
20 min |
25 min |
|||
|
1 |
1.89 |
Alcohols Ethanol |
0.25 |
– |
– |
|
2 |
18.77 |
1-octen-3-ol |
0.37 |
0.33 |
0.42 |
|
3 |
25.63 |
Octanol |
0.63 |
– |
– |
|
4 |
3.79 |
Aldehydes 3-methylbutanal |
1.25 0.35 |
0.33 0.23 |
0.42 0.29 |
|
5 |
3.95 |
2-methylbutyraldehyde |
0.22 |
– |
0.21 |
|
6 |
4.89 |
Valeraldehyde |
2.42 |
1.35 |
2.13 |
|
7 |
8.81 |
Hexanal |
2.57 |
2.24 |
2.17 |
|
8 |
14.62 |
Heptaldehyde |
3.75 |
4.22 |
3.41 |
|
9 |
21.51 |
Octanal |
2.14 |
2.29 |
1.39 |
|
10 |
27.7 |
2-methyl Undecanal |
– |
– |
0.24 |
|
11 |
28.69 |
Nonanal |
8.71 |
9.74 |
7.67 |
|
12 |
35.76 |
Decanal |
0.86 |
0.92 |
0.71 |
|
13 |
41.92 |
Positive Undecanal |
0.17 |
0.2 |
– |
|
14 |
2.12 |
Ketones Acetone |
21.19 – |
21.19 – |
18.22 0.23 |
|
15 |
20.98 |
6-methyl-5-hept-ene-2-one |
0.45 |
0.32 |
0.43 |
|
16 |
27.72 |
2-Nonanone |
0.22 |
0.22 |
– |
|
17 |
34.71 |
2-decanone |
0.21 |
0.24 |
0.31 |
|
18 |
36.29 |
2,6,6-trimethyl-2-cyclohexene-1 ,4-dione |
0.66 |
0.62 |
1.78 |
|
19 |
41.09 |
2-undecanone |
0.13 |
0.15 |
0.16 |
|
20 |
48.59 |
6,10-dimethyl-5,9-undecadiene-2-ketone |
– |
– |
0.22 |
|
21 |
2.98 |
Esters Ethyl acetate |
1.67 0.67 |
1.55 0.26 |
3.13 0.21 |
|
22 |
6.97 |
Phenyl ethyl carbamate ester |
– |
– |
0.16 |
|
23 |
13.3 |
4-ethyl hexyl benzoate |
– |
2.3 |
– |
|
24 |
22.09 |
Methyl phenyl carbamate |
0.12 |
0.12 |
– |
|
25 |
57.02 |
Dichloro-2-ethyl hexyl acrylate |
0.21 |
– |
– |
|
26 |
59.57 |
Palmitate |
– |
0.1 |
– |
|
27 |
1.64 |
Nitrogen compounds Alanine |
1 2.16 |
2.78 1.42 |
0.37 1.95 |
|
28 |
1.95 |
N, N, N'-trimethyl-ethylenediamine |
– |
– |
1.92 |
|
29 |
22.38 |
5'-amino-5'-deoxyadenosine |
0.81 |
– |
– |
|
30 |
23.84 |
Trimethylpyrazine |
– |
– |
0.34 |
|
31 |
26.93 |
1-nitro-hexane |
0.45 |
0.56 |
0.83 |
|
32 |
46.01 |
Indole |
– |
0.11 |
– |
|
33 |
1.82 |
Sulfur compounds Methyl mercaptan |
3.42 – |
2.09 – |
5.04 0.13 |
|
34 |
27.35 |
2-acetyl thiazole |
0.18 |
0.23 |
0.27 |
|
35 |
3.43 |
Hydrocarbons 2-methyl-2-hexene |
0.18 0.28 |
0.23 – |
0.4 – |
|
36 |
3.45 |
2-heptene |
– |
– |
0.22 |
|
37 |
3.65 |
Benzene |
0.31 |
0.14 |
0.21 |
|
38 |
6.58 |
Toluene |
2.98 |
1.66 |
1.3 |
|
39 |
11.13 |
Ethylbenzene |
– |
1.62 |
1.26 |
|
40 |
13.99 |
Styrene |
– |
1.93 |
1.24 |
|
41 |
17.42 |
1-ethyl-2-methyl-benzene |
0.45 |
0.36 |
0.41 |
Table 2 (End)
|
Number |
RT/min |
Category |
Peak area (%) |
||
|
15 min |
20 min |
25 min |
|||
|
42 |
18.98 |
1,2,3-trimethylbenzene |
0.14 |
– |
0.3 |
|
43 |
19.86 |
1,2,4-trimethylbenzene |
0.48 |
0.15 |
0.36 |
|
44 |
25.6 |
Pentyl cyclopropane |
– |
0.7 |
0.7 |
|
45 |
26.43 |
1-ethyl-2 ,3-dimethylbenzene |
0.2 |
0.18 |
0.3 |
|
46 |
29.18 |
1,2,3,5-tetramethyl benzene |
– |
0.4 |
0.34 |
|
47 |
31.88 |
1,2,3,4-tetramethyl benzene |
0.29 |
0.23 |
– |
|
48 |
32.44 |
4-vinyl-1,2-dimethyl |
– |
0.21 |
0.24 |
|
49 |
36.49 |
Tridecane |
0.23 |
– |
– |
|
50 |
37.45 |
Naphthalene |
0.79 |
0.71 |
0.82 |
|
51 |
42.35 |
N-tetradecane |
0.2 |
0.27 |
0.21 |
|
52 |
43.69 |
1-methylnaphthalene |
0.39 |
0.26 |
0.32 |
|
53 |
44.71 |
2-methylnaphthalene |
– |
0.14 |
0.16 |
|
54 |
46.67 |
Pentadecane |
0.42 |
0.5 |
– |
|
55 |
50.23 |
Butylated hydroxytoluene |
0.39 |
0.46 |
0.49 |
|
56 |
53.37 |
Heptadecane |
0.42 |
0.15 |
– |
|
7.97 |
10.07 |
8.88 |
|||
|
Total amount |
36.68 |
38.24 |
36.46 |
||
Note: "–" means not detected.
References Effect of GS-MS on different steaming time on nutrition and flavor of red shrimp
- Aoi W, Naito Y, Sakuma K, et a1. Aataxanthin limits exercise-induced skeletal and cardiac muscle damage in mice.Antioxid Redox Signal, 2003, 5(1): 139-144.
- Hussein G, Nakamura M,Zhao Q, et a1. Antihypertensive and neuroprotetive effects of astaxanthin in experimental animals. BiolPharm Bull, 2005, 28(1): 47-52.
- Ohgami K, Shiratori K, Kotake S, et al. Effects of astaxanthin on lipopolysaccharide-induced inflammation in vitro and in vivo. Invest Ophthmo1 Vis Sci, 2003, 44(6): 2694-2701.
- Chew BP, Wang MW, Park JS.et al. Dietary β-carotene and astaxanthin but not canthaxanthin stimulate splenocyte function in mice . Anticoncer Res, 1999, 19(6B): 5223-5227.
- Lignell A.Medicament for improvement of duration of muscle function or treatment of muscle disorders or diseases . Patent Cooperation Treaty application, 1991, 1:251.
- Jyonouchi H, Sun S, Gross MD. Astaxanthin, a carotenoid without vitamin a activity augments antibody responses in cultures including T-helper cell clones an d suboptimal doses of antigen . Nutr, 1995, 125(10): 2483.
- Hussein G, Nakamura M, Zhao Q, et a1. Antihypertensive and neuroprotetive effects of astaxan-thin in experimental animals . Biol Pharm Bull, 2005, 28(1): 47-52.
- Naito Y, Uchiyama K, Aoi W, et al. Prevention of diabetic nephropathy by treatment wit astaxanthin in diabetic db/db mice . Biofactors, 2004, 20(1): 49-59.
- Uchivama K, Naito Y, Hasegawa G, et a1. Astaxanthin protects betacells against gIucose toxicity in diabetic db/db mice . Redox Rop, 2002, 7(5): 290-293.
- Jyonouchi H, Sun S, lijima K, et al. Antitumor activity of astaxanthin and its mode of action . Nutr cancern, 2000, 36(1): 59-65.
- Lyons NM, O′Brien NM.Modulatory effects of an algal extract containing astaxanthin onUVA-irradiated cells in culure . J Dermatol Sci, 2002, 30(1): 73-84.
- Kurihara H, Koda H, Asami S, et al. Contribufion of the antioxidative property of astaxanthin to its protective effect on the promotion of cancer metastasis in mice treated with restraint stress . Life Sci, 2002, 70(21): 2509-2520.
- Verbeke, W., & Viaene J. Beliefs, attitude and behaviour towards fresh meat consumption in Belgium: empirical evidence from a consumer survey. Food, Quality and Preference, 1999, 10: 437-445.
- K. Raesa, A. Balcaena, P. Dirinckb, A. De Winneb, E. Claeysa, D. Demeyera and S. De Smet Meat quality, fatty acid composition and flavour analysis in Belgian retail beef.Meat Science, 2003, 4:65-68.
- Linforth, R.S., Taylor, A.J., Measurement of volatile release in the mouth . Food Chemistry 1993, 48: 115-120.
- Goff, S.A., Klee, H.J. Plants volatile compounds: sensory cues for health and nutritional value , Science 2006, 311:815-819.
- J. Tétreault, A.-L. Dupont, P. Bégin; S. Paris. The impact of volatile compounds released by paper on cellulose degradation in ambient hygrothermal conditions . Polymer Degradation and Stability, 2013, 98:1827-1837.
- Uraiwan Tanchotikul, Thomas C.-Y. Hsieh, Analysis of Volatile Flavor Components in Steamed Rangia Clam by Dynamic Headspace Sampling and Simultaneous Distillation and Extraction , Journal of Food Science, 1991, 56(2): 327-331.
- Hau Yin Chung. Volatile Components in Crabmeats of Charybdis feriatus. Journal of Agriculturaland Food Chemistry , 1999, 47: 2280-2287.
- Mjos S A, Solvang M, Patterns in volatile components over heated fish powders . Food Research International , 2006, 39(2): 190-202.
- WierdaR L, Fletcher G, et al. Analysis of volatile compounds as spoilage indicators in fresh king salmon (Oncorhynchustshawytscha) during storage using SPME-GC-MS . Journal of Agricultural and Food Chemistry, 2006, 54(22): 8480-8490.
- Edirisinghe R.KB, Graffamaj, Taylor S.J. Characterization of the volatiles of yellowfin tuna (Thunnus albacares) during storage by solid phase microextraction and GC-MS and their relationship to fish quality parameters , International Journal of Food Science and Technology, 2007, 42(10): 1139-1147.
- Duflos G;Leduc F;N'guessan A;Krzewinski F;Kol O;Malle P. Freshness characterization of whiting (Merlangius merlangus) using an SPME/GC/MS method and a statistical multivariate approach ., Sci Food Agric. 2010, 90(15): 2568.
- Spindler M,Stadler R,Tanner H. Amino acid analysis of feedstuffs:Determination of methionine and cystine after oxidation with perform in acid and hydrolysis. J Agric Food Chem, 1984, 32:1366-1371.
- Sara Barrento, Antonio Marques, Barbara Teixeira. Chemical composition, cholesterol, fatty acid and amino acid in two populations of brown crab Cancer pagurus: Ecological and human health implications . Journal of Food Composition and Analysis, 2010 (23): 716-725.
