
Enhanced Technique to Find Diabetic Retinopathy
Journal: International Journal of Engineering and Manufacturing @ijem
Article in issue: 4 vol.16, 2026.
Free access
Visual perception relies on the retina, which converts incoming light into interpretable neural information. Diabetic retinopathy (DR), a complication arising from prolonged hyperglycemia, is a major contributor to progressive vision impairment and often remains undetected during its initial stages. The condition manifests in retinal imagery through distinct patterns, including high-intensity and low-intensity lesion regions such as exudates and hemorrhages. This paper proposes an automated framework for simultaneous identification of multiple lesion types in retinal fundus images. The approach begins with image refinement to improve visual quality, followed by intensity-driven segmentation to ex-tract candidate abnormal regions. Descriptive statistical measures—namely mean intensity, variance, standard deviation, and entropy—are computed to characterize these regions and are subsequently utilized as inputs to an Artificial Neural Network (ANN) for classification. To enhance reliability, the method incorporates mechanisms to exclude anatomically similar structures, particularly the optic disc and vascular components, thereby reducing false detections. Evaluation results confirm that the proposed system achieves effective separation between normal and pathological cases, indicating its potential utility in supporting early-stage screening of diabetic retinopathy.
Short address: https://sciup.org/15020580
IDS: 15020580 | DOI: 10.5815/ijem.2026.04.08
Text of the scientific article Enhanced Technique to Find Diabetic Retinopathy
The retina is an essential part of the visual system that converts incoming light into neural signals for interpretation by the brain. Any structural or functional damage to the retina can lead to significant visual impairment. Among various retinal disorders, diabetic retinopathy (DR), glaucoma, and age-related macular degeneration are leading causes of vision loss. In particular, diabetic retinopathy has become a major global health concern due to the increasing prevalence of diabetes [1, 10].
Diabetes mellitus is a chronic metabolic condition characterized by persistently elevated blood glucose levels. Over time, prolonged hyperglycemia damages blood vessels, including those within the retina. In DR, these vascular changes result in leakage, blockage, and abnormal vessel growth, which may eventually lead to vision deterioration. One of the key challenges associated with DR is that it often progresses without noticeable symptoms in its early stages, making timely diagnosis difficult.
This work is open access and licensed under the Creative Commons CC BY 4.0 License.
As illustrated in Fig. 1(a), light entering the eye is focused onto the retina, where it is processed and transmitted through the optic nerve. The retinal structure, shown in Fig. 1(b), includes important components such as the macula, fovea, optic disc, and vascular network, all of which contribute to visual perception.
Diabetic retinopathy progresses through multiple stages, including mild, moderate, and severe non-proliferative stages, followed by proliferative retinopathy. Early manifestations include microaneurysms, while advanced stages involve vessel occlusion and the formation of fragile new blood vessels that are prone to rupture. From an image analysis perspective, diabetic Retinopathy can be identified by features such as exudates, hemorrhages, microaneurysms, and cotton wool spots, as shown in Fig. 2. These features exhibit variations in intensity, color, and texture, making automated detection feasible but challenging.
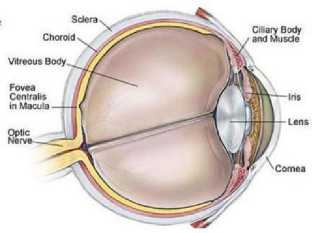
(a) Sagittal section of the human eye
Fig. 1. (a) Sagittal section of the human eye (b) Structure of the retina
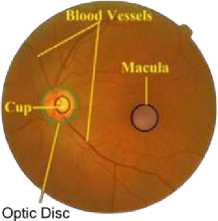
(b) Parts of retina
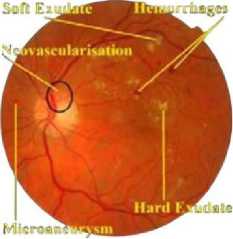
Fig. 2. Example of retinal abnormality
Conventional diagnostic methods such as fundus photography, optical coherence tomography (OCT), and fluorescein angiography are widely used for retinal examination [2, 6]. Although effective, these methods rely heavily on expert interpretation and are not well-suited for large-scale screening.
Recent advances in image processing and machine learning have enabled the development of automated systems for retinal analysis [3, 5]. However, many existing approaches focus on detecting a single type of lesion and are affected by challenges such as noise, artifacts, and similarity between pathological and normal structures.
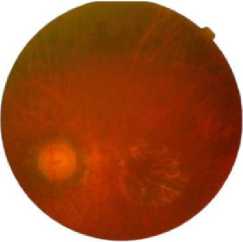
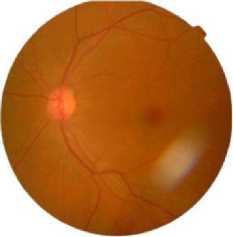
A major difficulty arises from the presence of regions that visually resemble pathological features but are not clinically relevant. As shown in Fig. 3(a), certain retinal areas exhibit intensity patterns similar to exudates, while Fig. 3(b) presents imaging artifacts that may be incorrectly identified as lesions. Such misleading patterns can reduce the reliability of automated systems if not properly addressed.
(a) Region resembling exudates
Fig. 3. Examples of misleading retinal patterns: (a) region similar to exudates, (b) imaging artifact
(b) Imaging artifact
To overcome the identified challenges, the present work introduces an automated method for detecting both exudates and hemorrhages using pixel intensity-based analysis. The proposed framework integrates preprocessing, segmentation, feature extraction, and Artificial Neural Network (ANN) classification to improve detection accuracy and robustness.
2. Proposed Methodology
The proposed framework is organized into four sequential stages: preprocessing, segmentation, feature extraction, and classification, as illustrated in Fig. 4.
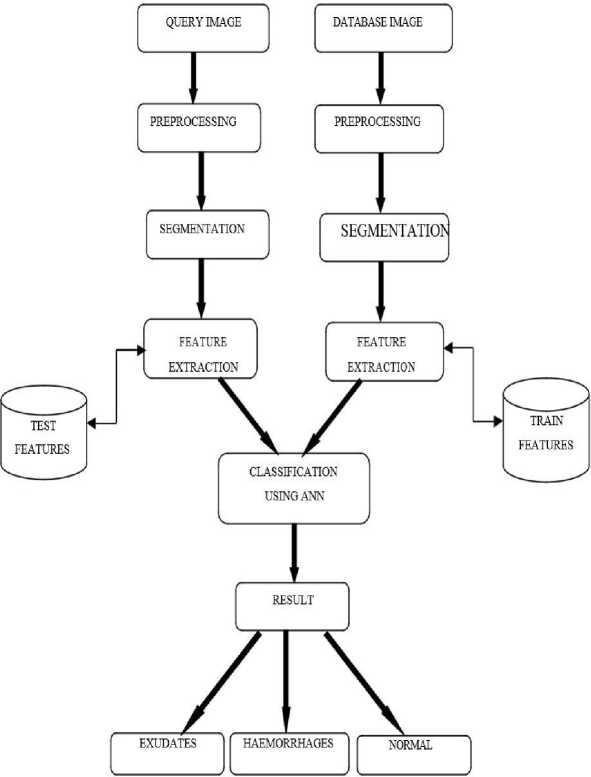
Fig 4. Overview of the proposed methodology
-
2.1. Algorithm
-
2.1.1. Preprocessing
This section describes the procedure adopted for detecting exudates and haemorrhages in retinal fundus images.
Preprocessing plays an important role in improving image quality prior to lesion detection. Retinal images often exhibit low contrast and noise, which may reduce detection accuracy. Therefore, enhancement operations are applied to improve the visibility of relevant structures.
Initially, the green channel is extracted from the RGB image, as it provides superior contrast between lesions and the background compared to the red and blue channels.
Image Enhancement: To enhance visual clarity, contrast enhancement and noise reduction techniques are applied.
-
• Contrast Adjustment: Pixel intensities are rescaled to improve differentiation between low and high intensity regions, thereby enhancing lesion visibility.
-
• Noise Removal: Median filtering is applied to suppress impulse noise while preserving edge information. Each pixel is replaced with the median value of its neighborhood.
-
2.1.2. Segmentation
Segmentation is carried out to isolate regions of interest by analyzing pixel intensity variations. Bright lesions such as exudates and dark regions such as haemorrhages are identified using threshold-based methods.
Algorithm 1 Preprocessing of Retinal Image
-
1: Input: Retinal image I
-
2: Output: Preprocessed image I p
-
3: Load image I
-
4: Extract green channel I g
-
5: Apply contrast enhancement
-
6: Perform median filtering
-
7: Return I p
Exudate Detection: Exudates correspond to high-intensity regions within the retinal image. These regions are extracted by applying an upper threshold, where pixels exceeding a predefined value are retained.
I e («= б55
if Ip ( ij )>200 otherwise
Since the optic disc also appears as a bright structure, it may lead to false detection. Therefore, it is identified and excluded before lesion analysis.
Optic Disc Elimination: The optic disc is localized using the Circular Hough Transform. The green channel is processed to enhance contrast, followed by smoothing and edge detection. The circular boundary is detected using:
( x - a )2+(y - b )2= r2
where ( a, b ) denotes the center and r represents the radius. The detected region is masked to eliminate its influence.
Haemorrhage Detection: Haemorrhages appear as low-intensity regions and are extracted using a lower threshold.
Pixels below the specified value are retained to highlight these regions.
I h ( ij )= {
'255, . 0,
if Ip ( ij )<80 otherwise
-
2.1.3. Feature Extraction
Following segmentation, quantitative descriptors are derived to differentiate between normal and abnormal retinal images. These features capture statistical properties of pixel intensity distribution.
The extracted features include mean, standard deviation, variance, and entropy:
-
• Mean ( µ ): Average intensity value
MN
" = MNEZI(ij) (4)
i =1 j =1
-
• Standard Deviation ( σ ): Degree of intensity variation
MN
“ ■ ДEE1^) -^ j i =1 j '1
-
• Variance ( σ 2): Spread of intensity distribution
MN
°2 = MN £Z( I ( ij )- r )2 (6)
=1 j =1
-
• Entropy ( H ): Measure of randomness in the image
-
2.1.4. Classification
L -1
H =- ^Pk log 2 frk) (7)
k=0
where M × N represents the image dimensions and p k denotes the probability of intensity levels.
An Artificial Neural Network (ANN) is employed to classify retinal images into exudates, haemorrhages, and normal categories based on the extracted features.
A feed-forward neural network (FFNN) is selected due to its ability to model nonlinear relationships between input features. The input layer consists of four neurons corresponding to the extracted statistical features.
Hidden layer
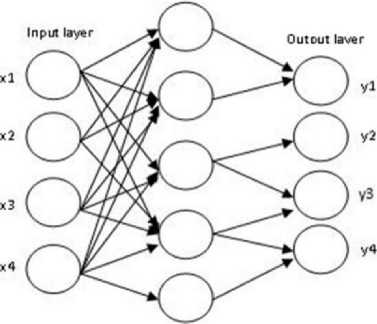
Fig. 5. Feed-forward neural network architecture
The neuron output is computed as:
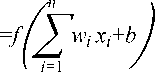
where x i are input features, w i are weights, b is bias, and f ( · ) represents the activation function.
Training Phase: The network is trained using labeled retinal images. During this phase, model parameters are iteratively updated to minimize classification error.
Algorithm 2 ANN Training Procedure
Testing Phase: In the testing stage, unseen retinal images are processed and classified using the trained model.
Algorithm 3 ANN Testing Procedure
1: Input: Test image I, trained model N
2: Output: Predicted class C
3: Extract features from I
4: Apply trained model N
5: Obtain class label C
6: Return C
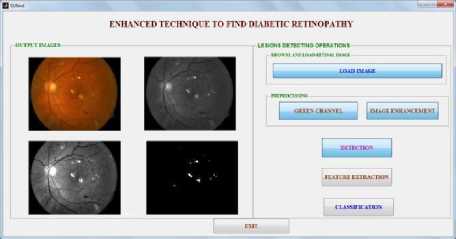
3. Results and Discussion3.1. Experimental Results3.1.1. Run 1: Exudates Detection
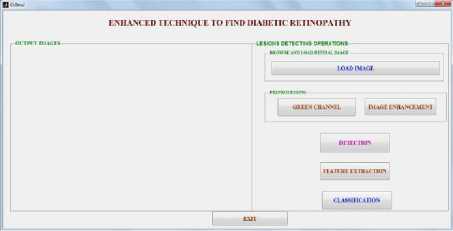
(a) Main Page GUI
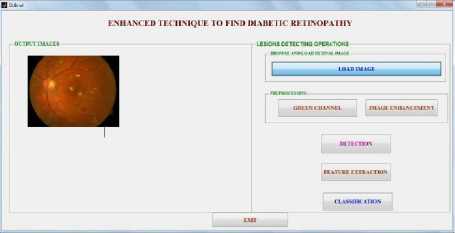
(b) Loading Image
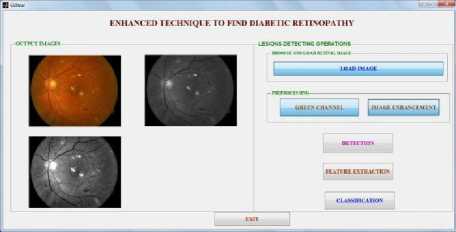
(c) Preprocessing
Fig. 6. Run 1: Exudates Detection Process
(d) Exudates Detection
3.1.2. Run 2: Haemorrhages Detection
(a) Loading Image
(b) Preprocessing
(c) Haemorrhages Detection
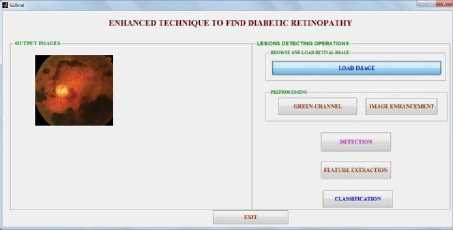
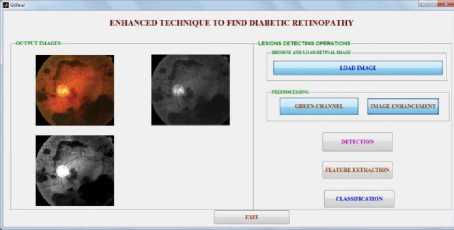
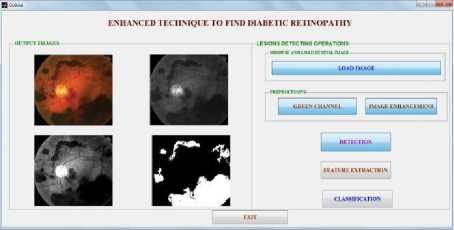
Fig. 7. Run 2: Haemorrhages Detection Process
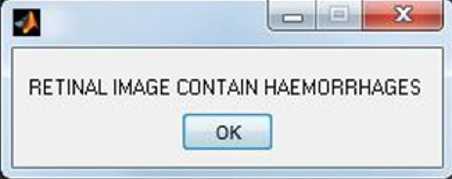
(d) Final Result
The haemorrhage regions are effectively identified, as illustrated in Fig. 7.
3.1.3. Run 3: Normal Image
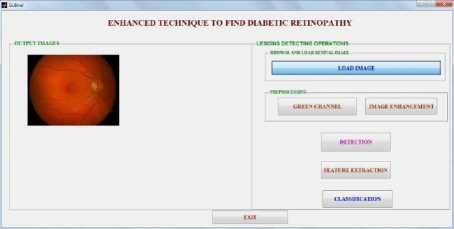
(a) Loading Image
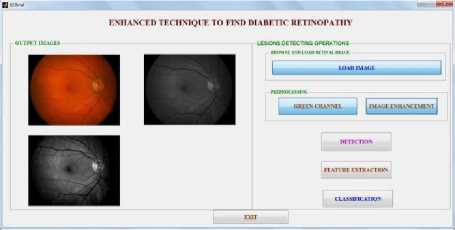
(b) Preprocessing
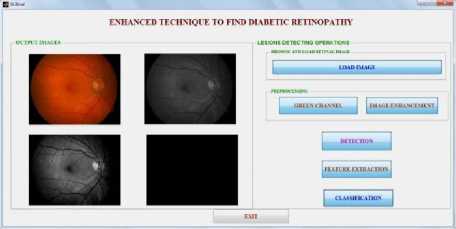
(c) Normal Image
Fig. 8. Run 3: Normal Image Classification
(d) Final Result
3.2. Performance Evaluation3.2.1. Classification Performance
3.2.2. Confusion Matrix Analysis
This section presents the experimental results of the proposed diabetic retinopathy detection system. The system classifies retinal images into three categories: Exudates, Haemorrhages, and Normal.
A dataset of retinal fundus images was used. Each image undergoes preprocessing to enhance contrast and remove noise, followed by segmentation to extract affected regions. Statistical features such as mean, standard deviation, variance, and entropy are extracted and fed into an Artificial Neural Network (ANN) classifier.
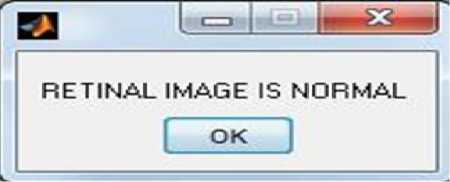
The classifier correctly identifies normal retinal images (Fig. 8).
Table 1. Classification Performance of the Proposed System
|
Class |
Precision |
Recall |
Accuracy |
|
Exudates |
0.92 |
0.90 |
0.91 |
|
Haemorrhages |
0.89 |
0.88 |
0.88 |
|
Normal |
0.94 |
0.95 |
0.94 |
Table 2. Confusion Matrix of Classification Results
|
Exudates |
Haemorrhages |
Normal |
|
|
Exudates |
45 |
3 |
2 |
|
Haemorrhages |
4 |
40 |
6 |
|
Normal |
2 |
3 |
50 |
-
3.3. Discussion
-
3.4. Results
The results demonstrate that the proposed ANN-based system effectively detects diabetic retinopathy features. The preprocessing stage enhances image quality, while feature extraction significantly improves classification performance.
From Table 2, it is evident that most samples are correctly classified, with minimal confusion between Exudates and Haemorrhages.
The overall classification accuracy, as presented in Table 1, indicates that the proposed system is reliable and efficient for automated retinal disease detection.
Table 3 presents the statistical features extracted from the retinal images used for evaluation. The proposed system was tested on three categories of images: Exudates, Haemorrhages, and Normal.
In Run 1, an image containing exudates was processed through preprocessing and segmentation stages, where the affected regions were successfully identified. In Run 2, haemorrhage images were analyzed using the same procedure, and the segmented output highlighted haemorrhagic regions. In Run 3, a normal retinal image was processed, resulting in a blank output, indicating the absence of abnormalities.
The extracted features include mean, standard deviation, variance, and entropy. It is observed that normal images produce negligible values, whereas abnormal images show significant feature variations.
Table 3. Extracted Features of Retinal Images
|
Feature |
Exudates |
Haemorrhages |
Normal |
|
Mean |
0.8413 |
0.2917 |
0 |
|
Std. Deviation |
14.6227 |
0.4546 |
0 |
|
Variance |
213.8222 |
0.2066 |
0 |
|
Entropy |
0.0319 |
0.8710 |
0 |
Fig. 9. shows the graphical representation of the extracted features.
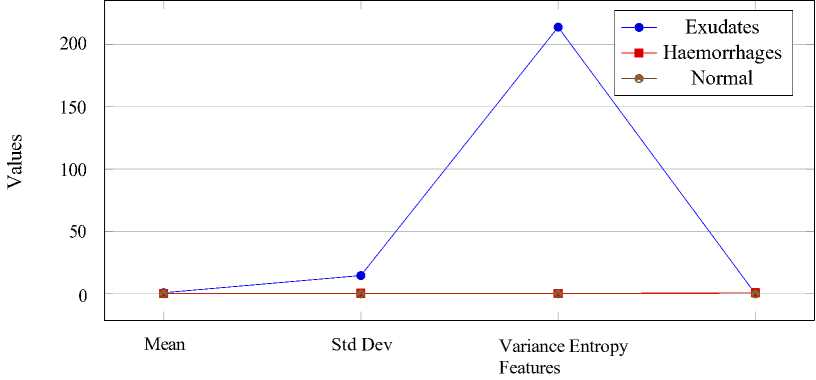
Fig. 9. Graphical representation of extracted features for Exudates, Haemorrhages, and Normal images
It is observed from Fig. 9 that exudate images exhibit higher feature values compared to haemorrhages, while normal images show negligible values. This distinction enables the proposed system to effectively classify different retinal conditions.
4. Conclusion and Future Research Directions
This paper presented an automated method for the detection of exudates and haemorrhages in retinal fundus images. The proposed approach is based on pixel intensity–driven segmentation, enabling effective differentiation between pathological regions and the background. Key challenges, such as the similarity between exudates and the optic disc, as well as haemorrhages and blood vessels, were addressed using structural and geometrical characteristics. The experimental results demonstrate that the proposed system achieves reliable and efficient performance in detecting diabetic retinopathy features.
Despite the promising results, there is scope for further improvement. Future research can focus on the extraction of more discriminative features, including texture and deep features, to enhance classification accuracy. Additionally, the integration of advanced machine learning and deep learning techniques, such as convolutional neural networks, can further improve robustness and generalization. Extending the system to detect other retinal abnormalities, such as microaneurysms and neovascularization, will enable comprehensive diabetic retinopathy screening. The development of a real-time, clinically deployable system also remains an important direction for future work.
All the Declarations and StatementsAuthor Contributions Statement
Dr. Punith Kumar M B: Conceptualization, Methodology, Supervision, Validation, and Project Administration. Conceived the research idea, designed the research methodology, supervised the work, validated the proposed approach, and reviewed the manuscript.
Prashanth Kumar A D: Software, Investigation, Formal Analysis, Data Curation, Visualization, and Writing – Original Draft. Developed the MATLAB-based implementation, performed image preprocessing, segmentation, feature extraction, Artificial Neural Network (ANN) implementation, experimental evaluation, analyzed the results, prepared the figures and tables, and wrote the initial manuscript.
All authors have read and agreed to the published version of the manuscript.
Conflict of Interest Statement
The authors declare that they have no known competing financial interests or personal relationships that could have appeared to influence the work reported in this paper.
Funding Declaration
This research received no external funding.
Data Availability Statement
No publicly available dataset was used in this study. The proposed diabetic retinopathy detection algorithm was implemented and evaluated using MATLAB. The MATLAB source code, sample retinal images used for demonstration, and supporting materials are available from the corresponding author upon reasonable request.
Ethical Declarations
This study did not involve human participants, human tissue, animals, or identifiable personal data. The research focused on the development and evaluation of image processing algorithms using MATLAB. Therefore, ethical approval and informed consent were not required.
Acknowledgments
The authors express their sincere gratitude to the reviewers for their valuable comments and constructive suggestions, which significantly improved the quality of this manuscript. The authors also thank PES College of Engineering, Mandya, Karnataka, India, for providing the facilities, infrastructure, and academic support necessary to carry out this research.
Declaration of Generative AI in Scholarly Writing
During the preparation of this manuscript, the authors used generative Artificial Intelligence (AI) tools only for language improvement, grammar correction, formatting assistance, and enhancing the readability of the manuscript. MATLAB was used exclusively for implementing the proposed algorithms, image processing, feature extraction, Artificial Neural Network (ANN) classification, graphical visualization, and performance evaluation. No AI tool was used to generate the scientific ideas, research methodology, experimental results, data analysis, or conclusions. The authors have carefully reviewed and verified all contents of the manuscript and accept full responsibility for its originality, accuracy, and integrity.
Abbreviations
N/A
Appendix A\B\C…, with appendix tile
N/A
