
Ensemble-Based Modelling for Enhanced Detection of Pneumonia Disease
Journal: International Journal of Engineering and Manufacturing @ijem
Article in issue: 4 vol.16, 2026.
Free access
Pneumonia is a lung condition that is rather prevalent and has the potential to be lethal. The early diagnosis of this disease is absolutely necessary to cut down on the number of fatalities. The aim of this research is to provide a decision-support tool that can help professionals in the field identify cases of pneumonia. The experimental studies used two publicly available datasets in the Kaggle repository. First, experiments were conducted with the pre-trained models. Then, hard and soft voting ensemble learning approaches were implemented using the five most successful deep learning models. According to the results, the soft voting approach outperformed others, with accuracies of 98.55% and 97.26% in two- and three-class datasets, respectively. With this result, a software included this approach has been developed to assist field experts in their decision-making.
Short address: https://sciup.org/15020576
IDS: 15020576 | DOI: 10.5815/ijem.2026.04.04
Text of the scientific article Ensemble-Based Modelling for Enhanced Detection of Pneumonia Disease
Pneumonia which results in lung ulcers [1] is an acute respiratory disease infection caused by viruses and bacteria [2,3]. This disease is one of the leading causes of death worldwide for children [1]. Lung infection causes damage to the pulmonary alveoli, which are tiny, balloon-shaped sacs found at the ends of the bronchioles [3]. Symptoms such as dry cough and chest burning are signs of a weakened immune system in smokers and stroke survivors [4]. Pneumonia's effect on humans can range from mildly uncomfortable to life-threatening. Children under 14, older people over 65, and people with lung problems or a weakened immune system are most at risk [5]. Radiologists manually performed visual inspections. The entire procedure is time-consuming and requires the presence of professional radiologists at all times [6] Computer vision-based tools can provide decision support to field experts, enabling them to make the right decisions early diagnosis and intervention in health. An early diagnosis of pneumonia is crucial for ensuring effective treatment and improving survival chances. The automatic pneumonia diagnosis presents a considerable difficulty, as the symptoms of the condition are sometimes mild and arduous to detect from X-ray scans [7]. This study addresses this issue by presenting a voting approach that comprises several cutting-edge deep learning networks that detect pneumonia disease with high accuracy. In this context, this paper presents a comparison of the performances of hard voting and soft voting approaches. Furthermore, this study presents computer-aided software to assist field experts in making decisions. The identification of pneumonia at an early stage is absolutely necessary in order to stop the course of the disease. It also leads to a reduction in the number of patients and deaths. In light of this, the purpose of this work is to undertake extensive experiments that evaluate the effectiveness of pre-trained deep-learning models on X-ray pictures for the purpose of developing pneumonia detection methods. The main contribution of this study is to propose an ensemble-based modeling for enhanced detection of pneumonia disease with high performance and to develop a user-friendly, helpful application for field experts. In this context, the contributions of the paper are as follows:
-
• Ensemble learning-based modelling was introduced for detecting pneumonia disease.
-
• Comprehensive experiments confirm the proposed model’ effectiveness.
This work is open access and licensed under the Creative Commons CC BY 4.0 License.
• The proposed model employs a soft voting approach, which includes cutting-edge deep learning architectures, to achieve high accuracy.
• The proposed model offers high accuracies on the public two datasets and has potential as a valuable artificial intelligence tool in the medical field.
2. Related Works
3. Material and Method
3.1. Datasets3.2. Deep learning
3.3. Transfer learning
There is a great deal of research that has been published on the subject of pneumonia detection. It has been observed that these studies are mainly based on two or three-class datasets. There is a clear indication that the COVID-19 class is also included in the research that was carried out using three-class datasets, despite the fact that the studies that were carried out with two-class datasets included picture samples that did not contain any pneumonia or illness results. Hu et al. proposed the DenseNet-121 network for pneumonia detection on a two-class dataset containing images with and without pneumonia. They discussed the importance of further research in the medical field to improve classification performance. The authors reported a 96.2% accuracy and 94.3% F1-score with the DenseNet-121 model [8]. Stephen et al. conducted experiments using pre-trained models to detect the presence or absence of pneumonia. The authors reported that data multiplexing operations such as rescaling, horizontal translation, width shift, height shift, and zooming positively affected the success of these models in improving classification performance [9]. Rahman et al. aimed to use deep learning methods to detect pneumonia disease using X-ray images in three two- and three-class datasets, including images of bacterial pneumonia, pneumonia patients, and patients with no signs of disease, in their study. The authors worked with AlexNet, ResNet-18, DenseNet-201, and SqueezeNet, pre-trained convolutional neural network models after the preprocessing datasets. The authors reported that the DenseNet-201 model provided the highest accuracy for each dataset in their experimental studies, and they achieved an average accuracy of 95% with this model [10]. Jain et al. employed convolutional neural networks on X-rays of patients with and without signs of pneumonia to detect pneumonia. The authors trained two models of their own design and commonly used convolutional neural network models, using different parameters and increasing the number of convolutional layers. The authors achieved an accuracy of 92.31% with the second model they developed [11]. Er employed several pre-trained models to extract feature maps from X-ray images and composed hybrid feature maps by combining the features and obtained 98.32% accuracy classification [12]. Ben Atitallah et al. applied the ensemble learning method, including VGG-16, Xception, Inception-V3, ResNet-50, and DenseNet-201 models, to a two-class dataset containing images of people with and without signs of pneumonia for pneumonia disease detection and achieved 97.3% accuracy [13]. In their study, Rai et al. applied a technique to validate the model performance based on the exclusion method on a dataset containing two classes. The authors obtained 87.00% accuracy with the ensemble learning method, including Random Forest, Extreme Gradient Boosting, Extra Decision Tree, and Gradient Boosting [14].
Two datasets, which are publicly available in the Kaggle data repository, are used for hold-out experiments. The current datasets are referred to as Dataset-1 and Dataset-2 in the remainder of this study. Accordingly, 1172 images were allocated as test data, 3747 as training data, and 937 as validation data for hold-out experiments on Dataset-1. In addition, 1388 images were allocated as test data, 4440 as training data, and 1110 as validation data for Dataset-2. Table 1 summarized the about datasets.
Table 1. Statistical information of the datasets
|
Number of samples |
|||||
|
Class |
Training |
Validation |
Test |
||
|
Dataset-1 |
Pneumonia |
2734 |
684 |
855 |
|
|
No-finding |
1013 |
253 |
317 |
||
|
Total |
3747 |
937 |
1172 |
||
|
Dataset-2 |
Pneumonia |
1480 |
370 |
462 |
|
|
No-finding |
1480 |
370 |
463 |
||
|
COVID-19 |
1480 |
370 |
463 |
||
|
Total |
4440 |
1110 |
1388 |
||
Convolutional Neural Networks (CNN), which has hidden layers and neurons, has parameters that can be learned, such as weights, biases, etc. Computer vision is developing rapidly every day with deep learning. CNN designed based on the visual systems of animals is widely used in computer vision studies. These networks incorporate the most widely used deep learning algorithms in computer vision and image processing works. The architecture of convolutional neural networks is designed and built to learn the distinctive features of images in a self-learning and adaptive manner .
Transfer learning is reusing a previously trained model on a different problem dataset. In this approach, a model uses the knowledge gained from a previous task to improve its generalization to another task [26]. After the target task's output layer has been redesigned, the fully connected layers in the classification part are retrained [27 ] .
-
3.4. Ensemble learning
-
3.5. Performance evaluation
Ensemble learning uses a strategy that involves multiple models to assign the final class label to an instance. The voting approach, an ensemble learning, uses the results of multiple base classifiers for the final class prediction. First, the base classifiers are trained separately on the training set. After that, the final prediction of the voting function is carried out by the process. When it comes to hard voting, the class label of an instance is established by using the majority voting method. On the other hand, when it comes to soft voting, the final class label is chosen by taking the maximum average prediction of the classifiers into consideration. In other words, the class having the highest probability of predicting the final class label is regarded as the final predicted class in soft voting. In contrast, in hard voting, the majority voting is considered [28] .
The hold-out method divides the data set into training and test sets. The part allocated for training is used in the training phase of the designed model. The part allocated for the testing is used to validate whether the model performs well on data other than the training set. In the literature, the most common separation ratio when using the hold-out method is 80% of the data set for the training phase and the remaining 20% for the test phase [29]. In machine learning studies, precision, sensitivity, accuracy, and F1 score measurements are commonly used to evaluate the success of the proposed models. The confusion matrix parameters shown in Table 2 are used to calculate these measures [12].
Table 2. Confusion matrix structure for a two-class problem
Predicts
|
Negative |
Positive |
||
|
Actuals |
Negative |
True Negative (TN) |
False Positive (FP) |
|
Positive |
False Negative (FN) |
True Positive (TP) |
|
Here, TP true positive, TN true negative, FN false negative and FP false positive. Accordingly, accuracy metric presents the ratio of the number of samples correctly classified by the classifier to the total number of samples, as shown in Eq. (1). Precision metric provides the percentage of samples that are correctly classified as positive to the total number of samples that are positively classified, as given in Eq. (2). Sensitivity metric represents the percentage of positive samples that are correctly identified out of the total number of positive samples, as shown in Eq. (3). Lastly, F1-score metric indicates the harmonic mean of the precision and sensitivity measures, as shown in Eq. (4).
TP + TN
Accuracy = ———————
TP + FN + TN + FP
TP
Precision = Tp + Fp
Sensitivity = Tp + FN
Pr e cisionxSensitivity
Fl scare Xxr>e c sision SSensitivity(^
In multi-class problems, the interest class is considered positive, and the other classes are considered negative. Accordingly, class-wise measures are conducted using the metrics in Equations 1 to 4. Then the averages of the measurements obtained for each class are calculated using the metrics in Equations 5 to 8.
1 \~^N
AverageAccuracy(AA) = — У A ccuracyt(5)
N £—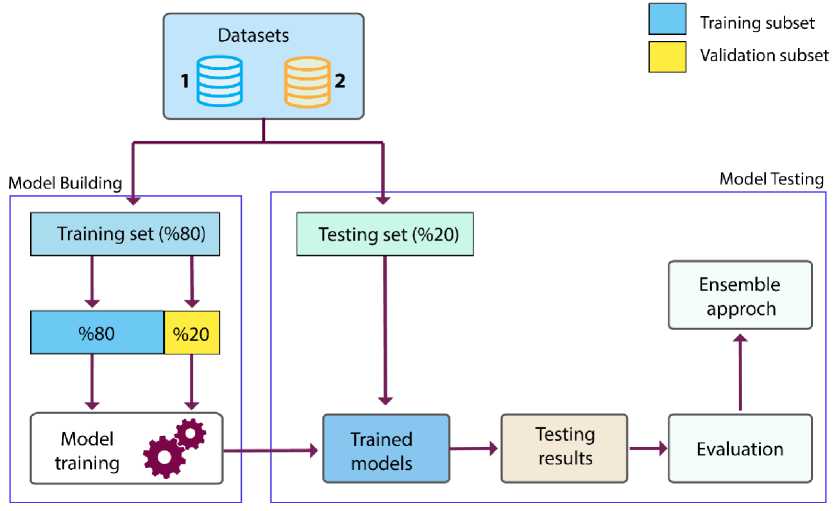
Fig. 1. General block diagram of the proposed study
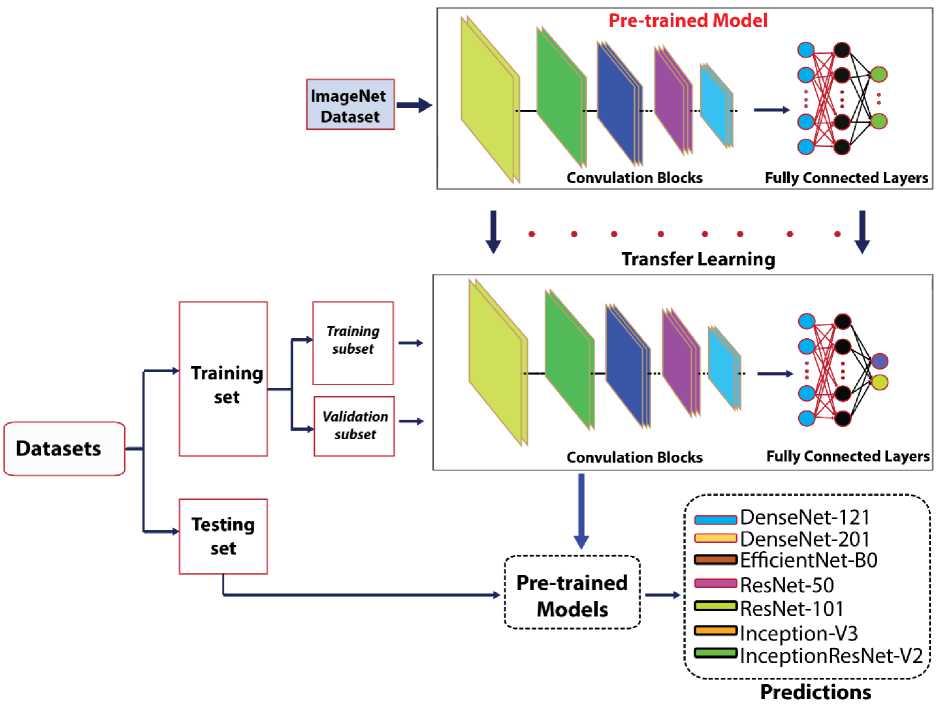
Fig. 2. Graphical abstract of transfer learning approach
Figures 3 and 4 show the accuracy plot of each pre-trained deep learning model on the training and validation set for Dataset-1.
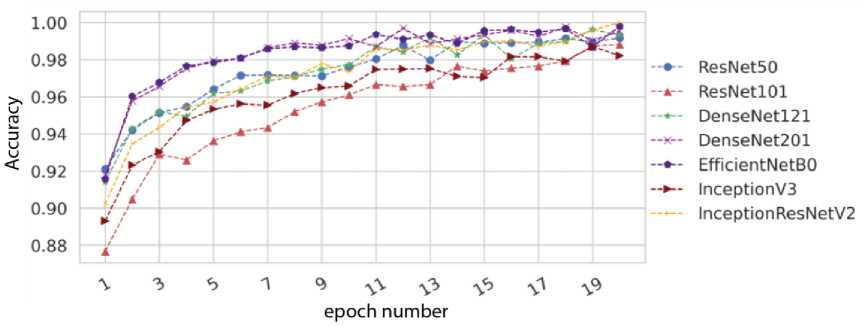
Fig. 3. Accuracy graphs of pre-trained models on the training dataset for Dataset-1
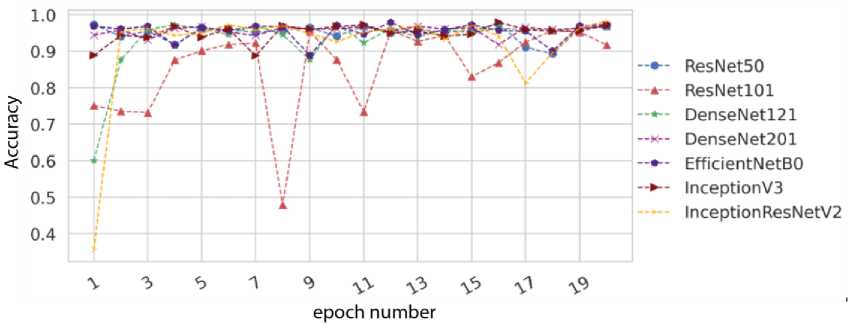
Fig. 4. Accuracy graphs of pre-trained models on the validation dataset for Dataset-1
After training, the performance of each model was calculated using the confusion matrix values of the models. Confusion matrices summarize the correct and incorrect predictions. The confusion matrices of the models for Dataset-1 are shown in Figure 5. Table 3 shows the accuracy, precision, sensitivity, and F1-score values of the models applied to Dataset-1. The accuracy values in bold in this table indicate the five most successful models. Accordingly, the top five most accurate models are ResNet-50, DenseNet-201, Inception-V3, DenseNet-121, and InceptionResNet-V2. These models gave accuracies of 97.95%, 97.87%, 97.7%, 97.7%, and 97.61%, respectively. For the Inception-V3 and DenseNet-121 models with the same accuracy values, the F1 score value was determined as a prioritization criterion.
DenseNet-121
DenseNet-201
ResNet-50
^
X
95.9% 304/317
4.1%
94.3%
299/317
5.7%
1.6%
98.4%
841/855
Predicted
ResNet-101
95.3%
302/317
3.2%
4.7%
96.8% 828/855
0.8%
99.2% 848/855
Predicted
Inception-V3
97.8%
310/317
2,2%
Predicted
i!
2.3%
97.7% 835/855
Predicted
EfficientNet-B0
|
98.1% 311/317 |
1.9% 6 |
|
3.0% |
97.0% |
|
26 |
829/855 |
£
^
Predicted
InceptionResNet-V2
96.2% 305/317
3.8%
'S'
93.7% 297/317
0.5%
6.3%
99.5% 851/855
Predicted
1.9%
98.1% 839/855
^
Predicted
Fig. 5. Confusion matrices of the pre-trained models for Dataset-1 (N: Normal, P: Pneumonia)
Table 3. Experimental results on the Dataset-1
|
Accuracy (%) |
Precision (%) |
Sensitivity (%) |
F1-Score (%) |
|
|
ResNet-50 |
97,95 |
97,7 |
99,53 |
98,61 |
|
ResNet-101 |
96,42 |
98,22 |
96,84 |
97,53 |
|
DenseNet-121 |
97,7 |
98,48 |
98,36 |
98,42 |
|
DenseNet-201 |
97,87 |
97,92 |
99,18 |
98,55 |
|
EfficientNet-B0 |
97,27 |
99,28 |
96,96 |
98,11 |
|
Inception-V3 |
97,7 |
99,17 |
97,66 |
98,41 |
|
InceptionResNet-V2 |
97,61 |
98,59 |
98,13 |
98,36 |
The confusion matrices shown in Figure 6 summarizes the results obtained with the voting ensemble learning approaches, including the five models with the most successful results on Dataset-1.
a)
b)
%
95.6% 303/317
4.4%
0.6%
99.4% 850/855
96.2% 3.8% v 305/317 12
’го
- 0.6%
99.4% 850/855
Predicted
Predicted
Fig. 6. Confusion matrices of voting ensemble learning approaches for Dataset-1; a) hard voting, b) soft voting (N: Normal, P: Pneumonia).
The results obtained by both voting approaches are summarized in Table 4. According to this table, the soft voting approach provided 98.55% accuracy, 98.61% precision, 99.42% sensitivity, and 99.01% F1 score. The hard voting approach gave an accuracy value of 98.38%. Accordingly, the soft voting approach provided the highest accuracy on Dataset-1.
Table 4. Experimental results of voting approaches on the Dataset-1
|
Accuracy (%) |
Precision (%) |
Sensitivity (%) |
F1-Score (%) |
|
|
Hard voting |
98,38 |
98,38 |
99,42 |
98,90 |
|
Soft voting |
98,55 |
98,61 |
99,42 |
99,01 |
-
4.3.2. Dataset-2 results
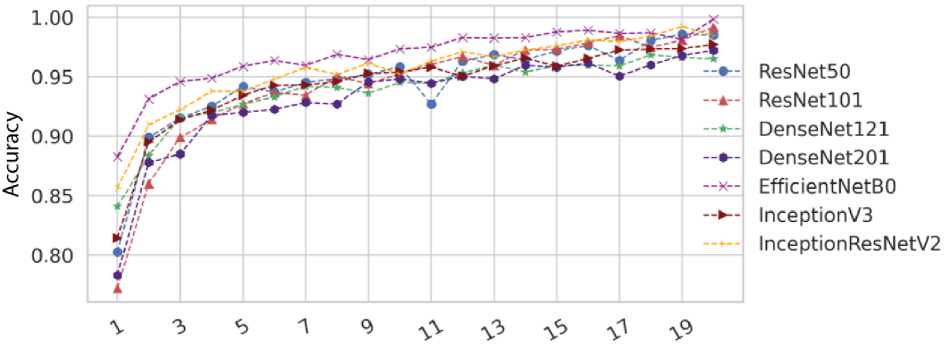
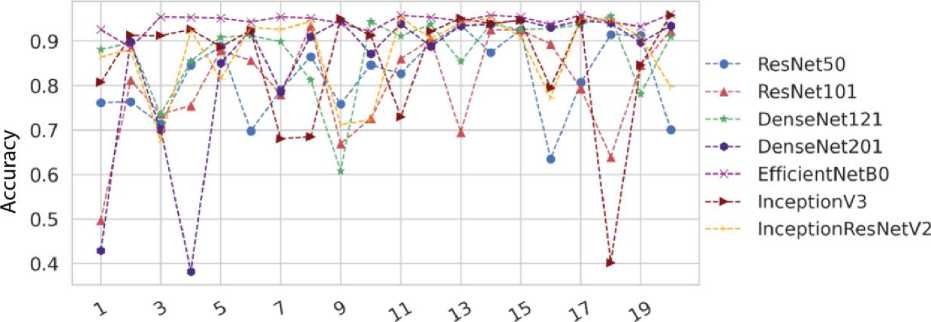
Figures 7 and 8 show the accuracy graph of each pre-trained deep learning model on the training and validation sets for Dataset-2.
epoch number
Fig. 7. Accuracy graphs of pre-trained models on the training dataset for Dataset-2
epoch number
Fig. 8. Accuracy graphs of pre-trained models on the validation dataset for Dataset-2
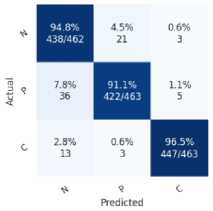
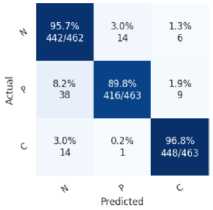
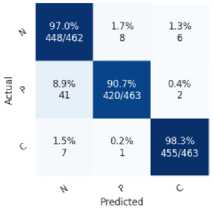
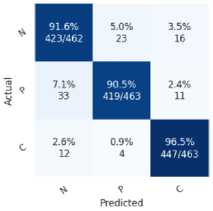
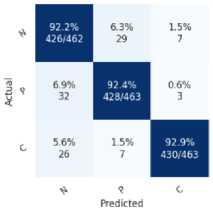
After the training process, the performance of each model was calculated using the confusion matrix values of the models. The confusion matrices of the models for Dataset-2 are shown in Figure 9. Table 5 shows the models' accuracy, precision, sensitivity, and F1-score values to Dataset-2. The accuracy values in bold in this table indicate the five most successful models. The five most successful models were EfficientNet-B0 with 96.88% accuracy, InceptionResNet-V2 with 96.59% accuracy, Inception-V3 with 96.35% accuracy, DenseNet-121 with 96.11% accuracy and DenseNet-201 with 96.06% accuracy.
DenseNet-121
DenseNet-201
EfficientNet-B0
ResNet-50
ResNet-101
Inception-V3
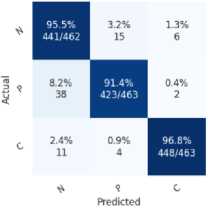
InceptionResNet-V2
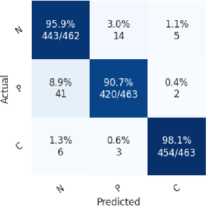
Fig. 9. Confusion matrices of pre-trained models for Dataset-2 (N: Normal, P: Pneumonia, C: Covid-19).
Table 5. Experimental results on the Dataset-2
|
Accuracy (%) |
Precision (%) |
Sensitivity (%) |
F1-Score (%) |
|
|
ResNet-50 |
95,24 |
92,88 |
92,87 |
92,87 |
|
ResNet-101 |
95,00 |
92,66 |
92,51 |
92,58 |
|
DenseNet-121 |
96,11 |
94,27 |
94,16 |
94,21 |
|
DenseNet-201 |
96,06 |
94,25 |
94,09 |
94,17 |
|
EfficientNet-B0 |
96,88 |
95,5 |
95,32 |
95,41 |
|
Inception-V3 |
96,35 |
94,65 |
94,52 |
94,58 |
|
InceptionResNet-V2 |
96,59 |
95,00 |
94,89 |
94,94 |
The confusion matrices shown in Figure 10 summaries the results obtained with the voting ensemble learning approaches, including the five models with the most successful results on Dataset-2.
a)
97.4% 450/462
1.9%
0.6%
98.3% 454/462
b)
1.3%
0.4%
8.2%
91.1%
422/463
0.6% 3
8.0%
91.1% 422/463
0.9% 4
1.3% б
0.2%
98.5% 456/463
1.5%
0.2%
98.3%
455/463
$ « С
Predicted
^ ? С
Predicted
Fig. 10. Confusion matrices of voting approaches for Dataset-2; a) hard voting, b) soft voting (N: Normal, P: Pneumonia, C: Covid-19).
The results obtained with both voting learning approaches on Dataset-2 are summarized in Table 6. The soft voting approach gave the best results with 97.26% accuracy, 96.08% precision, 95.89% sensitivity, and 95.98% F1-score.
Table 6. Experimental results of voting approaches on the Dataset-2
|
Accuracy (%) |
Precision (%) |
Sensitivity (%) |
F1-Score (%) |
|
|
Hard voting |
97,12 |
95,83 |
95,68 |
95,75 |
|
Soft voting |
97,26 |
96,08 |
95,89 |
95,98 |
Following experiments and findings, a decision support tool for field experts was developed using the soft voting approach that incorporates the most successful deep learning models. Figure 1 presents user interface application. With this tool, a field expert uploads a patient's X-ray image to the system, and the system analyzes the X-ray image using our build soft voting-based models, for Dataset-1 (2-classes) and Dataset-2 (3-classes), respectively and the results are displayed on the screen and also saved on the system. Therefore, this system also allows the field expert to analyze patient information and medical history in detail.
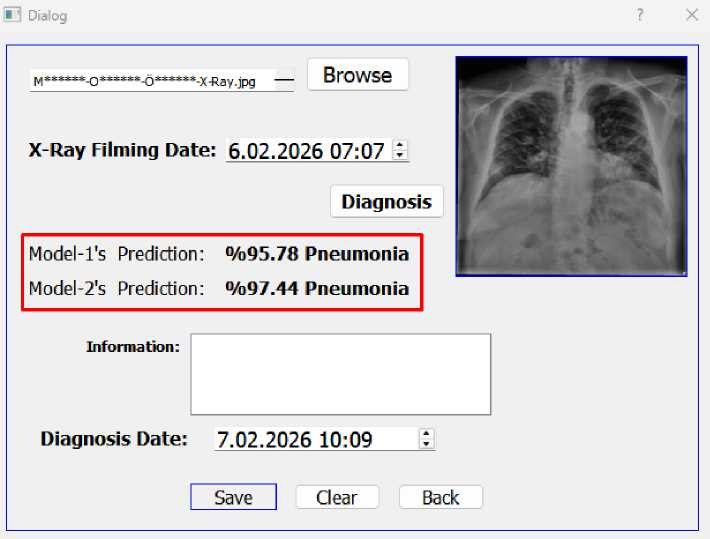
Fig. 11. User interface application for pneumonia detection
5. Discussion
Table 7 summarizes the experimental results of this paper and some works in literature. Accordingly, this table includes author names, dataset information, number of classes, number of instances, most successful model, and accuracy values. The bold fonts in this table indicate the results of this paper. For example, El Asnaoui, in his study on pneumonia disease detection, achieved a 95.17% success rate with hard voting in the ensemble learning approach he applied to the two-class dataset [21]. Mujahid et al. achieved 99.29% accuracy with Inception-V3 and the hard voting ensemble learning approach, including the original model they proposed and Inception-V3, on the two-class 'Pneumonia ChestX-ray Image' dataset, which includes images of pneumonia patients and those with no signs of disease for pneumonia disease detection [23]. In their study, Hashmi et al. achieved 98.00% accuracy with the DenseNet-121 model on the two-class 'Chest X-Ray Images' dataset, which includes images of patients with pneumonia and those without signs of disease for pneumonia disease detection [20]. Korkmaz achieved 97.70% accuracy with DenseNet-121 on the three-class dataset [30]. Narin combined three different datasets containing images of COVID-19 patients, patients with bacterial pneumonia, patients with pneumonia, and patients with no signs of the disease [22]. He achieved 99.70% accuracy with the ResNet-50 model using 5-fold cross-validation on this newly created four-class dataset. He achieved 99.70% accuracy with the ResNet-50 model using 5-fold cross-validation on this newly created four-class dataset [31]. Usman et al. demonstrated that their CNN model developed from scratch performed better than a pre-trained ResNet-50 model for pneumonia detection. Furthermore, the authors confirmed the importance of data augmentation and data size in their study [32]. Şimşek et al. applied resizing, cropping, bilinear interpolation, and histogram equalization preprocessing techniques to 1000 chest X-ray images obtained from various age groups in the clinics of Koç University Faculty of Medicine Hospital and performed pneumonia analysis with the CNN model they developed [33]. Shojib et al. applied Contrast-Limited Adaptive Histogram Equalization and Laplacian filtering preprocessing techniques for the detection of pneumonia and performed feature extraction with pre-trained deep learning models. The authors reported that they obtained the best results with the DenseNet201 feature extractor and the deep learning-based classifier their introduced [34]. Wu evaluated the performance of various convolutional neural networks for chest X-ray image classification and detection and reported that the lightweight ShuffleNetV2 model excelled in classification tasks, achieving high accuracy while minimizing computational load and memory consumption [35]. Nageye et al. investigated the performance of Simple CNN, DenseNet121, VGG16, and InceptionV3 models to distinguish between normal and pneumonia images. Furthermore, the authors employed data normalization and data augmentation techniques and reported that Simple CNN achieved the highest accuracy at 92% in their experiments [36]. In this study, the soft voting ensemble learning method achieved 98.55% accuracy for Dataset-1 and 97.26% accuracy for Dataset-2. As can be seen, the soft voting ensemble models presented in this study have provided acceptably high accuracies.
Table 7. The results of this paper and related works
|
Study |
Dataset |
Number of Classes |
Number of samples |
Data type |
Model / Approach |
Accuracy |
|
Hashmi M.F. et al. [20] |
“Chest X-ray Images” |
2 |
5856 |
X-ray |
DenseNet-121 |
98,00 |
|
El Asnaoui [21] |
“Chest X-ray Images” |
2 |
5856 |
X-ray |
Ensemble learning |
95,17 |
|
Mujahid M. et al. [23] |
“Pneumonia Chest X-ray Image Dataset” |
2 |
7750 |
X-ray |
Ensemble learning |
99,29 |
|
This study |
Dataset-1 |
2 |
5856 |
X-ray |
Soft voting |
98,55 |
|
Korkmaz and Atila [30] |
“COVID-19 Radiography Database” |
3 |
3886 |
X-ray |
DenseNet-121 |
97,70 |
|
Narin A. et al. [22] |
“ChestX-ray” “Chest X-ray Images” “Chest X-ray Images (Pneumonia)” |
4 |
7406 |
X-ray |
ResNet-50 |
99,70 |
|
Usman et al. [32]. |
“RSNA pneumonia detection challenge dataset” |
2 |
26,684 |
X-ray |
CNN model |
79 |
|
Şimşek et al. [33] |
Koç University |
2 |
1000 |
X-ray |
CNN model |
93,3 |
|
Shojib et al. [34] |
“ChestX-ray” |
2 |
5216 |
X-ray |
DenseNet201 + Deep neural network classifier |
99,68 |
|
Wu [35] |
“COVID-19 Radiography Database” |
4 |
21165 |
X-ray |
Lightweight ShuffleNetV2 |
92,51 |
|
Nageye et al. [36] |
"Chest X-Ray Images (Pneumonia)" |
2 |
5863 |
X-ray |
Simple CNN |
92 |
|
This study |
Dataset-2 |
3 |
6938 |
X-ray |
Soft voting |
97,26 |
6. Conclusion
This paper conducts deep learning experiments to assist field experts in detecting pneumonia, a disease that negatively affects human life. The results show that the soft voting, including the ResNet-50, DenseNet-201, Inception-V3, DenseNet-121, and Inception ResNet-V2, the best ones on the Dataset-1, achieved 98.55% accuracy. Also, the soft voting learning approach, which includes EfficientNet-B0, InceptionResNet-V2, Inception-V3, DenseNet-121, DenseNet-201, DenseNet-121, and DenseNet-201, the best ones on the Dataset-2, presented 97.26% accuracy. Compared to related state-of-the-art works, the classification accuracy of this paper is acceptably high. Also, this study introduced the decision support software for making the right decisions. Finally, the model proposed in this study can be incorporated into a decision support system designed to quickly analyze X-ray images with high accuracy, especially in hospitals with limited resources. Thus, the current work has the potential to be beneficial for radiologists and advantageous for usage in scanning conditions that are found in the real world. It could also be considered essential for future work in computer vision. On the other hand, it is also evaluated that this study has a dataset limitation. Validation experiments for models conducted in this paper were performed separately on two publicly available datasets. External validation works on different datasets are required for domain adaptation and, thus, model robustness. In the future, an investigation into more efficient ensemble procedures is going to be carried out with the intention of improving the diagnosis of pneumonia patients. In addition, one of the main efforts is to concentrate on different diseases for enhancing the robustness of the model that planned work.
All the Declarations and Statements
Author Contributions Statement
Mustafa Oguzhan Ozdemir – Data Curation and Software Implementation: Handled data acquisition, dataset preprocessing. Model Training, Validation, and Performance Evaluation: Led the model training process, validated results using standard metrics.
Kemal Akyol –Conceptualization, Methodology, and Supervision: Proposed research ideas, Constructed the overall framework.
All authors have read and agreed to the published version of the manuscript.
Conflict of Interest Statement
The authors declare that they have no known competing financial interests or personal relationships that could have appeared to influence the work reported in this paper.
Funding Declaration
This research did not receive any specific grant from funding agencies in the public, commercial, or not-for-profit sectors.
Data Availability Statement
The figures and tables supporting the results of this study are included in the article. Additionally, the datasets used for this paper are available at the following links:
-
• Dataset-1: https://www.kaggle.com/datasets/paultimothymooney/chest-xray-pneumonia
-
• Dataset-2: https://www.kaggle.com/datasets/amanullahasraf/covid19-pneumonia-normal-chest-xray-pa-dataset
Ethical Declarations
N/A.
Acknowledgements
We deeply appreciate the professional analysis provided by the editor and reviewers and their useful suggestions, which have helped to enhance the quality of the experiment and the validity of its findings.
Declaration of Generative AI in Scholarly Writing
Language polishing and grammar were done with the help of AI. There was no use of a generative AI to create content, generate ideas, analyse data, generate figures, or write scientifically.
Abbreviations
This manuscript uses the following abbreviations:
GPU – Google Compute Engine
TN – True Negative
FP – False Positive
TP – True Positive
FN – False Negative
Appendix A\B\C…, with appendix tile
None.
