GA_MLP NN: A Hybrid Intelligent System for Diabetes Disease Diagnosis

Автор: Dilip Kumar Choubey, Sanchita Paul
Журнал: International Journal of Intelligent Systems and Applications(IJISA) @ijisa
Статья в выпуске: 1 vol.8, 2016 года.
Бесплатный доступ
Diabetes is a condition in which the amount of sugar in the blood is higher than normal. Classification systems have been widely used in medical domain to explore patient's data and extract a predictive model or set of rules. The prime objective of this research work is to facilitate a better diagnosis (classification) of diabetes disease. There are already several methodology which have been implemented on classification for the diabetes disease. The proposed methodology implemented work in 2 stages: (a) In the first stage Genetic Algorithm (GA) has been used as a feature selection on Pima Indian Diabetes Dataset. (b) In the second stage, Multilayer Perceptron Neural Network (MLP NN) has been used for the classification on the selected feature. GA is noted to reduce not only the cost and computation time of the diagnostic process, but the proposed approach also improved the accuracy of classification. The experimental results obtained classification accuracy (79.1304%) and ROC (0.842) show that GA and MLP NN can be successfully used for the diagnosing of diabetes disease.
Pima Indian Diabetes Dataset, GA, MLP NN, Diabetes Disease Diagnosis, Feature Selection, Classification
Короткий адрес: https://sciup.org/15010786
IDR: 15010786
Текст научной статьи GA_MLP NN: A Hybrid Intelligent System for Diabetes Disease Diagnosis
Published Online January 2016 in MECS
In this paper, GA has been used as a Feature selection in which among 8 attributes, 4 attributes have been selected. The main purpose of Feature selection is to reduce the number of features used in classification while maintaining acceptable classification accuracy and ROC. Limiting the number of features (dimensionality) is important in statistical learning. With the help of Feature selection process we can save Storage capacity, Computation time (shorter training time and test time), Computation cost and increases Classification rate, Comprehensibility. MLP NN are supervised learning method for classification. Here, MLP NN have been used for the classification of the Diabetes disease diagnosis. The rest of the paper is organized as follows: Brief description of GA and MLP NN are in section II, Related work is presented in section III, Proposed methodology is discussed in section IV, Results and Discussion are devoted to section V, Conclusion and Future Direction are discussed in section VI.
-
II. Brief Description of GA and MLP NN
-
A. GA
John Holland introduced genetic Algorithm GA in the 1970 at University of Michigan (US). GA is an adaptive population based optimization technique, which is inspired by Darwin’s theory [10] about survival of the fittest. GA mimics the natural evolution process given by the Darwin i.e., in GA the next population is
evolved through simulating operators of selection, crossover and mutation. John Holland is known as the father of the original genetic algorithm who first introduced these operators in [16]. Goldberg [13] and Michalewicz [18] later improved these operators. The advantages in GA [17] are that Concepts easy to understand, solves problems with multiple solutions, global search methods, blind search methods, Gas can be easily used in parallel machines, etc. and the limitation are Certain optimization problems, no absolute assurance for a global optimum, cannot assure constant optimization response times, cannot find the exact solution, etc. GA can be applied in Artificial creativity, Bioinformatics, chemical kinetics, Gene expression profiling, control engineering, software engineering, Traveling salesman problem, Mutation testing, Quality control etc. The genetic algorithm uses three main types of rules at each step to create the next generation from the current population:
-
1. Selection
-
2. Crossover
-
3. Mutation
It is also called reproduction phase whose primary objective is to promote good solutions and eliminate bad solutions in the current population, while keeping the population size constant. This is done by identifying good solutions (in terms of fitness) in the current population and making duplicate copies of these. Now in order to maintain the population size constant, eliminate some bad solutions from the populations so that multiple copies of good solutions can be placed in the population. In other words, those parents from the current population are selected in selection phase who together will generate the next population. The various methods like Roulette – wheel selection, Boltzmann selection, Tournament selection, Rank selection, Steady – state selection, etc., are available for selection but the most commonly used selection method is Roulette wheel. Fitness value of individuals play an important role in these all selection procedures.
It is to be notice that the selection operator makes only multiple copies of better solutions than the others but it does not generate any new solution. So in crossover phase, the new solutions are generated. First two solutions from the new population are selected either randomly or by applying any stochastic rule and bring them in the mating pool in order to create two off-springs. It is not necessary that the newly generated off-springs is more, because the off-springs have been created from those individuals which have been survived during the selection phase. So the parents have good bit strings combinations which will be carried over to off-springs. Even if the newly generated off-springs are not better in terms of fitness then we should not be bother about because they will be eliminated in next selection phase. In the crossover phase new off-springs are made from those parents which were selected in the selection phase.
There are various crossover methods available like single-point crossover, two-point crossover, Multi-point crossover (N-Point crossover), uniform crossover, Matrix crossover (Two-dimensional crossover), etc.
Mutation to an individual takes part with a very low probability. If any bit of an individual is selected to be muted then it is flipped with a possible alternative value for that bit. For example, the possible alternative value for 0 is 1 and 0 for 1 in binary string representation case i.e. , 0 is flipped with 1 and 1 is flipped with 0. The mutation phase is applied next to crossover to keep diversity in the population. Again it is not always to get better off-springs after mutation but it is done to search few solutions in the neighborhood of original solutions.
-
B. MLP NN
One of the most important models in ANN or NN is MLP. The advantages in NN [17] are that Mapping capabilities or pattern association, generalization, robustness, fault tolerance and parallel and high speed information processing, good at recognizing patterns and the limitations are training to operate, require high processing time for large neural network, not good at explaining how they reach their decisions, etc. NN can be applied in Pattern recognition, image processing, optimization, constraint satisfaction, forecasting, risk assessment, control systems. MLP NN is feed forward trained with the Back-Propagation algorithm. It is supervised neural networks so they require a desired response to be trained. It learns how to transform input data in to a desired response to be trained, so they are widely used for pattern classification. The structure of MLP NN is shown in fig. 1. The type of architecture used to implement the system is MLP NN. The MLP NN consists of one input layer, one output layer, one or more hidden layers. Each layer consists of one or more nodes or neurons, represented by small circles. The lines between nodes indicate flow of information from one node to another node. The input layer is that which receives the input and this layer has no function except buffering the input signal [27], the output of input layer is given to hidden layer through weighted connection links. Any layer that is formed between the input and output layers is called hidden layer. This hidden layer is internal to the network and has no direct contact with the external environment. It should be noted that there may be zero to several hidden layers in an ANN, more the number of the hidden layers, more is the complexity of the network. This may, however, provide an efficient output response. This layer performs computations and transmits the results to output layer through weighted links, the output of the hidden layer is forwarded to output layer.The output layer generates or produces the output of the network or classification the results or this layer performs computations and produce final result.
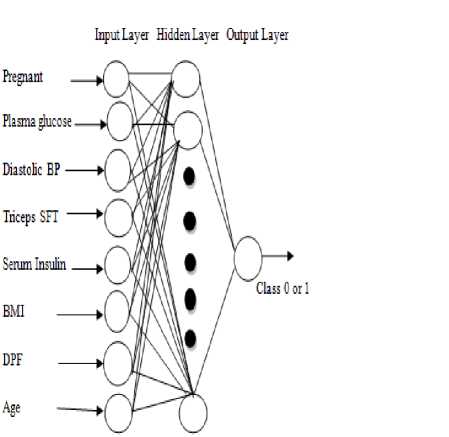
Fig.1. Feed Forward Neural Network Model for Diabetes Disease Diagnosis
-
III. Related Work
Kemal Polat et al. [2] stated Principal Component Analysis (PCA) and Adaptive Neuro–Fuzzy Inference System (ANFIS) to improve the diagnostic accuracy of Diabetes disease in which PCA is used to reduce the dimensions of Diabetes disease dataset features and ANFIS is used for diagnosis of Diabetes disease means apply classification on that reduced features of Diabetes disease datasets. Manjeevan Seera et al. [3] introduced a new way of classification of medical data using hybrid intelligent system. The methodology implemented here is based on the hybrid combinatorial method of Fuzzy maxmin based neural network and classification of data using Random forest Regression Tree. The methodology is implemented on various datasets including Breast Cancer and Pima Indian Diabetes Dataset and performs better as compared to other existing techniques. Esin Dogantekin et al. [1] used Linear Discriminant Analysis (LDA) and ANFIS for diagnosis of diabetes. LDA is used to separate feature variables between healthy and patient (diabetes) data, and ANFIS is used for classification on the result produced by LDA. The techniques used provide good accuracy then the previous existing results. So, the physicians can perform very accurate decisions by using such an efficient tool. H. Hasan Orkcu et al. [4] compares the performance of various back propagation and genetic algorithms for the classification of data. Since Back propagation is used for the efficient training of data in artificial neural network but contains some error rate, hence genetic algorithm is implemented for the binary and real-coded so that the training is efficient and more number of features can be classified. Muhammad Waqar Aslam et al. [7] introduced Genetic Programming–K-Nearest Neighbour (GP-KNN), Genetic ProgrammingSupport Vector Machines (GP-SVM), in which KNN and SVM tested the new features generated by GP for performance evaluation. According to Pasi Luukka [5]
Fuzzy Entropy Measures is used as a feature selection by which the computation cost, computation time can be reduced and also reduce noise and this way enhance the classification accuracy. Now from the previous statement it is clear that feature selection based on fuzzy entropy measures and it is tested together with similarity classifier. Kemal Polat et al. [12] proposed uses a new approach of a hybrid combination of Generalized Discriminant Analysis (GDA) and Least Square Support Vector Machine (LS–SVM) for the classification of diabetes disease. Here the methodology is implemented in two stages: in the first stage pre-processing of the data is done using the GDA such that the discrimination between healthy and patient disease can be done. In the second stage LS-SVM technique is applied for the classification of Diabetes disease patient’s. The methodology implemented here provides accuracy about 78.21% on the basis of 10 fold-cross validation from LS-SVM and the obtained accuracy for classification is about 82.05%. K Selvakuberan et al. [9] used Ranker search method, K star, REP tree, Naive bayes, Logisitic, Dagging, Multiclass in which Ranker search approach is used for feature selection and K star, REP tree, Naive bayes, Logisitic, Dagging, Multiclass are used for classification. The techniques implemented here provide a reduced feature set with higher classification accuracy.
Acording to Adem Karahoca et al. [29] ANFIS, and Multinomial Logistic Regression (MLR) has been used for the comparison of peformance in terms of standard errors for diabetes disease diagnosis. ANFIS is used as an estimation method which has fuzzy input and output parameters, whereas MLR is used as a non-linear regression method and has fuzzy input and output parameters. Laerico Brito Goncalves et al. [13] implemented a new Neuro-fuzzy model for the classification of diabetes disease patients. Here in this paper an inverted Hierarchical Neuro-fuzzy based system is implemented which is based on binary space partitioning model and it provided embodies for the continue recursive of the input space and automatically generates own structure for the classification of inputs provided. The technique implemented finally generates a series of rules extraction on the basis of which classification can be done. T. Jayalakshmi et al. [28] proposed a new and efficient technique for the classification of diagnosis of diabetes disease using Artificial neural network (ANN). The methodology implemented here is based on the concept of ANN which requires a complete set of data for the accurate classification of Diabetes. The paper also implements an efficient technique for the improvement of classification accuracy of missing values in the dataset. It also provides a preprocessing stage during classification. Nahla H. Barakat et al. [30] worked on the classification of diabetes disease using a machine learning approach such as Support Vector Machine (SVM). The paper implements a new and efficient technique for the classification of medical diabetes mellitus using SVM. A sequential covering approach for the generation of rules extraction is implemented using the concept of SVM, which is an efficient supervised learning algorithm. The paper also discusses Eclectic rule extraction technique for the extraction of rules set attributes from the dataset such that the selected attributes can be used for classification of medical diagnosis mellitus. Saloni et al. [31] have used various classifiers i.e ANN, linear, quadratic and SVM for the classification of parikson disease in which SVM provides the best accuracy of 96%. For the increases of classification accuracy, they have also used feature selection by which among 23 features, 15 features are selected. E.P. Ephzibah [23] used GA and Fuzzy Logic (FL) for diabetes diagnosis in which GA has been used as a feature selection method and FL is used for classification. The used methods improve the accuracy and reduced the cost.
-
IV. Proposed Methodology
Here, The Proposed approach is implemented and evaluated by GA as a Feature Selection and MLP NN for Classification on Pima Indians Diabetes Data set from UCI repository of machine learning databases.
The Proposed system of Block Diagram and the next proposed algorithm is shown below:
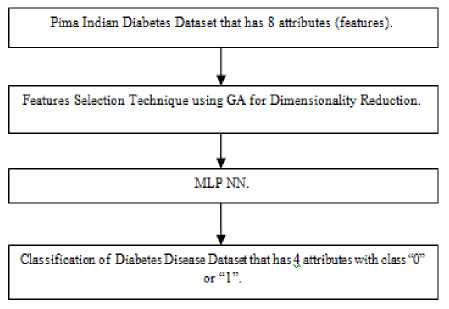
Fig.2. Block Diagram of Proposed System
Proposed Algorithm
Step1: Start
Step2: Load Pima Indian Diabetes Dataset
Step3: Initialize the parameters for the GA
Step4: Call the GA
Step5.1: Construction of the first generation
Step5.2: Selection
While stopping criteria not met do
Step5.3: Crossover
Step5.4: Mutation
Step5.5: Selection
End
Step6: Apply MLP NN Classification
Step7: Training Dataset
Step8: Calculation of error and accuracy
Step9: Testing Dataset
Step10: Calculation of error and accuracy
Step11: Stop
The proposed approach works in the following phases:
-
A. Take Pima Indians Diabetes Data set from UCI repository of machine learning databases.
-
B. Apply GA as a Feature Selection on Pima Indians Diabetes Data set.
-
C. Do the Classification by using MLP NN on selected features in Pima Indians Diabetes Dataset.
-
A. Used Diabetes Disease Dataset
The Pima Indian Diabetes Database was obtained from the UCI Repository of Machine Learning Databases [14]. The same dataset used in the reference [1-8] [11] [15] [19-26] [28].
-
B. GA for Feature Selection
The GA is a repetitive process of selection, crossover and mutation with the population of individuals in each iteration called a generation. Each chromosome or individual is encoded in a linear string (generally of 0s and 1s) of fix length in genetic analogy. In search space, First of all, the individual members of the population are randomly initialized. After initialization each population member is evaluated with respect to objective function being solved and is assigned a number (value of the objective function) which represents the fitness for survival for corresponding individual. The GA maintains a population of fix number of individuals with corresponding fitness value. In each generation, the more fit individuals (selected from the current population) go in mating pool for crossover to generate new off-springs, and consequently individuals with high fitness are provided more chance to generate off-springs. Now, each new offspring is modified with a very low mutation probability to maintain the diversity in the population. Now, the parents and off-springs together forms the new generation based on the fitness which will treated as parents for next generation. In this way, the new generation and hence successive generations of individual solutions is expected to be better in terms of average fitness. The algorithms stops forming new generations when either a maximum number of generations has been formed or a satisfactory fitness value is achieved for the problem.
The standard pseudo code of genetic algorithm is given in Algorithm 1
-
1. Algorithm GA
Begin q = 0
Randomly initialize individual members of population P(q)
Evaluate fitness of each individual of population P(q) while termination condition is not satisfied do q = q+1
selection (of better fit solutions) crossover (mating between parents to generate offsprings)
mutation (random change in off-springs) end while
Return best individual in population;
In Algorithm 1, q represents the generation counter, initialization is done randomly in search space and corresponding fitness is evaluated based on objective function. After that GA algorithm requires a cycle of three phases: selection, crossover and mutation.
In medical world, If we have to be diagnosed any disease then there are some tests to be performed. After getting the results of the tests performed, the diagnosed could be done better. We can consider each and every test as a feature. If we have to do a particular test then there are certain set of chemicals, equipments, may be people, more time required which can be more expensive. Basically, Feature Selection informs whether a particular test is necessary for the diagnosis or not. So, if a particular test is not required that can be avoided. When the number of tests gets reduced the cost that is required also gets reduced which helps the common people. So, Here that is why we have applied GA as a feature selection by which we reduced 4 features among 8 features. So from the above it is clear that GA is reducing the cost, storage capacity, and computation time by selected some of the feature.
-
C. MLP NN for Classification
MLP NN are supervised learning, feed forward method for classification. Since the MLP NN supervised learning, they require a desired response to be trained.
The working of MLP NN is summarized in steps as mentioned below:
-
1. Input data is provided to input layer for processing, which produces a predicted output.
-
2. The predicted output is subtracted from actual output and error value is calculated.
-
3. The network then uses a Back-Propagation (BP) algorithm which adjusts the weights.
-
4. For weights adjusting it starts from weights between output layer nodes and last hidden layer nodes and works backwards through network
-
5. When BP is finished the forwarding process starts again.
-
6. The process is repeated until the error between predicted and actual output is minimized.
-
3.1. BP Algorithm Network for Adjusting Weight Features
The most widely used training algorithm for multilayer and feed forward network is Back-Propagation. The name given is BP because, it calculates the difference between actual and predicted values is propagated from output nodes backwards to nodes in previous layer. This is done to improve weights during processing.
The working of BP algorithm is summarized in steps as follows:
-
1. Provide training data to network.
-
2. Compare the actual and desired output.
-
3. Calculate the error in each node or neuron.
-
4. Calculate what output should be for each node or neuron and how much lower or higher output must be adjusted for desired output.
-
5. Then adjust the weights.
The Block diagram of the working of MLP NN using BP is given below:
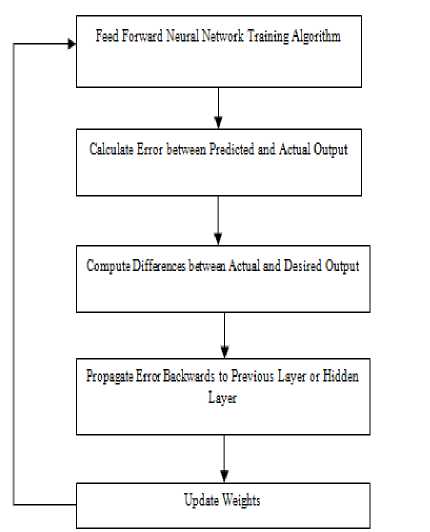
Fig.3. Block Diagram of MLP NN using BP
-
V. Results and Disscusion of Proposed Methodology
The work was implemented on i3 processor with 2.30GHz speed, 2 GB RAM, 320 GB external storage and software used JDK 1.6 (Java Development Kit), NetBeans 8.0 IDE and have done the coding in java. For the computation of MLP NN and various parameters weka library is used.
The parameters for the Genetic Algorithm for our task are:
|
Population Size |
20 |
|
Number of Generations |
20 |
|
Probability of Crossover |
0.6 |
|
Probability of Mutation |
0.033 |
|
Report Frequency |
20 |
|
Random Number Seed |
1 |
As per the table No.2 we may see that by applying the GA approach, we have obtained 4 features among 8 features. This means we have reduced the cost to s(x) = 4/8 = 0.5 from 1. This means that we have obtained an improvement on the training and classification by a factor of 2.
As we know that the diagnostic performance is usually evaluated in terms of Classification Accuracy, Precision, Recall, Fallout and F – Measure, ROC, Confusion Matrix. These terms are briefly explained below:
Classification Accuracy: Classification accuracy may be defined as the probability of it in correctly classifying records in the test datasets or Classification accuracy is the ratio of Total number of correctly diagnosed cases to the Total number of cases.
Classification accuracy (%)
= (TP + TN )/ (TP + FP + TN + FN (1)
Where,
The calculation is as follow:
F - Measure =
2∗Precision∗Recall Precision+Recall
Area under Curve (AUC): It is defined as the metric used to measure the performance of classifier with relevant acceptance. It is calculated from area under curve (ROC) on the basis of true positives and false positives.
AUC = 1 ( TP
2 TP+FN
+ TN ) TN+FP
TP (True Positive): Sick people correctly detected as sick.
FP (False Positive): Healthy people incorrectly detected as diabetic people.
TN (True Negative): Healthy people correctly detected as healthy.
FN (False Negative): Sick people incorrectly detected as healthy.
Precision: precision may define to measures the rate of correctly classified samples that are predicted as diabetic samples or precision is the ratio of number of correctly classified instances to the total number of instances fetched.
ROC is an effective method of evaluating the performance of diagnostic tests.
Confusion Matrix: A confusion matrix [12][2] contains information regarding actual and predicted classifications done by a classification system.
The following terms is briefly explained which is used in result part.
Kappa Statistics: It is defined as performance to measure the true classification or accuracy of the algorithm.
P0-Pc
K=
1-Pc
Where, P0 is the total agreement probability and Pc is the agreement probability due to change.
Root Mean Square Error (RMSE): It is defined as the different between actual predicted value and the actual predicted value in the learning.
RMSE = 2 √ 1 ∑jN=1(Ere - Eacc)2
Precision =
Where, Ere is the resultant error rate and Eacc is the actual error rate
Mean Absolute Error: It is defined as:
or Precision = TP/ TP + F (3)
Recall: Recall may define to measures the rate of correctly classified samples that are actually diabetic samples or recall is the ratio of number of correctly classified instances to the total number of instances in the Dataset.
MAE |p1-a1|+⋯+|pn-an|
n
Root Mean-Squared Error: it is defined as:
RMSE =
√
(p 1 -a 1 )2+⋯+(p n -a n )2 n
Recall =
Relative Squared error: It is defined as:
or Recall = TP/ TP + FN (5)
RSE =
As we know that usually precision increases then recall decreases or in other words simply precision and recall stand in opposition to one another.
Fallout: The term fallout is used to check true negative of the dataset during classification.
F - Measure: The F – Measure computes some average of the information retrieval precision and recall metrics. The F – Measure (F – Score) is calculated based on the precision and recall.
(p 1 -a 1 )2+⋯+(p n -a n )2 (a̅-a 1 )2+⋯+(a̅-a n )2
Relative Absolute Error: It is defined as:
RAE =
|p1-a1|+⋯+|pn-an| |a̅-a 1 |+⋯+|a̅-a n |
Where, ‘a1,a2….an’ are the actual target values and ‘p1,p2….pn’ are the predicted target values.
The details of Evaluation on training set and Evaluation on test split with MLP NN are as follows.
Time taken to build model = 2.06 seconds
Evaluation on training set
|
Correctly Classified |
435 |
80.855% |
|
Instances |
||
|
Incorrectly Classified |
103 |
19.145% |
|
Instances |
||
|
Kappa statistic |
0.5499 |
|
|
Mean absolute error |
0.2528 |
|
|
Root mean squared error |
0.3659 |
|
|
Relative absolute error |
55.4353% |
|
|
Root relative squared error |
76.6411% |
|
|
Total Number of Instances |
538 |
Detailed Accuracy by Class
|
TP |
FP |
Prec |
Reca |
F- |
ROC |
Class |
|
|
Rate |
Rate |
ision |
ll |
Mea |
Area |
||
|
sure |
|||||||
|
0.93 |
0.41 |
0.80 |
0.93 |
0.86 |
0.872 |
tested_ |
|
|
1 |
8 |
4 |
1 |
3 |
negativ |
||
|
e |
|||||||
|
0.58 |
0.06 |
0.82 |
0.58 |
0.68 |
0.872 |
tested_ |
|
|
2 |
9 |
1 |
2 |
1 |
positiv |
||
|
e |
|||||||
|
Weight |
0.80 |
0.29 |
0.81 |
0.80 |
0.79 |
0.872 |
|
|
ed Avg. |
9 |
5 |
9 |
9 |
|||
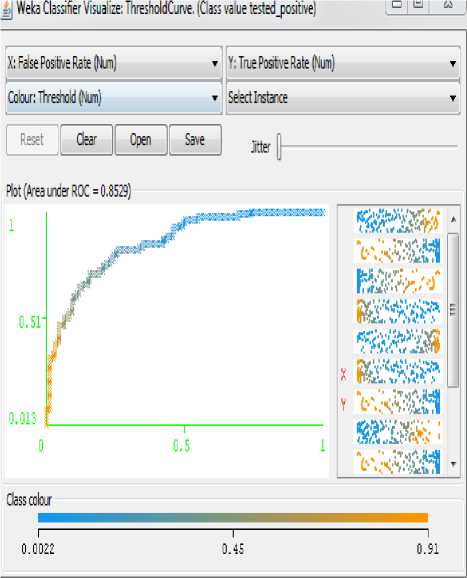
Fig.4. Analysis of Positive Rate for Pima Indian Diabetes Dataset without GA
Confusion Matrix
A b <--classified as
325 24 | a = tested_ negative
79 110| b = tested_ positive
Time taken to build model = 2.04 seconds Evaluation on test split
|
Correctly Classified Instances Incorrectly Classified Instances Kappa statistic Mean absolute error Root mean squared error Relative absolute error Root relative squared error Total Number of Instances |
180 50 0.4769 0.2716 0.387 59.8716% 81.4912% 230 |
78.2609% 21.7391% |
|
Detailed Accuracy by Class TP FP Prec |
Reca F- |
ROC Class |
|
Rate Rate ision |
ll Mea |
Area |
|
0.92 0.48 0.78 |
sure 0.92 0.84 |
0.853 tested_ |
|
1 1 5 |
1 8 |
negativ |
|
0.51 0.07 0.77 |
0.51 0.62 |
e 0.853 tested_ |
|
9 9 4 |
9 1 |
positiv |
|
Weighted 0.78 0.34 0.78 |
0.78 0.77 |
e 0.853 |
|
Avg. 3 3 1 |
3 |
Cofusion Matrix a b <--classified as
139 12| a = tested_ negative
38 41| b = tested_ positive
The figure shown below is the analysis of False Positive Rate Vs True Positive Rate. Figure 4 indicating the ROC graph for MLP NN methodology.
The Pima Indian Diabetes Dataset classified using MLP NN generates less error rate as shown in figure 4.
The table 1 shows the result of training and testing accuracy by applying MLP NN methodology.
Table 1. Classification with MLP NN
|
Datase |
Inst |
Tra |
Tes |
Att |
Tra |
Tes |
Trai |
Testi |
|
t |
anc |
inin |
ting |
rib |
inin |
ting |
ning |
ng |
|
es |
g |
Dat |
ute |
g |
Ac |
ROC |
ROC |
|
|
Dat |
a |
s |
Ac |
cur |
||||
|
a |
cur |
acy |
||||||
|
acy |
||||||||
|
Diabet |
768 |
538 |
230 |
8 |
80. |
78. |
0.87 |
0.85 |
|
es |
855 |
260 |
2 |
3 |
||||
|
% |
9% |
Table 2. GA Feature Reduction
|
Data set |
Num ber of attri bute s |
Feature set (Name of attributes) |
No . of Ins tan ces |
No . of Cla sse s |
|
Pima Indian Diabete s Dataset (Witho ut GA) |
8 |
tolerance test
|
76 8 |
2 |
|
Pima Indian Diabete s Dataset (With GA) |
4 |
tolerance test
8. Age (years) |
76 8 |
2 |
The table 2 shows the feature reduction by using GA on Pima Indian Diabetes Dataset which is just below.
The details of Evaluation on training set and Evaluation on test split with GA _ MLP NN are as follows.
|
Time taken to build model = 0.94 seconds Evaluation on training set |
||||||
|
Correctly Classified Instances |
415 |
77.1375% |
||||
|
Incorrectly Classified Instances Kappa statistic Mean absolute error Root mean squared error Relative absolute error Root relative squared error Total Number of Instances Detailed Accuracy by Class |
123 0.4555 0.2989 0.391 65.5616% 81.9121% 538 |
22.8625% |
||||
|
TP |
FP |
Prec |
Reca |
F- |
RO |
Class |
|
Rate |
Rate |
ision |
ll |
Mea sure |
C Area |
|
|
0.91 |
0.49 |
0.77 |
0.91 |
0.83 |
0.84 |
tested_ |
|
7 |
7 |
3 |
7 |
9 |
2 |
negativ e |
|
0.50 |
0.08 |
0.76 |
0.50 |
0.60 |
0.84 |
tested_ |
|
3 |
3 |
6 |
3 |
7 |
2 |
positiv e |
|
Weight 0.77 |
0.35 |
0.77 |
0.77 |
0.75 |
0.84 |
|
|
ed Avg. 1 |
2 |
1 |
1 |
7 |
2 |
|
Cofusion Matrix a b <--classified as
320 29 | a = tested_ negative
94 95 | b = tested_ positive
Time taken to build model = 0.95 seconds Evaluation on test split
|
Correctly Classified Instances Incorrectly Classified Instances Kappa statistic Mean absolute error Root mean squared error Relative absolute error Root relative squared error Total Number of Instances |
182 48 0.5011 0.2984 0.387 65.7734% 81.4774% 230 |
79.1304% 20.8696% |
||||
|
Detailed Accuracy by Class TP FP Prec |
Reca |
F- |
RO |
Class |
||
|
Rate |
Rate |
ision |
ll |
Mea |
C |
|
|
0.92 |
0.45 |
0.79 |
0.92 |
sure 0.85 |
Area 0.84 |
tested_ |
|
1 |
6 |
4 |
1 |
3 |
2 |
negativ |
|
0.54 |
0.07 |
0.78 |
0.54 |
0.64 |
0.84 |
e tested_ |
|
4 |
9 |
2 |
4 |
2 |
2 |
positiv |
|
Weigh 0.79 |
0.32 |
0.79 |
0.79 |
0.78 |
0.84 |
e |
|
ted 1 |
6 |
1 |
2 |
|||
Avg.
Cofusion Matrix a b <--classified as
139 12| a = tested_ negative
36 43| b = tested_ positive
The table 3 shows the result of training and testing accuracy by applying GA_MLP NN methodology.
Table 3. Classification with GA_MLP NN
|
Dat |
Ins |
Tra |
Tes |
Att |
Re |
Tra |
Tes |
Tra |
Tes |
|
aset |
tan |
ini |
tin |
rib |
duc |
ini |
tin |
ini |
tin |
|
ces |
ng |
g |
ute |
ed |
ng |
g |
ng |
g |
|
|
Dat |
Dat |
s |
Att |
Ac |
Ac |
RO |
RO |
||
|
a |
a |
rib |
cur |
cur |
C |
C |
|||
|
ute |
acy |
acy |
|||||||
|
Dia |
76 |
53 |
23 |
8 |
4 |
77. |
79. |
0.8 |
0.8 |
|
bet |
8 |
8 |
0 |
13 |
13 |
42 |
42 |
||
|
es |
75 |
04 |
|||||||
|
% |
% |
The figure shown below is the analysis of False Positive Rate Vs True Positive Rate. The Pima Indian Diabetes Dataset classified using MLP NN on selected feature by Genetic Algorithm and generates less error rate as shown in figure 5.
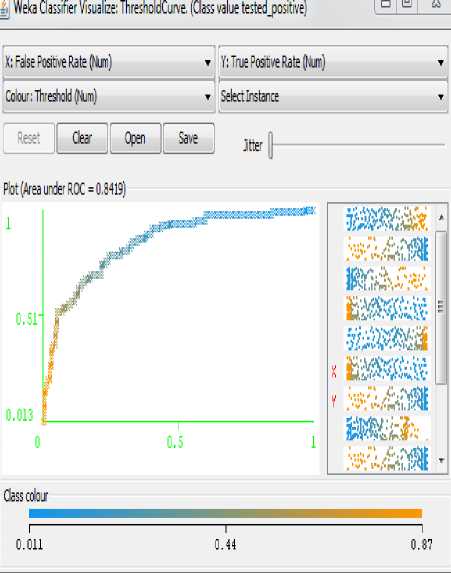
Fig.5. Analysis of Positive Rate for Pima Indian Diabetes Dataset with GA
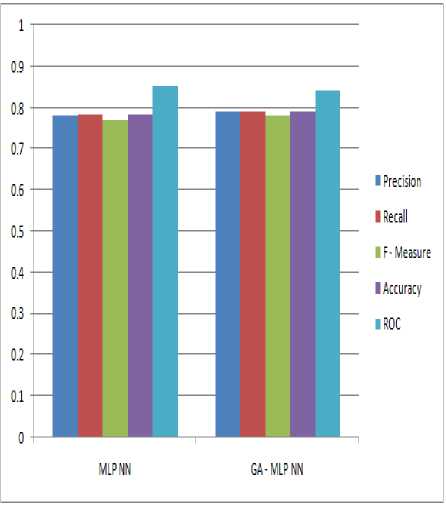
The table 4 shows the analysis of comparison result with and without GA on MLP NN for Pima Indian Diabetes Dataset.
|
S.No. |
Parameter |
MLP NN |
GA _ MLP NN |
|
1. |
Precision |
0.781 |
0.79 |
|
2. |
Recall |
0.783 |
0.791 |
|
3. |
F – Measure |
0.77 |
0.78 |
|
4. |
Accuracy |
78.2609% (0.782609) |
79.1304% (0.791304) |
|
5. |
ROC |
0.853 |
0.842 |
As we may see in table 4, with GA the improvement has occurred in every parameter remaining to ROC, we achieved slightly less ROC may by applying this approach only on this dataset but mostly in any cases by applying feature selection approach the ROC also improved.
The figure shown below is the analysis of comparison result with and without GA on MLP NN for Pima Indian Diabetes Dataset.
The table 5 shows the result comparison in terms of accuracy on Pima Indian Diabetes Dataset for the diagnosis of diabetes disease. As we may see in table 5 that several techniques have been employed.
Table 5. Results and Comparison with other methods for the Pima Indians diabetes data set
|
Source |
Method |
Accuracy (%) |
|
Pasi Luukka (2011) |
Sim |
75.29% |
|
Sim + F1 |
75.84% |
|
|
Sim + F2 |
75.97% |
|
|
H. Hasan Orkcu et al. (2011) |
Binary – coded GA |
74.80% |
|
BP |
73.80% |
|
|
Real – coded GA |
77.60% |
|
|
Manjeevan Seera et al. (2014) |
FMM |
69.28% |
|
FMM – CART |
71.35% |
|
|
FMM-CART – RF |
78.39% |
|
|
Dilip Kumar Choubey et al. (2015) |
J48graft DT |
76.5217% |
|
GA_J48grft DT |
74.7826 % |
|
|
Our Study |
GA _MLP NN |
79.1304% |
The table 6 shows the result comparison in terms of ROC on Pima Indian Diabetes Dataset for the diagnosis of diabetes disease. As we may see in table 6 that the proposed technique provides better ROC than other existing technique.
Table 6. Results of ROC for Pima Indians diabetes data set
|
Source |
Method |
ROC |
|
Pasi Luukka (2011) |
Sim |
0.762 |
|
Sim + F1 |
0.703 |
|
|
Sim + F2 |
0.667 |
|
|
Manjeevan Seera et al. (2014) |
FMM |
0.661 |
|
FMM - CART |
0.683 |
|
|
FMM-CART - RF |
0.732 |
|
|
Dilip Kumar Choubey et al. (2015) |
J48graft DT |
0.765 |
|
GA_J48grft DT |
0.786 |
|
|
Our Study |
GA _MLP NN |
0.842 |
-
VI. Conclusion and Future Work
Diabetes is a chronic disease that occurs due to high blood glucose level in the body. Diabetes also contributes to blindness, blood pressure, heart disease, kidney disease and nerve damage, etc. which is hazardous to health. The proposed approach implemented here for the feature selection, classification of Diabetes Patient’s using GA, MLP NN on Pima Indian diabetes dataset. The proposed work minimizes the computation cost, computation time and maximizes the classification accuracy and ROC. With features selection methodology (GA) we improve the accuracy but achieved slightly less ROC may by applying this methodology only on this dataset but mostly in any cases by applying feature selection techniques the ROC also improved however the classification accuracy has been improved.
For the future research work, we suggest to develop such a classification system of diabetes disease which provides good ROC, classification accuracy, precision, recall and F-Measure, which could significantly decrease healthcare costs via early prediction and diagnosis of diabetes disease, This approach of a classification system can also be used for other kinds of disease.
Список литературы GA_MLP NN: A Hybrid Intelligent System for Diabetes Disease Diagnosis
- Esin Dogantekin, Akif Dogantekin, Derya Avci, Levent Avci “An Intelligent Diagnosis System For Diabetes On Linear Discriminant Analysis and Adaptive Network Based Fuzzy Inference System: LDA – ANFIS”, Elsevier: Digital Signal Processing, Vol. – 20, pp. 1248 – 1255, 2010.
- Kemal Polat, Salih Gunes “An Expert System Approach Based On Principal Component Analysis and Adaptive Neuro – Fuzzy Inference System to Diagnosis Of Diabetes Disease”, Elsevier: Digital Signal Processing, Vol. – 17, pp. 702 – 710, 2007 .
- Manjeevan Seera, Chee Peng Lim, “A Hybrid Intelligent System for Medical Data Classification”, Elsevier: Expert Systems with Applications, Vol. – 41, pp. 2239-2249, 2014.
- H. Hasan Orkcu, Hasan Bal, “Comparing Performances of Backpropagation and Genetic Algorithms in the Data Classification, Elsevier: Expert Systems with Applications, Vol. – 38, pp. 3703 – 3709, 2011.
- Pasi Lukka, “Feature Selection using fuzzy entropy measures with similarity classifier”, Elsevier: Expert Systems with Applications, Vol. – 38, pp. 4600 – 4607, 2011.
- Hasan Temurtas , Nejat Yumusak , Feyzullah Temurtas “A Comparative Study On Diabetes Disease Diagnosis
- Using Neural Networks”, Elsevier: Expert Systems With Applications, Vol. – 36, pp. 8610–8615, 2009.
- Muhammad Waqar Aslam, Zhechen Zhu, Asoke Kumar Nandi “Feature Generation Using Genetic Programming With Comparative Partner Selection For Diabetes Classification”, Elsevier: Expert Systems With Applications, Vol. – 40, pp. 5402 – 5412, 2013 .
- Laerico Brito Goncalves, Marley Maria Bernardes and Rebuzzi Vellasco,” Inverted Hierarchical Neuro-Fuzzy BSP System: A Novel Neuro-Fuzzy Model for Pattern Classification and Rule Extraction in Databases”, IEEE Transactions on Systems, man, and Cybernetics—part c: Applications and Reviews, Vol. 36, No. 2, March 2006.
- K Selvakuberan, D Kayathiri, B Harini, Dr M Indra Devi,” An efficient feature selection method for classification in Health care Systems using Machine Learning Techniques”, IEEE, 2011.
- Charles Darwin “On the origins of species by means of natural selection” London : Murray, 1859.
- Kamer Kayaer, Tulay Yildirim “Medical Diagnosis On Pima Indian Diabetes Using General Regression Neural Networks” Yildiz Technical University, Department Of Electronics and Comm. Eng. Besiktas, Istanbul 34349 Turkey IEEE 2003.
- Kemal Polat, Salih Guneh, Ahmet Arslan “A Cascade Learning System for Classification of diabetes disease: Generalized Discriminant Analysis and Least Square Support Vector Machine”, Elsevier: Expert Systems with Applications, Vol. – 34, pp. 482 – 487, 2008.
- DE Goldberg “Genetic algorithms in search, optimization, and machine learning,” Addison - wesley, reading, ma, 1989. NN Schraudolph and J., 3:1.
- UCI Repository of Bioinformatics Databases [online] Available: http://www.ics.uci.edu./~mlearn/ ML Repository.html.
- Mostafa Fathi Ganji, Mohammad Saniee Abadeh “Using fuzzy Ant Colony Optimization for Diagnosis of Diabetes Disease” Proceedings of ICEE 2010, May 11-13, IEEE 2010.
- H Holland “Adaptation in natural and artificial systems” Ann Arbor MI: The University of Michigan Press, 1975.
- Dilip Kumar Choubey, Sanchita Paul, Joy Bhattacharjee “Soft Computing Approaches for Diabetes Disease Diagnosis: A Survey”, International Journal of Applied Engineering Research, Vol. – 9, pp. 11715-11726, 2014.
- Zbigniew Michalewicz “Genetic algorithms + data structures = evolution programs” Springer, 1996.
- Humar Kahramanli, Novruz Allahverdi, “Design of a Hybrid System for the Diabetes and Heart Diseases”, Elsevier: Expert Systems with Applications, Vol. – 35, pp. 82 – 89, 2008.
- K Selvakuberan, D Kayathiri , B Harini , Dr M Indra Devi,” An efficient feature selection method for classification in Health care Systems using Machine Learning Techniques”, 978-1-4244-8679-3/11, IEEE, 2011.
- Chang-Shing Lee,” A Fuzzy Expert System for Diabetes Decision Support Application”, IEEE Transactions on Systems, Man, and Cybernetics—Part B: Cybernetics, Vol. 41, No. 1, February 2011.
- Savvas Karatsiolis, Christos N. Schizas,”Region based Support vector machine algorithm for Medical Diagnosis on PIMA Indian Diabetes Dataset”, Proceedings of the 2012 IEEE 12th International Conference on Bioinformatics& Bioengineering (BIBE), Larnaca, Cyprus, 11-13 November 2012.
- Mostafa Fathi Ganji, Mohammad Saniee Abadeh “Using fuzzy Ant Colony Optimization for Diagnosis of Diabetes Disease” Proceed ings of ICEE 2010, May 11-13, 2010 978-1-4244-6760-0/10 IEEE 2010.
- C. Kalaiselvi, Dr. G .M. Nasira, Ph.D., “A New Approach for Diagnosis of Diabetes and Prediction of Cancer using ANFIS”, IEEE: World Congress on Computing and Communication Technologies, 2014.
- Sultan Noman Qasem, Siti Mariyam Shamsuddin, “Radial basis function network based on time variant multi-objective particle swarm optimization for medical diseases diagnosis”, Elsevier: Applied Soft Computing, Vol. – 11, pp. 1427 - 1438, 2007.
- Asha Gowda Karegowda , A.S. Manjunath , M.A. Jayaram, “Application Of Genetic Algorithm Optimized Neural Network Connection Weights For Medical Diagnosis Of Pima Indians Diabetes”, International Journal On Soft Computing ( IJSC ), Vol. - 2, No. - 2, May 2011.
- S N Sivanandam, S N Deepa “Priciples of Soft Computing”.
- T.Jayalakshmi, Dr.A.Santhakumaran,” A Novel Classification Method for Diagnosis of Diabetes Mellitus Using Artificial Neural Networks”, International Conference on Data Storage and Data Engineering, IEEE 2010.
- Adem Karahoca, Dilek Karahoca, Ali Kara “Diagnosis Of Diabetes By Using Adaptive Neuro Fuzzy Inference Systems” IEEE 2009.
- Nahla H. Barakat, Andrew P. Bradley,” Intelligible Support Vector Machines for Diagnosis of Diabetes Mellitus”, IEEE Transactions on Information Technology in Biomedicine, Vol. 14, No. 4, July 2010.
- Saloni, R K Sharma, Anil K Gupta, “Voice Analysis for Telediagnosis of Parkinson Disease Using Artificial Neural Networks and Support Vector Machines”, MECS: International Journal of Intelligent Systems and Applications (IJISA), pp. 41 -47, 2015.
