Patterns and Predictors of Student Technological Proficiency in Heis: A Validated Instrument and Machine Learning Analysis

Author: Abdelilah Chahid, Youssef El Marzak, Ossama Aouane, Khalifa Mansouri
Journal: International Journal of Modern Education and Computer Science @ijmecs
Article in issue: 3 vol.18, 2026.
Free access
This study examines AI-related technological proficiency among undergraduate students at the University of Casablanca and identifies the most informative indicators for prediction. Using a validated 30-item instrument covering AI applications, AI-related skills, and improvement strategies, data were collected from 600 students drawn from science and humanities programs. Overall proficiency was moderate: 63.3% of respondents met the predefined threshold, and significant group differences were observed by gender and academic specialization. For predictive modeling, correlation-based feature selection retained 17 high-value items. Two classifiers were then trained and evaluated using a 75/25 hold-out split, complemented by repeated stratified 10-fold cross-validation to assess stability. The Support Vector Classifier achieved 96.7% test accuracy with AUROC = 0.9666, while Gaussian Naïve Bayes reached 94.7% accuracy with AUROC = 0.9560; cross-validated estimates remained consistent with these results, supporting robustness. These findings indicate that a reduced set of questionnaire items can provide reliable estimates of students’ AI-related technological proficiency and can support scalable assessment and targeted interventions in higher education.
Digital Competence, AI Literacy, Machine Learning, Higher Education, Feature Selection, Support Vector Classifier, Gaussian Naïve Bayes
Short address: https://sciup.org/15020358
IDR: 15020358 | DOI: 10.5815/ijmecs.2026.03.06
Text of the scientific article Patterns and Predictors of Student Technological Proficiency in Heis: A Validated Instrument and Machine Learning Analysis
Universities are increasingly functioning as digital learning centers, where technology is integrated into teaching and learning and research and administration. Modern platforms and technologies are of utmost importance in
This work is open access and licensed under the Creative Commons CC BY 4.0 License.
increasing access to education and services for students. These changes impact both faculty and students: faculty have developed new pedagogical skills involving the use of tablets, laptop computers, and desktop computers, while students are making increasing use of intelligent, data-driven applications. Despite these developments, overall technology proficiency in disciplines remains medium, even though such skills are always related to more satisfactory interaction with more sophisticated appliances and increased academic success [1]. Technological proficiency (TP) is here defined as a group of skills enabling students to use smart digital appliances and systems, to use elementary digital skills in support thereof, and to use strategies for building these skills up continuously. The future seems to show increasing use of smart, data-based applications for the learning and evaluation tasks to be performed. They may provide immediate feedback, be used for learning analytics applicable to evidence-based academic decision-making, and may produce virtual or simulated environments for courses where the practical demonstration or real-world replication is difficult [2]. At the same time, these environments help strengthen the higher-education structures by becoming involved in applied and vocational courses, when production plants, commercial training centers, etc., or other authentic work places are unavailable [2, 3]. It is in this context that the present study bears upon a question of broad significance to policy makers, ministries and higher-education leaders everywhere, namely the digital skills of students as related to advanced computational technologies. Because these technologies have much in common with vital life and work skills, students must develop great TP if they are to successfully keep pace with rapid changes. In answer to the repeated calls appearing in the literature for a greater emphasis being placed on digital orientation and the skills for adapting to its changing requirements, study is to be made of the kinds of useful evidence this study has for curriculum design and program leadership in higher education affecting elements promoting TP in respect of technology [4].
The contribution is both theoretical and practical. Theoretically, it fills a clear gap by providing empirical evidence on technology-related TP among Moroccan undergraduates and on how they engage with intelligent digital tools. Practically, it evaluates the TP of University of Casablanca students in relation to these applications to gauge readiness for a technology-intensive future and to inform policy and curricular decisions.
This study examines the extent of students' practices related to AI across three dimensions. The sample consists of students from the science and humanities faculties of the University of Casablanca during the 2024-2025 academic year.
We commenced by providing an all-inclusive literature review and contribution to knowledge in Section 2. Section 3 presents the materials and methods study design, population and sample, instrument, data collection, preprocessing, and the analytical pipeline (Pearson correlations, feature selection, SVC and GNB classifiers). Section 4 reports the empirical results descriptive statistics, group comparisons, model performance (precision, recall, F1, AUROC), and interpretation. Section 5 offers the conclusion key findings, limitations, and directions for future work.
-
2. Literature Review
-
2.1. Technological Proficiency
-
-
2.2. Artificial Intelligence
However, the literature frequently uses related constructs interchangeably, which may generate conceptual ambiguity. While digital competence refers broadly to the ability to use digital technologies effectively and responsibly across contexts, AI literacy focuses more specifically on understanding fundamental AI concepts, ethical implications, and societal impact. In contrast, AI-related technological proficiency (TP), as operationalized in this study, refers to the applied capacity to interact with AI-enabled systems, integrate AI tools into academic tasks, and leverage computational methods for structured problem solving.
Thus, digital competence constitutes a general foundational capability, AI literacy represents conceptual and critical understanding, whereas AI-related technological proficiency reflects applied operational mastery. The present study specifically measures the latter. The integration of technologies into university education has become a top strategic priority and requires a comprehensive redesign of the system, including all its activities, services, and processes. This direction calls for a digital transformation aimed at improving every aspect of the teaching and learning process—students, instructors, curricula, administration, finances, and assessment where technological proficiency plays a central role [6].
Technological proficiency (TP) is commonly described as a cornerstone of digital transformation. It refers to a wide set of computer- and Internet-related competences characterized by features such as wide coverage, interactive use, complementarity, variety, adaptability, and regular upgrading. In practice, these competences can streamline tasks, enhance the standard of outcomes, and lower expenses. They also support learning from any place at any time and help people build new abilities through collaborative and participatory practices enabled by online platforms and services [7,8].
Furthermore, the effective use of modern technology requires a combination of skills, experience and practical knowledge. The three types of literacy (information literacy, media literacy and ICT literacy) provide the foundation for the purposeful use of Digital tools can be used in many ways, for instance to produce and organize information in digital formats, revise it when needed, and engage thoughtfully with online materials and communication through connected networks [9].
TP is also considered a core competency for lifelong learning, along with foreign-language competence, mathematical literacy, basic skills in science and technology, learning to learn, and social and political competences. Critical thinking and problem-solving skills are closely linked to a person’s ability to conduct academic and professional research [10].
In science and technology, Artificial Intelligence (AI) encompasses the concepts and techniques used to create machines capable of acting in ways typically associated with intelligence AI is a very large field of computer science, which intends to build systems that can "reason" like humans do; it attempts to develop machines that can execute tasks requiring intelligence and to replicate human cognitive functions [11, 12].
A subset of AI, machine learning (ML), is concerned with developing algorithms that allow computers to learn from data and improve over time. Many applications exist that utilize ML, such as improved detection capabilities [13], clustering and grouping methods [14], stronger security mechanisms [15], notably systems for anomaly/incident identification [16] and applications based on pattern recognition [17].
Natural Language Processing (NLP) focuses on enabling computers to understand and interact with humans through natural languages. NLP enables computers to process, understand, interpret, and generate human language in order to provide in applications like chatbots, cross-language translation tools, and methods for extracting sentiment from written content [18].
Robotics integrates AI with mechanical engineering to design robots that can operate autonomously or with partial autonomy. Robotics has many applications in industries such as manufacturing automation, medical services, and working in dangerous/hard-to-access locations [19, 20].
3. Materials and Methods
The researchers followed a structured sequence covering the study population, sampling, instruments, data collection, and statistical analysis, as outlined below:
-
3.1. Descriptive Method
-
3.2. Defining the Population and Selecting the Sample
-
3.3. Research instrument
The study adopted a descriptive research design because it best matched the aims and questions guiding the investigation—specifically, to determine how proficient University of Casablanca students are in digital skills.
we used a convenience sample of 600 students recruited via Google Classroom announcements from the University of Casablanca. This group included 260 male and 340 female participants. In terms of academic focus, 330 were enrolled in scientific disciplines and 270 in humanities programs. Data were gathered using an electronic questionnaire, and all 600 questionnaires were returned; a small number of item-level missing were imputed using the mode meaning the final working sample consisted of exactly 600 valid questionnaires.
This sample size follows the recommendation outlined in reference [21], In practice, adequacy is frequently defined as having around five to ten observations for each item in the instrument.
The survey instrument consisted of two principal components. The first section collected basic personal details from respondents, specifically their gender (categorized as male or female) and their college affiliation (grouped as either scientific or humanities). These distributions are presented in Table 1.
Table 1. Profile of the study participants.
|
Population Statistical |
Domain |
N |
% |
Sample / Gender |
No. |
% |
|
University of Casablanca |
Scientific |
330 |
57.5 |
M |
260 |
40 |
|
Human |
270 |
42.5 |
F |
340 |
60 |
|
|
Sum |
600 |
100 |
600 |
100 |
To meet the study objective, we used a Technological Proficiency questionnaire, the team used a Technological Proficiency questionnaire designed to gather participants’ ratings and judgments on a set of 30 statements; these 30 items were allocated across three dimensions intended to assess TP in the context of artificial intelligence. The instrument, sourced from [22], was organized into the following three dimensions: 1st dimension: TP linked to applications and systems using artificial intelligence, comprising 10 items. 2nd dimension: TP tied to the skills needed for artificial intelligence, also with 10 items. 3rd dimension: proposed strategies to strengthen TP for artificial intelligence, likewise consisting of 10 items. Data were collected with an online questionnaire to determine TP levels; the survey link delivered a 30-item form.
Responses used a five-point Likert format to record answers to the closed items, the common approach because it offers a clear, graded response continuum. For this scale, scores range from 1 to 5, representing the options from strongly disagree to strongly agree. In this coding, 5 denotes “ Strongly approve” and 1 denotes “strongly disapprove.” The five-point Likert scale was also applied in reverse for negatively worded statements, using an inverse key so that higher values always indicate higher TP after recoding. The scoring scheme is summarized in Table 2.
Table 2. Response categories for the five-point Likert scale.
|
Factor |
Standard evaluation |
Reverse scoring |
|
5 |
Strongly approve |
Strongly approve |
|
4 |
Approve |
Approve |
|
3 |
Neutral |
Neutral |
|
2 |
Disapprove |
Disapprove |
|
1 |
strongly disapprove |
strongly disapprove |
Addressing the first objective : To address the first objective, The research evaluated the level of TP linked to AI applications and systems among students from the University of Casablanca. Based on relative weights, levels of agreement, and item rankings, the findings point to a moderate level of TP. The overall score reached 66%, and itemlevel results are presented in Table 3.
Table 3. overall digital competence.
|
N (sample size) |
Mean (arithmetic mean) |
SD (standard deviation) |
V (variance) |
HM (hypothetical mean) |
DF (degrees of freedom) |
Ct-Test |
Tt-Test |
Significance Level |
|
600 |
97.80 |
25.00 |
625.00 |
90 |
599 |
7.65 |
1.96 |
0.05 |
From Table 3, the sample’s arithmetic mean on the digital proficiency scale exceeds the hypothetical mean, indicating that students do possess digital proficiency. The t-test further supports this conclusion: the computed t value (7.65) is greater than the critical value (1.96) at the 0.05 significance level, confirming a statistically significant difference between observed and hypothetical means.
Although students’ AI-related TP falls at a moderate level overall, several factors likely account for this: the sheer variety of AI applications; students’ dependence on unreliable information sources; limited specialized AI programs within the university; and insufficient faculty preparation to impart the necessary AI-related competencies. Added to this are gaps in structured guidance, including institutional support and the necessary infrastructure and material resources to teach AI and reinforce AI competence Accordingly, prior work recommends providing essential supports for educators most notably, fostering a pervasive digital culture in schools, universities, and society to empower both students and academics [23].
Second objective: What is the AI-related TP level among university students, and does it differ by specialization (scientific vs. humanities)?
-
3.4. Instrument Validation and Reliability Analysis
Although the Technological Proficiency questionnaire was previously validated [22], construct validity was reassessed in the present Moroccan sample to ensure measurement equivalence. An exploratory factor analysis (EFA) was conducted using principal axis factoring with varimax rotation.
The Kaiser–Meyer–Olkin (KMO) measure of sampling adequacy was 0.89, indicating excellent suitability for factor analysis. Bartlett’s test of sphericity was statistically significant (χ², p < 0.001), confirming that inter-item correlations were sufficient for factor extraction.
The analysis supported a three-factor structure consistent with the theoretical dimensions of the instrument (AI applications, AI-related skills, and enhancement strategies). Factor loadings exceeded 0.50 for the majority of items.
Internal consistency reliability was assessed using Cronbach’s alpha. The reliability coefficients were as follows:
-
• AI Applications dimension: α = 0.88
-
• AI Skills dimension: α = 0.91
-
• AI Enhancement Strategies: α = 0.87
-
• Overall scale reliability: α = 0.93
-
3.5. Proposed model
These findings indicate strong internal consistency and support the construct validity of the instrument within the Moroccan higher education context.
The proposed model for predicting University Students' Technological Proficiency (TP) related to Artificial Intelligence (AI) utilizes two classification algorithms: Support Vector Classifier (SVC); which is one of the most frequently used classification algorithms for supervised learning; and Gaussian Naive Bayes (GNB). The Naive Bayes approach represents an application of Bayes' theorem under an independence assumption that all feature variables are independent from one another; although "naive" in its assumptions about variable independence, it allows for fast and relatively accurate probabilistic classifications and serves as a good starting point (baseline) for many applications. Both methods use either the Bayes rule or the margin-based decision functions to provide the basis for the machine learning inference [24, 25]. The analysis will be conducted in a step-by-step process: 1) Collect data; 2) Preprocess data; 3) Build features; and 4) Classify.
-
a) Data collection: A total of 600 undergraduate students (years 1-4) at the University of Casablanca who were enrolled in both humanities and scientific disciplines completed a 30-questionnaire designed to measure their technological proficiency (TP) and specifically their technological proficiency relative to artificial intelligence (AI). The TP scale included three subscales of ten questions each. Each question utilized a 5-point Likert scale (1-5) to allow respondents to indicate how strongly they agreed or disagreed with each item on the scale. The survey was distributed through Google Classroom and the response rate was sufficient to result in 600 usable responses. Additionally, the data collected indicated that the vast majority of respondents were females, and most of them were enrolled in science majors. Histograms representing the distribution of gender and major type are presented in Figures 1 and 2 respectively.
-
b) Pre-processing stage: Preparing the raw survey data for modeling is essential to ensure reliable, accurate predictions. The pipeline included:
-
• Missing data: imputed nulls with each feature’s mode.
-
• Categorical encoding: models were trained only on the 17 selected questionnaire items; sex and specialization were excluded from predictors and used only for stratified analyses.
-
• Feature pruning: removed non-essential fields (e.g., timestamps) to simplify the dataset and reduce overfitting.
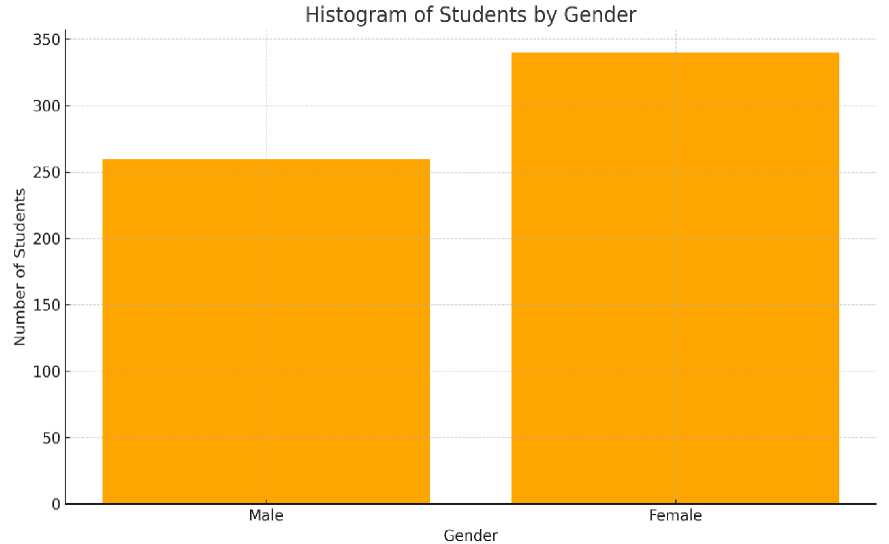
Fig. 1. Distribution of participants by gender in the TP sample.
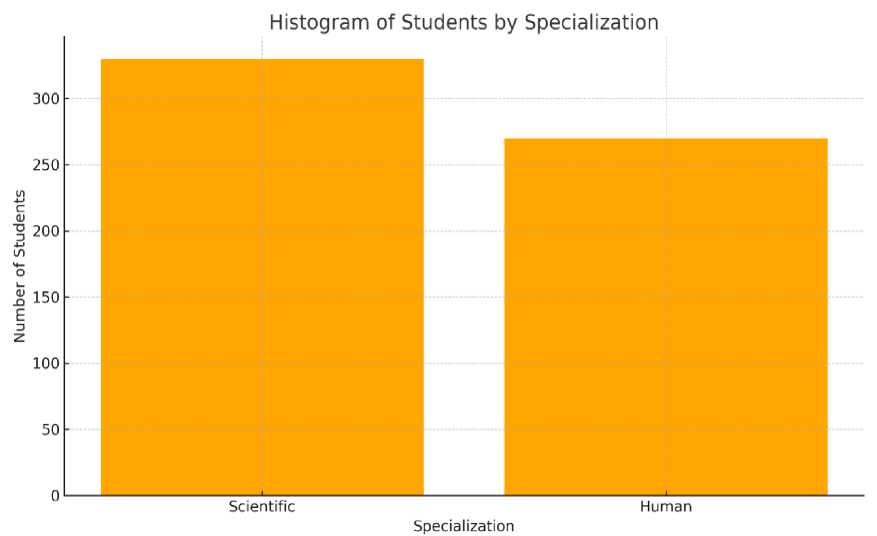
Fig. 2. Histogram of participants’ academic specialization in the TP dataset.
For the binary target, a threshold score of 90 defined the classes: records meeting or exceeding 90 were labeled “existing,” otherwise “not existing.” The finalized dataset contained 600 entries—380 “existing” and 220 “not existing” (Figure 3)—and was split 75%/25% by splitting the data into training and test partitions
To prevent information leakage, feature selection based on correlation analysis was performed exclusively on the training dataset after the 75%/25% split. The test set was strictly held out and used only for final model evaluation.
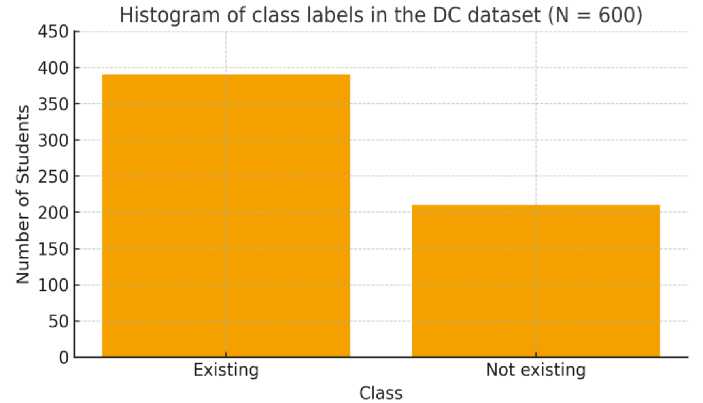
Fig. 3. Frequency distribution of TP class labels.
-
c) Feature construction stage: Because heterogeneous inputs can hinder predictive accuracy, we applied feature selection to isolate the most informative variables before modeling cutting noise, lowering costs, and limiting overfitting, in line with [26, 27]. The dataset comprised 30 questionnaire-derived features, grouped as follows:
-
• Features 1–10: TP for AI applications and systems items capturing students’ ability to use and interact with AI tools and platforms (e.g., information handling, speech recognition, AI-driven learning systems), emphasizing both understanding and hands-on application.
-
• Features 11–20: TP in skills required for AI items reflecting enabling digital skills, such as basic web design, integrating augmented reality and harnessing AI to facilitate independent learning
• Features 21–30: Suggested approaches to improve TP for AI items addressing institutional supports like professional development for teaching staff, curriculum redesign, and investment in infrastructure.
Each feature was rated on a 1–5 scale. To examine interrelationships, we computed Pearson correlation coefficients across features. Positive coefficients indicate that higher scores on one item tend to coincide with higher scores on the related item (see Figure 4). Multiple meaningful associations were observed; Table 4 lists the strongest correlations within each group.
Featurel -Що.32О.42О.49С'.440.420.420 340.370 430.460.390.500.470.470.410.430.450.360.430.330.450 460.350.480.450.410.500.560.510.56 Feature! -0.32^0.430.330.500.550.510.450.480.530.490.440.430.480.470.440.400.570.320.350.520.460.400.360.330.400.510.480.430.53^ Features -0.420.48^ 0.470.480.390.540.480.470.380.410.400.530.480.440.550.380.570.460.530.510.450 450.330.470.550.490390.430.54 Feature4 -0.490.330.47^0.420.390.500.450.420.530.450.460.440.510.440.490.540.560.470.410.360.550.550.400.490.440.580.500.330.450.62 Features -0.440.500.480.42^ 0.430.390.430.410.450.380.310.550.540.560.380.490.500.510.570.410.350.440.4403 50.460.450390.530Л1 Features -0.420.550.390390 ^зЩ0.5С0 5С036С'440.470.460.560.450.500.410 520.370 510.350 430.490 520.470.460350.570.450.460 52 Feature? -0320.510 540'5003 90.5c] 0370.510.460.410 5 30.460.430.430.500'430.470.370.560330.410.510.470.400.370.430.440.420 <8 Features-0.340.450.480.450.430.500.37^0.510.540.500.440.570.510.5003 50.330.370.460.380.380.380.390.450.400.510.390.390.520.50 Features -03 70.480.470 420.410360.510 51Щс 400.460.480.480360360.560.500.550 470.470 450.480 400.460.450.410.490390.430 550 56 FeaturelO-0.430.530.380.530.450.440.460.540.40^0.400.480.390.540.490.350.450.480.470.400.400.390.540.470.500.490.490.480.440.5зЩ Featurell -0.460.490.410.450.380.470.410.500.460.40^ 0.430.350.510.450.430.400.520.330.420.370.450.510.550.500.460.420.530460.580.57 Featured -0.390.440.400 460.310 460.530.440.480 480-3^0.470.470.510.530.360.410 470.430.390.360 470.360.490.410.360.460.410 490.62 Featured -0.500.430.530.440.550.5603 60.570.480.390.350.47^ 0.520.460.380.450.470.460.460.520.440.410.420.450.550.350.390.380.34^ Feature» -0.470.480.480 51':: 540 450.430 510.360.540.510.470.52^0.440.360 360.330 510.460.350.360 450.430.44G.410.460.5C0.530 44 Feature» -0.470.470.440.440.580.500.430 500.360 490.450.510.460 44^0 470 470.490'350.510.330.420.400.560.440.420.550.550.430 44 featured -0.410.44O.550.49C. 380 410.500.350.560.350.430.530.ЗЮ.36С 3^0 500.350.5503 76'390393350.410.380.380.440.530.40032 Featurel? -0.430300.380 540.490 520.430.330.500 450309.360.450.360370.56^0.396'310.480.5303 60 390399320.480.490.3403 70 44 Featurel8 -0.450.570.570.560.500.370.470.370.550.480.520.410.470.330.490.350 З'. Що 420.470.580.490.530.550.500.499.410.480.440.420.62 Feature» -0.360.320.460 470.510 510.370 460.470 470.330.470.460.510.350.550.410.42^0 380 420.499.400.550.460.340.490.410.320 45 Feature20 -0.430.350.530.410 570.350.560.380.470300320330.460360.510370380370.31 Jo.5003 30.410.370310.510.440.440.530.38^ РеаШге21 -0.330.520.510.360.410.430.330.380.450.400.370.390.520.350.330.490.530.5В0.420.50^0.450.490.450.510.490.430.440.470.4сЩ Feature22 -0.450.460.450.550.350 490.410.380.480.390.450.360.440.360.420.490 460.490 490.430 4'^0.370.450.460.320.450.490.490 480.61 Feature23 -0.460.400.450.550.440.520.510.390.400.540.510.470.410.450.400.450.390.530.400.410.490.37^0.450.500.500.390.380.430.45^ Feature24-0.350.360.330.400.440.470.470.450.460.470.550.360.420.430.560.410.490.550.550.370.450.450 45^ 0.550.440.370.490.500.570.63 5еаШге25 -0.480.330.470.490.350.460.400.400.450.500.500.490.450.440.440.380.420.500.460.410.510.460.5И.55^0.450.430.470.450.42^.б| Feature26 -0.450.4C0.550.440.460.350.370.510.410.490.460.410.550.410.420.380.480.490.340.510.490.320.500.440.4 9.5 30.510.470.47 [
Feature27 -0.410.510.490.580.450.570.430.390.490.490.420.360.350.460.550.440.490.410.490.440.430.450.390.370.430.53^0.430.420.37^ Feature28 -0.500.480.390 500.390'450.440.390.393'480.530.460.399.50O.55O.53O.34O.48O 410.440'440.499 380.499.470.510.4 Що.46О 41 Feature29 -0.560.430.430.330.530.460.420.520.430.440.460.410.380 5 30.430.400 470.440 320.5 30 470.499 430.5ГО.450.470.420.4б1 570.58
Feature30 -0.510.530.540 450.410.520.480.500.550.530.580.490.340.440.440.420.440.420.450.380.400.480.450.570.420.470.370.410.57^
Class-0.56 0.62 0.56^0.570.62 0.62 0.61 0.630.61 ^0.58
1.0
0.9
0.8
0.7
-0.6
-0.5
-0.4
£ □ га
£
£
ГП
£
tn ф
□ га
£
£
£
£ □ га
£
£
□ га
£
£ га
£
СП £
ГП
£
CU га
£
Ф га
CU га
£
сп
Ф
ф га £
ш
GJ
га
£
GJ
0) □ га £
га £
О)
°
О)
£
£
£
СП гч си
□ га £
ф га £
CU га
£
Ф
ф га £
N
£
О)
СП ф
'.Л га
О
£
Fig. 4. Distribution of Pearson correlations between features.
Table 4. Correlation Matrix of TP Features in Relation to AI Application Usage and Skill Indicators.
|
Group |
Key Insights |
Feature Pair |
Correlation Coefficient |
|
TP Related to AI Applications and Systems |
Core tasks in advanced computing draw on similar reasoning and transfer mechanisms. |
Feature 1 – Feature 2 |
0.32 |
|
Text-processing abilities align with pattern recognition, indicating complementary use. |
Feature 5 – Feature 7 |
0.47 |
|
|
Text-based methods connect with image and shape recognition in practical settings. |
Feature 5 – Feature 8 |
0.50 |
|
|
Tools designed for language processing help learning systems extract knowledge more effectively. |
Feature 5 – Feature 9 |
0.53 |
|
|
Both pattern recognition and knowledge extraction build on the same foundational competencies. |
Feature 8 – Feature 9 |
0.51 |
|
|
identifying patterns is closely associated with symbolic representations of information.. |
Feature 8 – Feature 10 |
0.48 |
|
TP Related to AI Skills |
Digital navigation underpins user-centered web-design work |
Feature 11 – Feature 12 |
0.45 |
|
Web-design skills relate to interaction design for automated systems. |
Feature 12 – Feature 16 |
0.49 |
|
|
Design proficiency overlaps with the application of predictive analytics. |
Feature 12 – Feature 17 |
0.47 |
|
|
Augmented-reality learning is associated with stronger issueresolution skills |
Feature13 – Feature15 |
0.52 |
|
|
Strong technical troubleshooting supports smoother and more effective interaction between humans and robots |
Feature15 – Feature16 |
0.47 |
|
|
autonomous learning promotes efficient use of digital tools, saving time and resources |
Feature18 – Feature20 |
0.55 |
|
|
Group 3: Enhancing TP for AI |
Faculty development aligns with curriculum updates and the expansion of digital learning. |
Feature 21 – Feature 25 |
0.62 |
|
Curriculum updates foster positive perceptions of emerging digital technologies. |
Feature 22 – Feature 28 |
0.44 |
|
|
Curriculum revision is coupled with expert guidance to build skills. |
Feature 22 – Feature 26 |
0.51 |
|
|
Infrastructure support goes hand-in-hand with expert involvement that accelerates competency growth. |
Feature 24 – Feature 28 |
0.56 |
|
|
Hands-on practice consolidates the acquisition of theoretical knowledge. |
Feature 26 – Feature 27 |
0.48 |
|
|
Cross-Group Correlations |
Text-processing capabilities fit well with immersive AR learning contexts. |
Feature 5 – Feature 13 |
0.49 |
|
Speech recognition is linked to text-processing in interactive systems. |
Feature 3 – Feature 5 |
0.52 |
|
|
Voice-to-system interaction depends on appropriate infrastructure. |
Feature 3 – Feature 25 |
0.46 |
|
|
Pattern-recognition skills benefit from specialized external mentoring |
Feature 8 – Feature 28 |
0.45 |
|
|
Collaboration with experts improves delegation and coordination of technology-related tasks. |
Feature 19 – Feature 28 |
0.50 |
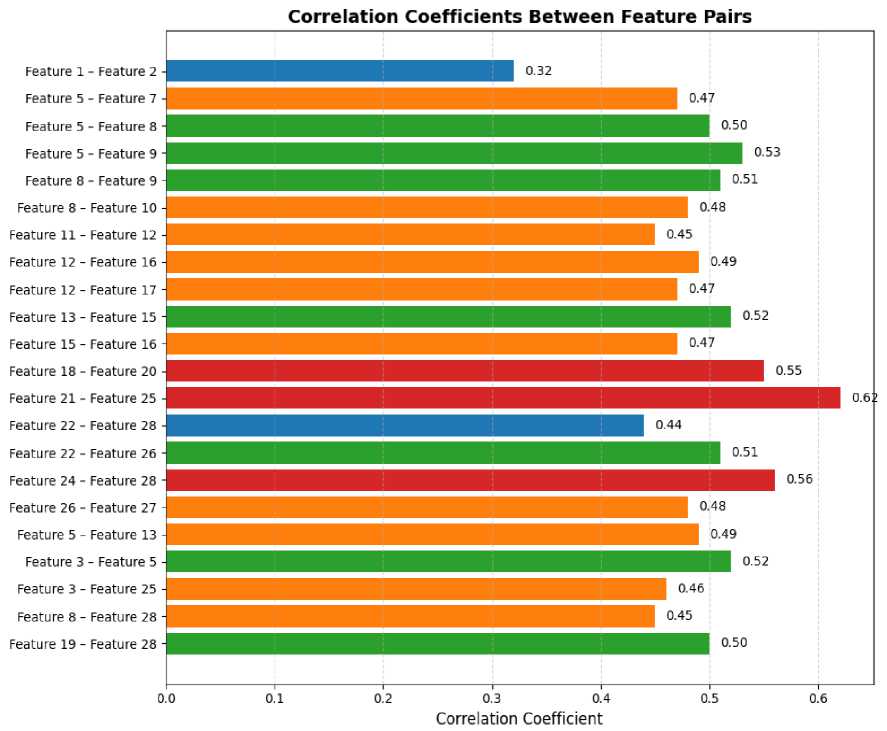
Fig. 5. Correlation analysis of TP features with application use and skill.
Table 5 lists the features most strongly associated with the target class (correlation ≥ 0.65) along with their names. 17 of the original 30 features were maintained for use during the predictive stage.
Table 5. The features contributing most to the model were preserved for classification.
|
Number of features |
Feature |
Correlation Coefficient |
|
Feature 13 |
I capture the timestamp and location linked to the issue. |
0.670432 |
|
Feature 14 |
I ensure my tasks are completed on time. |
0.689571 |
|
Feature15 |
I evaluate possible solutions based on available resources and constraints. |
0.701328 |
|
Feature 23 |
I compare proposed alternatives with the time and resources required. |
0.671245 |
|
Feature 26 |
I adapt my approach using hands‑on practice and reflection. |
0.671983 |
|
Feature 27 |
I apply feedback from previous experiences to enhance future performance. |
0.660248 |
|
Feature 28 |
I set a forward-looking path for my long-term development |
0.731546 |
|
Feature 21 |
I check each alternative’s consequences against what I aim to achieve. |
0.709823 |
|
Feature 16 |
I interact with automated or robotic systems to solve tasks. |
0.702134 |
|
Feature 17 |
I apply predictive/analytical methods to support decisions. |
0.702975 |
|
Feature 19 |
I self‑learn using AI‑based resources to improve performance. |
0.690417 |
|
Feature 2 |
I recognize and process speech or audio information with AI tools. |
0.671083 |
|
Feature 3 |
I handle and structure digital information using AI applications. |
0.672191 |
|
Feature6 |
I integrate digital and AI tools to optimize task efficiency. |
0.731247 |
|
Feature 5 |
I use natural language processing tools to extract information. |
0.660371 |
|
Feature 7 |
I recognize patterns and shapes in data using AI tools. |
0.754122 |
|
Feature 10 |
I combine multiple data sources to support informed decision-making. |
0.741803 |
The 17 selected features were standardized (scaled using each feature’s standard deviation). This step is vital in many ML workflows because it:
-
• Puts features on a comparable scale so none dominate distance-based calculations.
-
• Speeds up convergence of optimization algorithms.
-
• Often boosts performance for distance- or margin-based models.
-
• Improves interpretability of coefficients and feature effects.
-
• Eases integration of data from varied sources.
-
• Resolves inconsistencies arising from different measurement units.
In short, standardization helps models train more reliably and efficiently, while improving predictive quality and readability of results.
-
d) Classification and evaluation : A feature vector of 17(most informative) items derived from the questionnaire was used for classification. Two algorithms—Support Vector Classifier (SVC) and Gaussian Naïve Bayes (GNB)— were applied. The dataset (N = 600) was split into 75/100 training and 25/100 testing.
-
4. Results and Discussion
-
4.1. Classification with SVC on the selected features
-
To address potential overfitting concerns due to the high classification accuracy (above 94%), we additionally performed a repeated stratified 10-fold cross-validation procedure on the full dataset (N = 600). Class proportions were preserved across folds. The Support Vector Classifier achieved a mean cross-validated accuracy of 96.6% (SD = 0.9%) with AUROC = 0.966, while the Gaussian Naïve Bayes model obtained a mean accuracy of 94.6% (SD = 1.1%) with AUROC = 0.955. These cross-validated estimates are consistent with the held-out 75/25 test results, indicating stable performance and reducing concerns of overfitting.
Precision, Recall, F1-Score, Support, Accuracy, Specificity, and Area under the ROC curve (AUC) are used as various metrics to assess the proposed method's performance. Multiple metrics are necessary to be sure the developed system fulfills the objectives it was designed to fulfill. Precision and Recall assist in evaluating how well the system identifies positive cases, and provide insight into the trade-off between False Positives and False Negatives. The F1-Score provides a Harmonic Mean of Precision and Recall, which provides a single metric to measure both characteristics. The Specificity of the System evaluates how well the system identifies Negative Cases, and the AUC measures the Systems' ability to distinguish between two classes. The evaluation metrics will support data-driven decisions regarding the selection of models, enable consistent comparison among the use of different models, and will also be useful in identifying areas of weakness within the system and guiding future improvement.
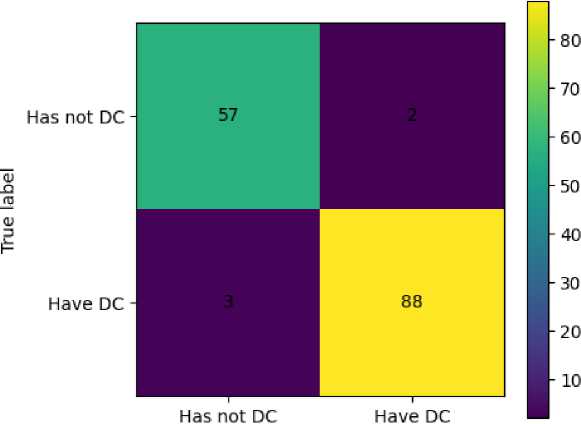
Using the 17 most informative features, the Support Vector Classifier (SVC) produced the results summarized in Table 6. The confusion matrix for the test set is shown in Figure 6, and the ROC curve with its AUROC is presented in Figure 7.
Table 6. SVC Performance comparison of SVC across metrics.
|
Metric |
Class 0 (Haven not TP) |
Class 1 (Have TP) |
Summary |
|
Precision |
0.9500 |
0.9778 |
Macro: 0.9639 | Weighted: 0.9669 |
|
Recall |
0.9661 |
0.9670 |
Macro: 0.9666 | Weighted: 0.9667 |
|
F1-Score |
0.9580 |
0.9724 |
Macro: 0.9652 | Weighted: 0.9667 |
|
Support |
59 |
91 |
Total: 150 |
|
Specificity |
0.9661 |
||
|
AUROC |
0.9666 |
||
|
Accuracy |
0.9667 |
Predicted label
Fig. 6. Test-set confusion matrix for the SVC classifier.
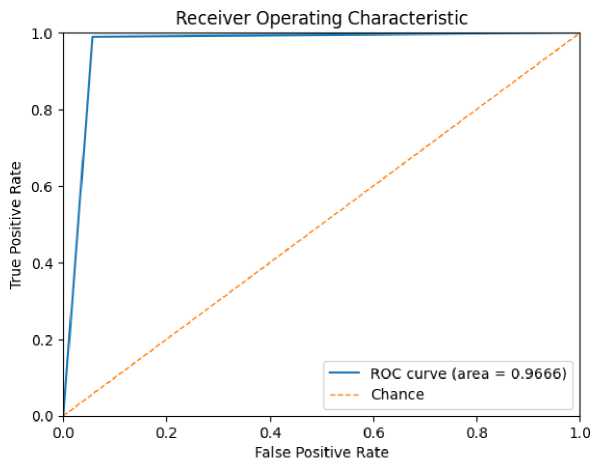
Fig. 7. ROC curve (AUROC) for the SVC classifier.
-
4.2. Classification with Gaussian Naïve Bayes (GNB)
-
4.3. Statistical comparison between classifiers
-
4.4. Distribution by gender and specialization
Table 7 reports the GNB results using the 17 selected features. The test-set confusion matrix is shown in Figure 8, and the ROC curve (AUROC) appears in Figure 9.
Table 7. GNB Performance comparison of GNB across metrics.
|
Metric |
Class0 (Haven not TP ) |
Class1 ( Have TP ) |
Summary |
|
Precision |
0.8806 |
1.0000 |
- Macro: 0.9403 - Weighted: 0.9530 |
|
Recall |
1.0000 |
0.9121 |
- Macro: 0.9560 - Weighted: 0.9467 |
|
F1-Score |
0.9365 |
0.9540 |
- Macro: 0.9453 - Weighted: 0.9471 |
|
Support |
59 |
91 |
Total: 150 |
|
Specificity |
1.0000 |
||
|
AUROC |
0.9560 |
||
|
Accuracy |
0.9467 |
Fig. 9. ROC curve (AUROC) using GNB.
To determine whether the performance difference between SVC and GNB was statistically significant, a paired statistical test was conducted on the repeated stratified 10-fold cross-validation accuracy scores. A paired t-test revealed that the difference in mean accuracy between SVC and GNB was statistically significant (p < 0.01). This result confirms that the superior performance of the SVC model is unlikely to be due to random variation and reflects a meaningful improvement in predictive capability.
Table 8 provides the breakdown of AI-related TP across student groups, stratified by gender and by academic track (scientific vs. humanities).
Table 8. Participant gender by class.
|
Participant Gender |
Academic specialization |
Class = 1 (Has TP ) |
Class = 0 (Has no TP ) |
Row Total |
|
Female |
Scientific |
150 |
50 |
200 |
|
Female |
Human |
94 |
46 |
140 |
|
Male |
Scientific |
75 |
55 |
130 |
|
Male |
Human |
61 |
69 |
130 |
|
Total |
380 |
220 |
600 |
5. Conclusion
The results indicate that a sizeable proportion of students have not yet achieved a high level of AI-related digital competence. Out of 600 participants, 380 , approximately 63.3% the predefined threshold that signals sufficient proficiency, whereas 220 around 36.7 % fell short of that benchmark. Taken together, these figures point to an overall competence level that is best described as moderate rather than advanced. This pattern strengthens the case for expanding both pedagogical initiatives and institutional support aimed at lifting students from a basic or intermediate grasp of AI-related skills to a more robust, practice-ready level.
Predictive analysis using the fourteen most informative features reveals both classification methods used — support vector classifier (svc) and Gaussian Naïve Bayes (gnb) — are well suited to determine students' competence categories. the svc had an overall accuracy rate of 96.7% and was equally precise for each class category with respect to recall and precision and f-score. the high auroc indicates that the model reliably ranks positive instances above negative ones, which is strong evidence of its ability to separate those who meet the competence threshold from those that do not. although the gnb model had reasonable results, they were nonetheless less than the svc model. this order of results is consistent with margin-based classification models' strengths when there exists sufficient structure in the signal to allow for clear decision boundaries.
Upon further investigation of subgroups systematic differences by gender and academic track were identified. female students who were enrolled in science programs tended to have higher competence scores than their counterparts in humanities fields, and they also outperformed them. rather than attributing these differences to inherent ability, it appears more plausible that exposure and opportunity explain the pattern. specifically, science curricula often include computational practice, structured laboratory work, and project-based learning where students routinely interact with data, algorithms, and digital tools. availability of resources (e.g. up-to-date software, guided labs, mentorship), and practical training opportunities, appear central in translating interest into measurable competence. these findings reiterate the importance of creating learning environments that provide repeated, supported opportunities for students to apply ai concepts in authentic tasks.
In order to promote ai-related technological proficiency at scale, a coordinated set of interventions is warranted:
• Curriculum design and integration
• Faculty development and instructional support
• Infrastructure, access, and learning resources
• Assessment, feedback, and student support
6. Limitations and Future Research
Going forward, future research should expand the evidence base and improve the discrimination of predictions. expanding the sample to additional institutions of higher education would help to identify whether the present distribution of competence is general or context-specific. comparing across different pedagogies (e.g. project-based vs lecture-centric programs; institutions with differing levels of digital infrastructure) could help to identify the conditions under which teaching time yields greatest skill acquisition. on the modeling side, testing other machine-learning approaches (e.g. tree-based ensembles, calibrated probabilistic classifiers) may improve discrimination and yield better-calibrated probabilities for decision making. finally, investigating the factors most highly associated with competence acquisition (prior coursework, cumulative time on task, access to mentoring, etc.) will help to clarify where targeted investment has the greatest potential returns.
Despite the contributions of this study, several limitations should be acknowledged. First, the study relied on a convenience sampling strategy through Google Classroom announcements. Although the sample size (N = 600) is statistically adequate, voluntary participation may have introduced self-selection bias. Students who are more digitally engaged or more interested in artificial intelligence tools may have been more inclined to respond, potentially leading to an overestimation of technological proficiency levels. Second, the study was conducted within a single Moroccan public university. Institutional characteristics such as infrastructure availability, faculty digital readiness, and curricular orientation may influence students’ AI-related technological proficiency. Therefore, caution should be exercised when generalizing the findings to other higher education institutions within Morocco or internationally.
Third, technological proficiency was operationalized using a self-reported Likert-scale questionnaire. While construct validity and internal consistency were confirmed, self-report measures may be influenced by social desirability bias or subjective perception. Objective performance-based assessments could provide complementary insights.
Additionally, although differences were observed across gender and academic specialization, the study did not directly measure variables related to instructional exposure, access to digital infrastructure, or prior AI training. Therefore, interpretations linking these differences to exposure and opportunity should be considered cautiously as contextual hypotheses rather than empirically verified causal explanations. Future research should incorporate explicit exposure-related variables to better understand the mechanisms underlying these disparities.
Fourth, the dichotomization of proficiency using a predefined threshold simplifies interpretation but may reduce information variability. Future studies may consider modeling proficiency as a continuous construct or using data-driven threshold estimation approaches.
Future research should expand the empirical scope by including multiple universities across different Moroccan regions to enhance external validity and allow comparative institutional analysis. A multi-site design would enable investigation of contextual factors influencing AI-related technological proficiency. Longitudinal studies are also recommended to examine how students’ proficiency evolves over time, particularly in response to curricular reform or increased exposure to AI-integrated pedagogies.
From a methodological perspective, future work could incorporate alternative machine-learning approaches such as ensemble methods, cross-validated modeling strategies, and calibration analysis to evaluate robustness and predictive stability. Additionally, incorporating behavioral or performance-based measures of AI interaction would strengthen measurement precision.
Finally, future research should integrate explanatory variables related to exposure, training intensity, access to digital infrastructure, and prior computational experience in order to better understand the mechanisms underlying gender and disciplinary differences observed in this study.
All the Declarations and StatementsAuthor Contributions Statement
Abdelilah Chahid – Conceptualization, methodology, investigation, data analysis, writing – original draft, project administration, supervision.
Khalifa Mansouri – Supervision, funding acquisition, project administration.
All authors have read and agreed to the published version of the manuscript.
Conflict of Interest Statement
The author declares no conflict of interest.
Funding Declaration
None.
Data Availability Statement
The data supporting the findings of this study were anonymized prior to analysis to protect participant privacy and are not publicly available. Aggregated data may be made available by the author upon reasonable academic request and subject to institutional approval.
Ethical Declarations
This study involved human participants in an educational setting. All data were anonymized prior to analysis to ensure participant confidentiality and privacy. The study was conducted in accordance with institutional ethical guidelines and educational research standards.
Acknowledgments
The author gratefully acknowledges the students who participated in this study and the academic colleagues and reviewers whose constructive comments and professional feedback contributed to improving the clarity, rigor, and overall quality of this research.
Declaration of Generative AI in Scholarly Writing
During the preparation of this manuscript, generative AI tools were used to assist with language refinement, grammar improvement, and structural organization. All research design, data collection, statistical analysis, interpretation, and academic conclusions were developed independently by the author. The author assumes full responsibility for the content.
Abbreviations
The following abbreviations are used in this manuscript:
TP - Technological Proficiency
AI - Artificial Intelligence
ML - Machine Learning
NLP - Natural Language Processing
SVC - Support Vector Classifier
GNB - Gaussian Naïve Bayes
AUROC - Area Under the Receiver Operating Characteristic Curve
EFA - Exploratory Factor Analysis
KMO - Kaiser-Meyer-Olkin
Cronbach’s α - Cronbach's Alpha
Likert scale - Likert Scale
SVM - Support Vector Machine
F1-Score - F1-Score (Harmonic Mean of Precision and Recall)
CI - Confidence Interval
TPM - Technological Proficiency Measurement
TPR - True Positive Rate
FPR - False Positive Rate
Appendix
None.
