
PLOA: Priority based Task Scheduling using LOA for Cloud Computing
Journal: International Journal of Intelligent Systems and Applications @ijisa
Article in issue: 5 vol.18, 2026.
Free access
Task scheduling plays an important role in cloud computing, as it directly affects makespan, resource utilization, and energy consumption in data centers. With the increasing scale of cloud infrastructures, reducing energy usage and operational cost while maintaining efficient task execution has become a key research challenge. In this work, we propose a priority-aware task scheduling approach based on the Lion Optimization Algorithm (Priority-LOA), which includes both VM priorities and task priorities, which are modelled using the LOA. It is designed to minimize energy usage and power costs in data centers, ensuring efficient task-to-VM mapping. To achieve this, VM and task priorities are first computed and then we apply LOA to optimize energy consumption, makespan, power cost and resource utilization. The proposed scheduler is implemented in the SimPy simulation and evaluated using Google Cloud Jobs workloads ranging from 100 to 1000 tasks with task size 15,000 to 900,000. Experimental results demonstrate that the proposed Priority-LOA-based scheduler achieves near-optimal makespan by 42% and 56.63%, resource utilization by 54% and 109.70%, energy consumption by 31.74% and 41.78% and cost by 31.74% and 41.78% compared to Genetic Algorithm (GA) and Particle Swarm Optimization (PSO).
Short address: https://sciup.org/15020669
IDS: 15020669 | DOI: 10.5815/ijisa.2026.05.01
Text of the scientific article PLOA: Priority based Task Scheduling using LOA for Cloud Computing
Cloud computing[1] is a briskly evolving field that offers shared computational resources[2], such as storage, servers and applications, across the internet on demand. The organizations can increase or decrease their computing needs based on their requirements without the expense of investing in expensive hardware and software by using this technology. However, scheduling and managing tasks in a cloud environment may be complex because of the dynamic characteristics of the system, where processing capabilities are concurrently accessed by multiple users[3]. In cloud computing, TS is the allocation of tasks to a set of VMs in a cloud environment. It is a critical problem in cloud computing as efficient task scheduling can increase the efficiency of cloud systems by decreasing makespan MS[4], decreasing Energy Consumption (EC) and increasing Resource Usage (RU). To develop solutions for job scheduling issues in cloud computing efficiently[5], optimization techniques are used. These include mathematical programming, heuristics, metaheuristics and ML algorithms. To solve the formulation of the problem of job scheduling, mathematical programming can be used which uses algorithms like linear programming or integer programming by treating it as an optimization problem. Heuristics are the thumb rules that provide quick solutions to the problem but may not always be optimal [6,7]. To find the efficient solutions to challenging optimization problems [8,9], metaheuristics like simulated
This work is open access and licensed under the Creative Commons CC BY 4.0 License.
annealing or genetic algorithms can be used. ML algorithms, such as neural networks or decision trees, can be designed to learn patterns from previous data and perform predictions on future task scheduling.
Many optimization algorithms have been presented with an objective of resolving task scheduling challenges in cloud computing. ACO algorithm [10,11], a metaheuristic algorithm that is motivated by the behavior of ant colonies is one among the algorithms. One of the critical optimization difficulties in cloud computing is task scheduling, where the ACO algorithm has been efficiently implemented. Besides that, PSO[12], a population-based optimization algorithm that replicates the social behavior of birds or fish, has also been utilized for tackling the TS problem in cloud environments. PSO has been employed for addressing various optimization problems, including TS in cloud computing. The ML-based approaches have also been presented in addition to the metaheuristic algorithms. They help in solving the TS problem in cloud computing. As an example, a neural network-based approach was presented to predict the task execution time in cloud environments, which helps to optimize the scheduling decisions. Scheduling tasks efficiently is central to the operation of cloud computing platforms as it helps to increase RU, decrease response times and maximize overall system efficiency. It helps manage the computing resources effectively by the organizations by reducing costs and improving competitiveness. The TS algorithms will continue to evolve to fulfill the shifting demands of users and organizations as there is a huge need for cloud computing. Although several metaheuristic and hybrid schedulers have been proposed, most existing works either optimize a single objective (makespan or energy) or rely on outdated baselines such as GA and PSO evaluated on synthetic workloads. Moreover, the interaction between task priorities, VM energy efficiency, and multi-objective trade-offs remains insufficiently explored.
The main contributions of this work are as follows
• A priority-aware task scheduling model that explicitly defines task and VM priorities based on computational demand and energy cost.
• Multi-objective scheduling formulation targeting makespan, energy consumption, resource utilization, and operational cost.
• An adaptation of the Lion Optimization Algorithm (LOA) for discrete task–VM mapping with enhanced exploration–exploitation balance.
• A comparative evaluation against GA and PSO using SimPy simulations under varying workload sizes.
2. Related Works
3. Proposed System Architecture
4. Proposed PLOA
The authors of [13] have introduced a cutting-edge approach that optimizes TS in cloud computing systems using WOA. It addresses the challenges raised by the expanding utilization of cloud services and the critical need for efficient RU. WOA intends to decrease the MS and EC while increasing RU. The authors have analyzed the efficacy of the algorithm by performing various experiments on task sets and cloud computing scenarios. As per the results in comparison with the existing algorithm, the proposed WOA algorithm achieves superior performance with parameters MS and EC and maintains high RU. It enhances the efficiency of TS in cloud computing systems. However, the issue of cost is not addressed in this study. In [14], the authors have presented a hybrid EDA-GA algorithm. It mainly focuses on concurrently achieving three key objectives: reducing EC, reducing MS and increasing RU. It uses EDA for learning probability distribution of high-quality solutions, which are designed to produce a set of candidate solutions. The initial population is formed by candidate solutions, upon which the Genetic Algorithm (GA) applies evolutionary operators to evolve a new generation of solutions. The performance of EDA-GA was evaluated by conducting various experiments using benchmark datasets and the results have outperformed existing methods related to solution quality and convergence speed. Authors of [15] have proposed a CPSO approach. The advantages of Cuckoo search and PSO algorithms were being combined by CPSO. The proposed CPSO algorithm helps in reducing the task completion time and task rejection rate while maximizing RU. The tasks are encoded and resources are used as solutions in a population by CPSO. It also uses crossover and mutation operations to develop new solutions and improve convergence towards Pareto front. Studies confirm that the proposed algorithm in TS outperforms the other advanced methods that are currently available by conducting various experiments. In [16], authors implemented AdPSO algorithm, which is an adaptive approach that adjust the metrics of PSO algorithm dynamically by using feedback mechanisms. Various factors like task deadline, resource availability and load balancing are considered to perform scheduling efficiently by using fitness function. The authors evaluated the performance of AdPSO by conducting simulations and the results outperformed the existing algorithms with respect to RU, MS and task completion time. In paper [17], the authors implemented ELHHO algorithm that incorporates elitism and learning that improves the performance of HHO algorithm. A diverse set of elite solutions and a learning mechanism were employed by ELHHO to boost performance by improving exploration and exploitation capabilities of the HHO. Various simulations have been performed and the results shown that the ELHHO exceeds several modern algorithms noted for rapid convergence and robust solution quality. The algorithm provides an efficient solution for cloud computing TS, reducing EC and maximizing RU while minimizing MS.
Table 1. Comparison of different scheduling algorithms with various parameters
|
Ref. |
Algorithm |
Mak espa n |
Cost |
Reso urce utiliz ation |
Dead line |
Ener gy cons umpt ion |
Resp onse time |
Exec ution time |
Wait ing time |
Load balan ce |
Com pleti on Time |
Fault toler ance |
SLA |
Simulation |
|
[14] |
EDA-GA |
- |
- |
- |
- |
- |
- |
- |
✓ |
✓ |
- |
- |
cloudsim |
|
|
[15] |
CPSO |
✓ |
✓ |
- |
- |
- |
- |
- |
- |
- |
- |
- |
✓ |
cloudsim |
|
[18] |
CR-PSO |
✓ |
✓ |
- |
- |
✓ |
- |
- |
- |
- |
- |
- |
cloudsim |
|
|
[19] |
CSA |
✓ |
- |
- |
- |
- |
- |
- |
- |
- |
- |
- |
cloudsim |
|
|
[20] |
QOS-ACO |
- |
✓ |
- |
- |
- |
- |
- |
✓ |
✓ |
- |
- |
cloudsim |
|
|
[21] |
GASIS |
✓ |
- |
- |
- |
✓ |
- |
- |
- |
- |
- |
- |
MATLAB |
|
|
[22] |
BTS |
- |
✓ |
- |
✓ |
- |
- |
- |
- |
- |
- |
- |
cloudsim |
|
|
[23] |
MR-LBA |
- |
✓ |
- |
- |
- |
- |
✓ |
- |
- |
- |
- |
- |
cloudsim |
|
[24] |
HEFT-ACO |
✓ |
✓ |
- |
- |
- |
- |
- |
- |
- |
- |
- |
- |
cloudsim |
|
[25] |
MFTGA |
- |
✓ |
- |
- |
✓ |
- |
✓ |
- |
- |
- |
✓ |
✓ |
cloudsim |
|
[26] |
HSGA |
✓ |
✓ |
- |
- |
- |
✓ |
- |
- |
- |
- |
- |
- |
cloudsim |
|
[27] |
AC-PSO |
✓ |
✓ |
✓ |
- |
- |
- |
- |
- |
- |
- |
- |
- |
cloudsim |
|
[28] |
JRA-ACO–GA |
- |
- |
✓ |
- |
- |
- |
- |
- |
- |
- |
- |
- |
cloudsim |
Table 1 provides a comprehensive overview of different scheduling algorithms, which have been evaluated based on a variety of parameters. Although previous studies have focused on a single performance index such as MS, cost, and energy consumption, none have examined the combined impact of MS, energy consumption, RU, and overall power usage and cost in data centers. As a result, there is a clear need to address this gap in the current literature. To address this issue, we have developed a scheduler that utilizes the Lion Optimization algorithm[29] to optimize MS, RU, energy consumption and cost.
Fig. 1. Proposed PLOA architecture
The proposed framework for task scheduling in cloud computing is illustrated in Figure 1 above. At the initial stage, a set of tasks, represented as Tn = {T1, T2, T3 …..Tn}, are submitted to the cloud console, which in turn forwards them to the task manager module. In this architecture, the task manager (Figure 2) calculates the priorities of tasks and virtual machines based on electricity / unit cost. This is important because the tasks that arrive on the cloud platform exhibit varying characteristics and need to be mapped to appropriate virtual machines in the cloud. The task scheduler is responsible for carrying out this process to ensure efficient resource allocation.
The focus of this research is to develop an effective solution for job scheduling in cloud computing environments and reduce the makespan, which is the time duration to finish all tasks. Therefore, a lion should be assigned to each underlying solution. A lion is a solution for scheduling tasks that is made by randomly assigning cloudlets (tasks) to virtual machines, or VMs i.e., computing resources deployed on physical hosts, tailored to meet multiple objectives in the equation specified above.
The lion population is initially formed by randomly selecting parameters across the solution space. Once the population is generated, we determine the priorities of VMs and tasks. These priorities are then used to evaluate the makespan, resource utilization, and energy consumption parameters. Subsequently, we compute the fitness function for the lion population, following the multi-objective optimization approach, to identify the lion with the highest fitness value. This value represents both the makespan of the solution and the best solution found. Finally, we arrange the identified solutions in ascending order.
Initially, the cloud consumer submits the tasks to the console and these tasks are sent to the task manager; the task manager will allocate the priorities by computing the properties of both tasks and VMs, which then is submitted to the task scheduler.
-
4.1. Task Manager
The proposed architecture entails task scheduling at both the task manager Fig. 2 and VM levels. Our objective is to efficiently allocate resources by computing the priorities of both tasks and VMs. This is crucial because tasks vary in size and processing capabilities, and not all tasks require the same amount of computational power. Therefore, our goal is to send each task to a VM that is best suited to handle it. In addition, the priority of each VM is determined by the electricity price / unit cost in the relevant data center. The main objective of this approach is to reduce both the makespan (MS) and energy consumption (EC) and cost at the data centers by scheduling a specified no. of tasks onto a certain no. of VMs based on the priorities of both.
The scheduler is responsible for querying the resource manager to determine the provision of resources to handle forthcoming tasks. The resource manager, in turn, will assess the pending and active tasks in the virtual machine to provide an estimate of resource availability. The scheduler will then use this information to assign tasks to suitable VMs. A load balancer component is also linked to the resource manager, which helps to distribute tasks in case a large influx of tasks is deployed to the VMs. As per a predefined threshold value, the load balancer will evaluate the system load and determine whether it is balanced, under-loaded or overloaded. To calculate the priorities of tasks and VMs, it is necessary to first identify the no. of VMs that are active and their current level of load.
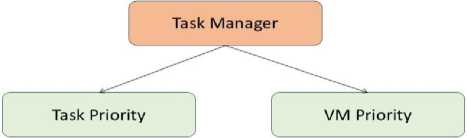
Fig. 2. Task manager
Overall VM load is represented as follows.
m
LoadVM= ∑ CLvm
i=1
where m is the total no. of VMs, Load VM is the total amount of load placed on those VMs and CLvm represents the current load on virtual machines.
After evaluating the load on all VMs, we must also evaluate the capacity of the physical hosts, as all VMs will reside within them.
L
ph
LoadVM k ∑ h k
Lph represents the VM load on the physical host. In the cloud computing paradigm, it becomes necessary to incorporate a load balancing module to handle an increasing no. of tasks arriving at the cloud interface. As virtual machines (VMs) are unable to process requests or tasks, the load-balancing module helps in migrating tasks to the next available VM using the same physical server through the creation of a new instance or transferring the task to the next active virtual machine. The load-balancing module is responsible for establishing a specific threshold value to determine if the system is balanced or imbalanced. This process helps in achieving a balanced system and can be accomplished by effectively using a load balancer.
Threshold value can be calculated as follows
Thr l =L ph *h k
Once the threshold value is calculated, we compute the load balance of the system to ascertain whether it is balanced, under-loaded, or overloaded. Overloading is calculated as follows.
Parameter | Details |
Dataset Name | GoCJ Dataset |
Number of Tasks | 100-1000 |
Task Length | 15000-900000 Computational units |
Number of VMs | 100 |
Simulation Tool | SimPy |
Operating System | Windows11 |
Processor | Intel i7 |
GA and PSO are used as baseline metaheuristics due to their widespread adoption in earlier cloud scheduling literature. To ensure a fair and unbiased comparison, Genetic Algorithm (GA) and Particle Swarm Optimization (PSO) baselines were implemented using the same task priority and virtual machine priority models as the proposed LOA- based scheduler. In all cases, the same fitness function, defined in Section 4.2, was employed, and the optimization objectives, normalization strategy, and weight assignments were kept identical.
5.2. Makespan
Makespan is an important parameter that is used to assess the performance of a distributed system in cloud computing. It is the duration of time consumed to finish a set of tasks and it directly influences the system’s efficacy and cost effectiveness. Several factors can affect the completion time of tasks, including task complexity, the no. of tasks, available computing resources, and communication overhead between computing nodes.
Table 3. Makespan for tasks 100–350
Algorithm /Number of tasks | Priority-LOA | GA | PSO |
100 | 300.8 | 390.8 | 654.49 |
150 | 344.89 | 482.57 | 584.59 |
200 | 353.6 | 552.02 | 717.13 |
250 | 376.26 | 502.88 | 711.59 |
300 | 389.29 | 698.54 | 929.06 |
350 | 414.92 | 694.63 | 1098.43 |
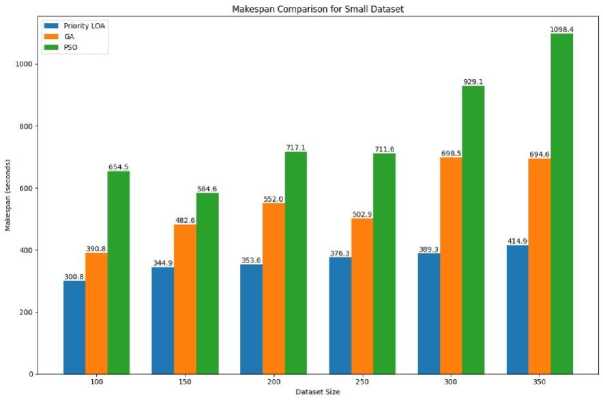
Fig. 5. Makespan for tasks 100–350
Table 3 and Figure 5 present the makespan comparison of PLOA, GA, and PSO for 100–350 tasks. For 100 tasks, PLOA achieves 300.8 sec, compared to 390.8 sec for GA and 654.49 sec for PSO. For 150 tasks the PLOA achieves 344.89 sec compared to 482.57 for GA and 584.59 for PSO. At 200 tasks, the makespan is 353.6 sec (PLOA), 552.02 sec (GA), and 717.13 s (PSO). Similarly, for 250 tasks the PLOA achieves 376.26 sec compared to 502.88 sec for GA and 711.59 for PSO. Priority-LOA takes 389.29 seconds to finish 300 tasks, while GA and PSO take 698.54 seconds and 929.06 seconds, respectively. At 350 tasks, Priority-LOA gets 414.92 seconds, which is a lot less than GA (694.63 seconds) and PSO (1098.43 seconds). These results show that Priority-LOA always has a shorter execution time and better scalability than the baseline algorithms.
Table 4. Makespan for tasks 400–650
Algorithm /Number of tasks | Priority-LOA | GA | PSO |
400 | 426.56 | 785.32 | 1003.5 |
450 | 447.11 | 839.15 | 1178.41 |
500 | 455.14 | 918.72 | 1250.95 |
550 | 513.07 | 963.4 | 1486.33 |
600 | 506.79 | 1089.38 | 1206.82 |
650 | 533.31 | 1048.25 | 1329.04 |
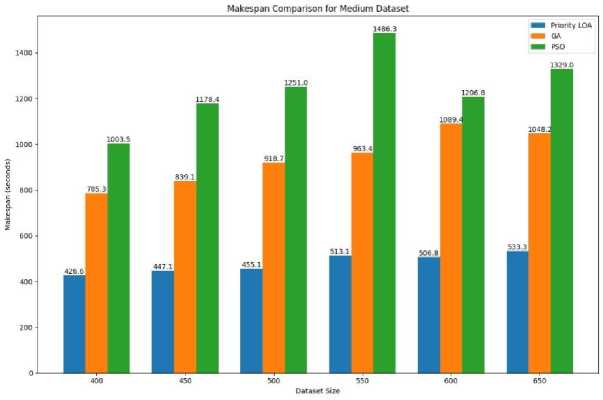
Fig. 6. Makespan for tasks 400–650
Table 4 and Figure 6 provide a comparative analysis of makespan performance among Priority-LOA, Genetic Algorithm (GA), and Particle Swarm Optimization (PSO) for task sets ranging from 400 to 650. Priority-LOA takes 426.56 seconds for 400 tasks, while GA takes 785.32 seconds and PSO takes 1003.5 seconds. The makespan for 450 tasks is 447.11 s for Priority-LOA, 839.15 s for GA, and 1178.41 s for PSO. When the number of tasks goes up to 500, Priority-LOA takes 455.14 seconds, while GA and PSO take 918.72 seconds and 1250.95 seconds, respectively. Priority-LOA gets 513.07 s at 550 tasks, which is a lot less than GA (963.4 s) and PSO (1486.33 s). Priority-LOA gets 506 s for 600 tasks, while GA gets 1089.38 s and PSO gets 1206 s. For 650 tasks, PLOA gets 533.31 s, while GA gets 1048.25 s and PSO gets 1329.04 s. These results show that Priority-LOA always has shorter execution times and better scalability than the baseline algorithms.
Table 5. Makespan for tasks 700–1000
Algorithm /Number of tasks | Priority-LOA | GA | PSO |
700 | 555.77 | 1095.77 | 1405.6 |
750 | 609.08 | 1237.3 | 1557.57 |
800 | 631.79 | 1095.62 | 1512.47 |
850 | 702.86 | 1190.66 | 1718.49 |
900 | 766.04 | 1347.22 | 1611.26 |
950 | 791.71 | 1503.77 | 1675.69 |
1000 | 835.14 | 1676.3 | 1835.58 |
Dataset Size
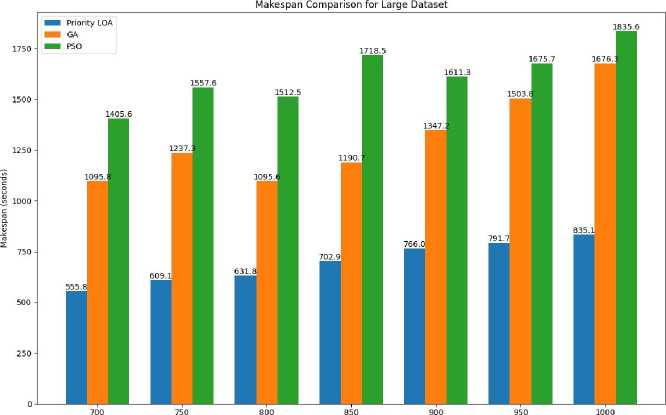
Fig. 7. Makespan for tasks 700–1000
Table 5 and Figure 7 show the makespan comparison for heavier workloads (700–1000 tasks). With 700 tasks, Priority-LOA gets 555.77 seconds, which is much faster than GA (1095.77 seconds) and PSO (1405.6 seconds). Priority-LOA takes 631.79 seconds for 800 tasks, while GA and PSO take 1095.62 seconds and 1512.47 seconds, respectively. When there are 900 tasks to do, Priority-LOA gets 766.04 s, while GA gets 1347.22 s and PSO gets 1611.26 s. Priority-LOA records 835.14 s at 1000 tasks, which is much better than GA (1676.3 s) and PSO (1835.58 s). These results show that Priority-LOA still has a big performance edge and works better when scheduling a lot of tasks at once.
5.3. Energy Consumption
Energy use is an important part of judging how well cloud computing systems work. Cloud computing needs big data centers that use a lot of energy to run the computers and cool the rooms. These data centers use a lot of energy, which can have a big effect on the environment and the cost of running them. People usually use Power Usage Effectiveness (PUE) and Data Center Infrastructure Efficiency (DCIE) to measure how energy-efficient cloud computing systems are. These parameters show how much energy the computing and cooling systems use compared to how much energy other systems in the data center use. By improving system design and hardware setups, cloud computing systems can use less energy, which lowers costs and has less of an effect on the environment.
Table 6. Energy for tasks 100–350
Algorithm /Number of tasks | Priority-LOA | GA | PSO |
100 | 3935130.38 | 5142760 | 7694084.66 |
150 | 4984174.01 | 6780703 | 7673997.28 |
200 | 5499577.9 | 7907672 | 9565214.62 |
250 | 5973968.92 | 7561857 | 9549414.97 |
300 | 6943229.24 | 10688903 | 12835331.8 |
350 | 7675674.71 | 11017950 | 15186764 |
Table 6 and Figure 8 show energy consumption (in Joules) Priority-LOA, GA, and PSO use for workloads of 100 to 350 tasks. As expected, energy usage increases with workload size for all algorithms; however, Priority-LOA consistently consumes significantly less energy. For 100 tasks, Priority-LOA requires 3.94 × 10⁶ J, compared to 5.14 × 10⁶ J for GA and 7.69 × 10⁶ J for PSO. At 200 tasks, the energy use for Priority-LOA goes up to 5.50 × 10⁶J , while for GA and PSO, it goes up to 7.91 × 10⁶ J and 9.57 × 10⁶ J, respectively. At 300 tasks, the performance gap is even bigger. Priority-LOA uses 6.94 × 10⁶ J, which is much less than GA (1.07 × 10⁷ J) and PSO (1.28 × 10⁷ J). At 350 tasks Priority-LOA records 7.68 × 10⁶ J, whereas GA and PSO consume 1.10 × 10⁷ J and 1.52 × 10⁷ J, respectively. This represents a substantial reduction in energy usage, which shows that Priority-LOA not only speeds up execution time but also makes it more energy-efficient, making it better for cloud scheduling environments that are aware of energy use on a large scale.
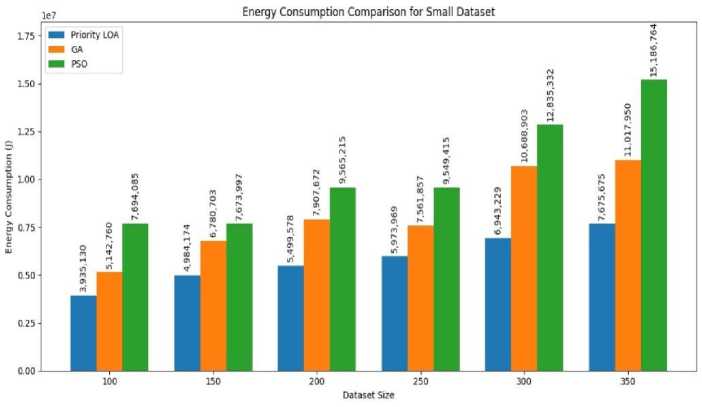
Fig. 8. Energy Consumption for tasks 100–350
Table 7. Energy for tasks 400–650
Algorithm /Number of tasks | Priority-LOA | GA | PSO |
400 | 8223804.11 | 12511415 | 14527723.2 |
450 | 8717668.19 | 13432716 | 16462835.7 |
500 | 9549158.43 | 14841321 | 18226950.3 |
550 | 10604237.2 | 15828881 | 20895251.1 |
600 | 11414186.6 | 17965474 | 19145926.6 |
650 | 12203612.8 | 18206108 | 20792076.9 |
Dataset Size
Fig. 9. Energy consumption for tasks 400–650
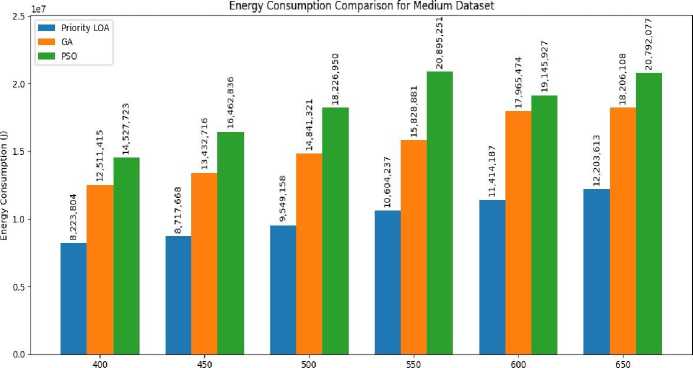
Table 7 and Figure 9 present the energy consumption (in Joules) of Priority-LOA, GA, and PSO for workloads ranging from 400 to 650 tasks. Energy usage increases progressively with task volume for all algorithms; however, Priority-LOA consistently demonstrates significantly lower consumption. At 400 tasks, Priority-LOA consumes 8.22×10⁶ J, compared to 1.25×10⁷ J for GA and 1.45 × 10⁷ J for PSO. When the workload increases to 500 tasks, energy consumption rises to 9.55 × 10⁶ J for Priority-LOA, while GA and PSO require 1.48×10⁷ J and 1.82×10⁷ J, respectively. At 600 tasks, Priority-LOA records 1.14×10⁷ J, significantly lower than GA (1.80×10⁷ J) and PSO (1.91×10⁷ J). Similarly, at 650 tasks, Priority-LOA consumes 1.22×10⁷ J, whereas GA and PSO consume 1.82 × 10⁷ J and 2.08 × 10⁷ J, respectively. These results confirm that Priority-LOA maintains substantial energy savings as workload scales, reinforcing its effectiveness for energy-aware cloud task scheduling in large-scale environments.
Table 8. Energy for tasks 700–1000
Algorithm /Number of tasks | Priority-LOA | GA | PSO |
700 | 12411446.3 | 18494445 | 21701012.1 |
750 | 14113327.6 | 21328755 | 24137060.2 |
800 | 14129459.5 | 19443697 | 23406189.1 |
850 | 15460774.3 | 21004693 | 26257683.7 |
900 | 17296650.3 | 23874981 | 26260032.7 |
950 | 17362644.5 | 25341905 | 26916498.4 |
1000 | 18740961 | 28117687 | 29449356.5 |
Table 8 and Figure 10 present the energy consumption (in Joules) of Priority-LOA, GA, and PSO for large-scale workloads ranging from 700 to 1000 tasks. As task volume increases, energy consumption rises for all algorithms; however, Priority-LOA consistently maintains the lowest energy usage. At 700 tasks, Priority-LOA consumes 1.24 × 10⁷ J, compared to 1.85 × 10⁷ J for GA and 2.17 × 10⁷ J for PSO. For 800 tasks, Priority-LOA records 1.41 × 10⁷ J, while GA and PSO require 1.94 × 10⁷ J and 2.34 × 10⁷ J, respectively. When the workload increases to 900 tasks, Priority-LOA consumes 1.73 × 10⁷ J, significantly lower than GA (2.39×10⁷ J) and PSO (2.63×10⁷ J). At 1000 tasks, energy consumption reaches 1.87×10⁷ J for Priority-LOA, whereas GA and PSO consume 2.81×10⁷ J and 2.94×10⁷ J, respectively. These results demonstrate that Priority-LOA sustains substantial energy savings under heavy workloads, confirming its scalability and suitability for energy-aware large-scale cloud scheduling.
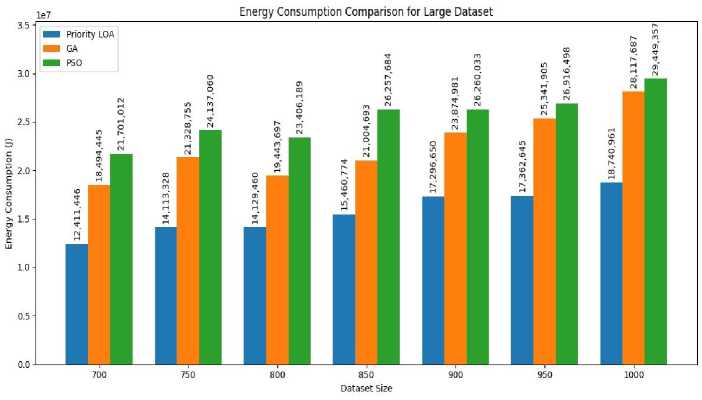
Fig. 10. Energy Consumption for tasks 700–1000
5.4. Resource Utilization
Resource utilization serves as a critical indicator used in evaluating the performance of cloud computing systems. It measures the degree to which available computational resources, such as CPU, memory, and storage, are being utilized by the system. In a well-optimized cloud computing system, resources should be used efficiently to avoid underutilization, which leads to wasted resources, or overutilization, which can cause performance issues.
Table 9. Resource Utilization for tasks 100–350
Algorithm /Number of tasks | Priority-LOA(%) | GA(%) | PSO(%) |
100 | 20.55 | 21.06 | 11.71 |
150 | 29.68 | 27.01 | 20.85 |
200 | 37.02 | 28.83 | 22.25 |
250 | 39.18 | 33.58 | 22.8 |
300 | 52.24 | 35.35 | 25.44 |
350 | 56.66 | 39.08 | 25.51 |
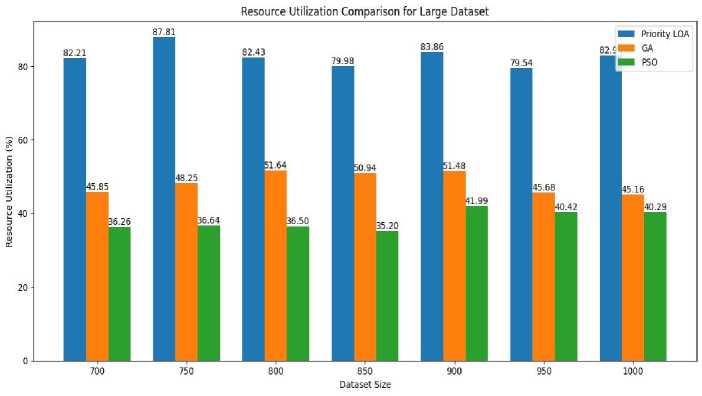
Fig. 11. Resource Utilization for tasks 100–350
Table 9 and Figure 11 represent the resource utilization (%) comparison of Priority-LOA, GA, and PSO for workloads ranging from 100 to 350 tasks. Priority-LOA consistently achieves higher utilization across all workload sizes. At 100 tasks, Priority-LOA records 20.55% utilization, slightly lower than GA (21.06%) but significantly higher than PSO (11.71%). As workload increases to 200 tasks, utilization improves to 37.02% for Priority-LOA, compared to 28.83% for GA and 22.25% for PSO. At 300 tasks, Priority-LOA achieves 52.24% utilization, substantially
Table 10. Resource Utilization for tasks 400–650
Algorithm /Number of tasks | Priority-LOA(%) | GA(%) | PSO(%) |
400 | 61.86 | 39.54 | 29.85 |
450 | 63.32 | 40.05 | 26.47 |
500 | 73.21 | 41.03 | 30.47 |
550 | 71.12 | 42.87 | 27.06 |
600 | 83.48 | 43.28 | 39.1 |
650 | 85.89 | 49.12 | 37.63 |
Table 10 and Figure 12 present the resource utilization (%) comparison of Priority-LOA, GA, and PSO for workloads ranging from 400 to 650 tasks. Priority-LOA consistently achieves significantly higher utilization than the baseline algorithms as task volume increases. At 400 tasks, Priority-LOA records 61.86% utilization, compared to 39.54% for GA and 29.85% for PSO. When the workload increases to 500 tasks, utilization improves to 73.21% for Priority-LOA, whereas GA and PSO achieve 41.03% and 30.47%, respectively. At 600 tasks, Priority-LOA reaches 83.48%, substantially outperforming GA (43.28%) and PSO (39.10%). Similarly, at 650 tasks, Priority-LOA attains 85.89%, while GA and PSO reach only 49.12% and 37.63%, respectively. These results demonstrate that Priority-LOA significantly enhances resource utilization under medium-to-large workloads, confirming its superior efficiency and scalability in cloud task scheduling.
Table 11. Resource Utilization for tasks 700–1000
Algorithm /Number of tasks | Priority-LOA(%) | GA(%) | PSO(%) |
700 | 82.21 | 45.85 | 36.26 |
750 | 87.81 | 48.25 | 36.64 |
800 | 82.43 | 51.64 | 36.5 |
850 | 79.98 | 50.94 | 35.2 |
900 | 83.86 | 51.48 | 41.99 |
950 | 79.54 | 45.68 | 40.42 |
1000 | 82.94 | 45.16 | 40.29 |
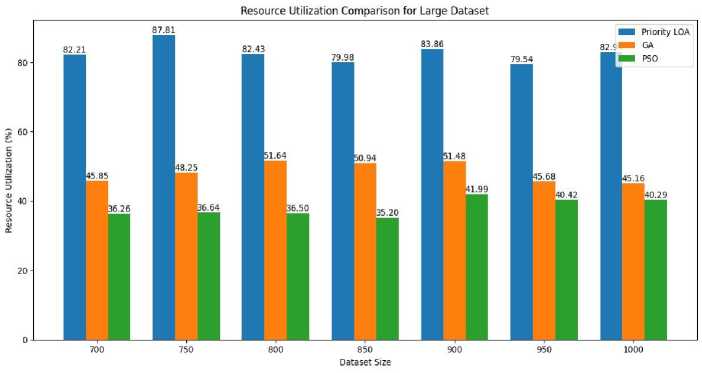
Fig. 13. Resource Utilization for tasks 700–1000
Table 11 and Figure 13 show the percentage of resource usage for Priority-LOA, GA, and PSO when dealing with large workloads that range between 700 and 1000 tasks. Priority-LOA keeps its resource utilization much higher than the other two algorithms throughout. When handling 700 tasks, Priority-LOA reaches 82.21% utilization. In comparison, GA achieves 45.85%, while PSO lags behind at 36.26%. Priority-LOA stays strong with 82.43% utilization even for 800 tasks, whereas GA records 51.64%, and PSO manages just 36.50%. When the tasks rise to 900, Priority-LOA achieves 83.86% utilization. This is much better compared to GA at 51.48% and PSO at 41.99%. With an increase to 1000 tasks, Priority-LOA keeps a utilization rate of 82.94%, while GA and PSO reach 45.16% and 40.29%. These results show that Priority-LOA achieves better resource use during heavy workloads. It demonstrates great scalability and efficient resource assignment in large cloud scheduling setups.
5.5. Cost
The results for power costs come from a calculated metric based on total energy used and a set electricity rate. The model assumes a direct link between energy use and cost, so lowering power costs shows the energy saved by the proposed scheduler. It does not serve as a different goal to optimize.
Table 12. Cost for tasks 100–350
Algorithm /Number of tasks | Priority-LOA | GA | PSO |
100 | 0.131171 | 0.171425 | 0.256469 |
150 | 0.166139 | 0.226023 | 0.2558 |
200 | 0.183319 | 0.263589 | 0.31884 |
250 | 0.199132 | 0.252062 | 0.318314 |
300 | 0.231441 | 0.356297 | 0.427844 |
350 | 0.255856 | 0.367265 | 0.506225 |
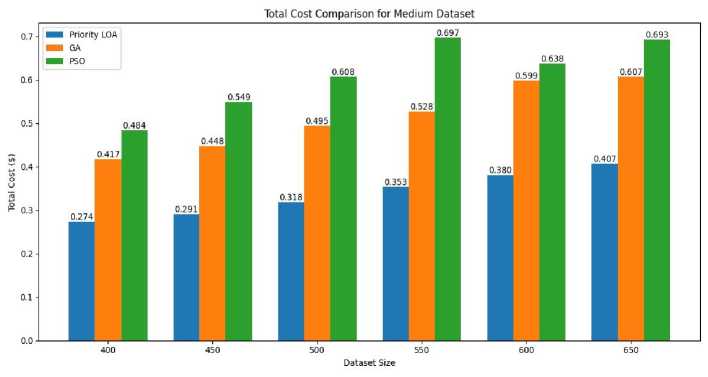
Fig. 14. Cost for tasks 100–350
Table 13. Cost for tasks 400–650
Algorithm /Number of tasks | Priority-LOA | GA | PSO |
400 | 0.274127 | 0.417047 | 0.484257 |
450 | 0.290589 | 0.447757 | 0.548761 |
500 | 0.318305 | 0.494711 | 0.607565 |
550 | 0.353475 | 0.527629 | 0.696508 |
600 | 0.380473 | 0.598849 | 0.638198 |
650 | 0.406787 | 0.60687 | 0.693069 |
Total Cost Comparison for Medium Dataset
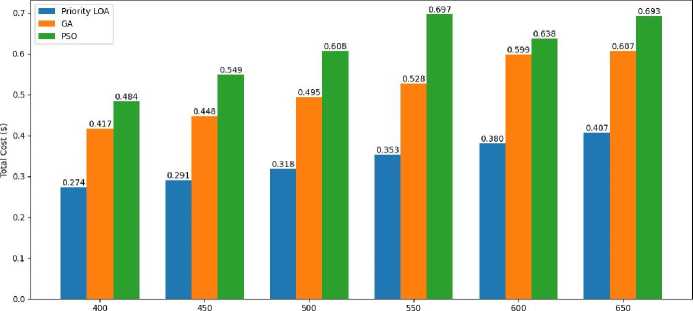
Fig. 15. Cost for tasks 400–650
Table 14. Cost for tasks 700–1000
Algorithm /Number of tasks | Priority-LOA | GA | PSO |
700 | 0.413715 | 0.616482 | 0.723367 |
750 | 0.470444 | 0.710959 | 0.804569 |
800 | 0.470982 | 0.648123 | 0.780206 |
850 | 0.515359 | 0.700156 | 0.875256 |
900 | 0.576555 | 0.795833 | 0.875334 |
950 | 0.578755 | 0.84473 | 0.897217 |
1000 | 0.624699 | 0.937256 | 0.981645 |
Total Cost Comparison for Small Dataset
100 150 200 2 50 300 350
Dataset Size
Fig. 16. Cost for tasks 700–1000
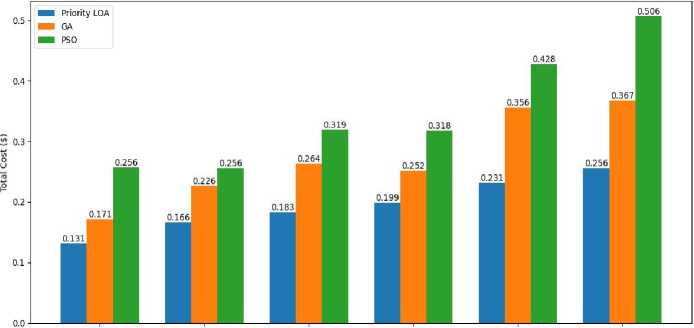
Tables 12–14 and Figures 14–16 represent the comparison of costs (in $) for Priority-LOA, GA, and PSO when handling workloads ranging from 100 to 1000 tasks. As workload size grows, the operational costs go up for all the algorithms. Still, Priority-LOA maintains the lowest cost across all workload sizes. For 100 tasks, Priority-LOA costs
$0.131171, while GA costs $0.171425, and PSO costs $0.256469. When the workload increases to 300 tasks, the cost for Priority-LOA goes up to $0.231441. For the same workload, GA incurs $0.356297 and PSO $0.427844. When dealing with heavier workloads, the difference in results stays noticeable. With 600 tasks, Priority-LOA shows a cost of $0.380473 much less than GA’s $0.598849 and PSO’s $0.638198. For 900 tasks, the cost for Priority-LOA moves to $0.576555, while GA and PSO show costs of $0.795833 and $0.875334. When handling a maximum of 1000 tasks, Priority-LOA logs $0.624699. In comparison, GA and PSO reach $0.937256 and $0.981645. These results clearly demonstrate that Priority-LOA consistently reduces operational cost and maintains superior economic scalability under increasing task loads.
Table 15. Performance of Priority-LOA over GA and PSO
Tasks | Makespan(%) | Energy Consumption(%) | Resource Utilization(%) | Cost(%) | ||||
Over GA | Over PSO | Over GA | Over PSO | Over GA | Over PSO | Over GA | Over PSO | |
100 | 23.03 | 54.04 | 23.48 | 48.86 | -2.42 | 75.49 | 23.48 | 48.86 |
150 | 28.54 | 41 | 26.49 | 35.05 | 9.89 | 42.38 | 26.49 | 35.05 |
200 | 35.94 | 50.69 | 30.45 | 42.5 | 28.4 | 66.38 | 30.45 | 42.5 |
250 | 25.18 | 47.12 | 21 | 37.44 | 16.68 | 71.84 | 21 | 37.44 |
300 | 44.27 | 58.09 | 35.04 | 45.91 | 47.78 | 105.36 | 35.04 | 45.91 |
350 | 40.27 | 62.22 | 30.33 | 49.47 | 45.02 | 122.16 | 30.33 | 49.47 |
400 | 45.68 | 57.49 | 34.27 | 43.39 | 56.43 | 107.26 | 34.27 | 43.39 |
450 | 46.72 | 62.06 | 35.1 | 47.05 | 58.11 | 139.24 | 35.1 | 47.05 |
500 | 50.46 | 63.62 | 35.66 | 47.61 | 78.41 | 140.25 | 35.66 | 47.61 |
550 | 46.74 | 65.48 | 33.01 | 49.26 | 65.91 | 162.84 | 33.01 | 49.25 |
600 | 53.48 | 57.99 | 36.47 | 40.38 | 92.91 | 113.49 | 36.47 | 40.38 |
650 | 49.12 | 59.87 | 32.97 | 41.3 | 74.85 | 128.27 | 32.97 | 41.31 |
700 | 49.29 | 60.46 | 32.89 | 42.81 | 79.33 | 126.67 | 32.89 | 42.81 |
750 | 50.77 | 60.9 | 33.83 | 41.53 | 82.02 | 139.52 | 33.83 | 41.53 |
800 | 42.34 | 58.23 | 27.33 | 39.63 | 59.64 | 125.81 | 27.33 | 39.64 |
850 | 40.97 | 59.09 | 26.39 | 41.13 | 57.02 | 127.22 | 26.39 | 41.13 |
900 | 43.14 | 52.46 | 27.55 | 34.14 | 62.9 | 99.74 | 27.55 | 34.14 |
950 | 47.35 | 52.75 | 31.49 | 35.49 | 74.15 | 96.77 | 31.49 | 35.49 |
1000 | 50.18 | 54.5 | 33.35 | 36.36 | 83.65 | 108.47 | 33.35 | 36.36 |
Table 15 represents performance of Priority-LOA over GA and PSO. Across workload sizes ranging from 100 to 1000 tasks, Priority-LOA achieves an average performance improvement of 42.92% and 56.63% in makespan, 31.74% and 41.78% in energy consumption, 54.09% and 109.70% in resource utilization, and a cost reduction of 31.74% and 41.78% over GA and PSO, respectively, thereby demonstrating superior scalability, computational efficiency, resource effectiveness, and economic performance under increasing task loads.
6. Conclusion
In Cloud Computing, managing task scheduling can be a challenging task because of the constantly changing nature of incoming tasks on the cloud. To ensure that these tasks are allocated to appropriate VMs, an efficient scheduler is required to allocate them appropriately. While many earlier researchers have focused on minimizing makespan as the key objective of a task scheduler, this objective alone may not be sufficient. Our work presents the development of a multi-objective task scheduler that utilizes the Lion Optimization Algorithm to address makespan, cost, resource utilization, and energy consumption in Cloud Computing. The scheduler takes into account task and VM priorities to allocate tasks to the most suitable VMs. We have tested our algorithm using the SimPy simulation tool with GoCJ dataset workloads as inputs. Our results indicate that our Priority-LOA Scheduler outperforms both GA and PSO algorithms in terms of makespan, Resource utilization, Cost in data centers, and energy consumption. As part of future work, we intend to extend this study by integrating reinforcement learning algorithms to enable adaptive learning and improved optimization of the system.
All the Declarations and StatementsAuthor Contributions Statement
Pillareddy Vamsheedhar Reddy: Conceptualization, Methodology, Software Implementation.
Tippani Gayathri: Data Analysis, Writing Original Draft Preparation.
All authors have read and agreed to the published version of the manuscript.
Conflict of Interest Statement
The authors declare that they have no conflict of interest.
Funding Declaration
This research received no external funding.
Data Availability Statement
The data supporting the findings of this study are available from the corresponding author upon reasonable request.
Ethical Declarations
This study does not involve human participants or animals.
Acknowledgments
The authors sincerely thank the reviewers and the editor for their valuable comments and suggestions, which helped to improve the quality of this manuscript.
Declaration of Generative AI in Scholarly Writing
AI-assisted tools were used only for language refinement and proofreading. The authors take full responsibility for the content of this manuscript.
Abbreviations
The following abbreviations are used in this manuscript:
PSO - Particle Swarm Optimization
GA - Genetic Algorithm
VM - Virtual machines
LOA -Lion Optimization Algorithm
MS -Makespan
RU - Resource Utilization
TS -Task Scheduling
ACO -Ant colony Optimization
EC - Energy Consumption
