Pre-service Teachers' Self-Directed Learning in a Blended Learning Environment: A Study on Scale Development and Affecting Factors

Author: Thuy P. Kieu, Binh T.T. Tran, Anh D.P. Pham
Journal: International Journal of Modern Education and Computer Science @ijmecs
Article in issue: 2 vol.18, 2026.
Free access
The implementation of Blended Learning (BL) in teacher training, which demands learners to have high autonomy and complete tasks independently in an online environment, has established self-directed learning (SDL) a prerequisite for success. However, traditional SDL scales primarily focus on psychological attributes in face-to-face settings, often failing to capture the unique self-regulatory and technological dimensions required in a BL environment. While online readiness scales exist, they frequently treat SDL as a single dimension rather than a multidimensional competency essential for pre-service teachers. To address this gap, the study developed and validated a new SDL scale, specifically tailored to pre-service teachers in a BL context. Based on established theoretical frameworks (e.g. SDLI, AMS, and PRO), the study conducted a pilot survey (N=183) and a main survey (N=1,041) with pre-service teachers. The scale was validated through Cronbach’s Alpha, EFA (using SPSS), and a PLS-SEM model to ensure reliability, convergent validity, and discriminant validity. The results established an SDL scale consisting of 7 core factors, suitable for BL context. Furthermore, the model identified 4 key factors, explaining 67.4% of the variance in SDL. These factors include: Awareness (Student awareness), Community (Community interaction), Tech (Technology competence), and Year (School year). Notably, demographic variables such as Gender and Major were determined to have no statistically significant effect on SDL. These findings provide a valid assessment tool and a robust explanatory model, allowing educators and administrators to design effective pedagogical interventions, focusing on factors that can directly impact and improve core SDL competencies for the next generation of teachers.
Scale Design, Self-Directed Learning Readiness, Blended Learning, Pre-service Teachers, Education
Short address: https://sciup.org/15020230
IDR: 15020230 | DOI: 10.5815/ijmecs.2026.02.02
Text of the scientific article Pre-service Teachers' Self-Directed Learning in a Blended Learning Environment: A Study on Scale Development and Affecting Factors
In the context of higher education, Blended Learning (BL) has become a prevalent educational model, intentionally integrating face-to-face (F2F) and online learning activities. The success of this model depends significantly on preservice teachers' ability to learn proactively. This underscores the centrality of Self-Directed Learning (SDL). SDL is defined as a process in which individuals take the initiative, with or without support from others, to diagnose learning needs, set goals, identify resources, select and implement appropriate learning strategies, and self-evaluate their learning outcomes [1].
The relationship between BL and SDL is reciprocal, with BL providing an ideal environment for the development of SDL, and SDL being a critical factor for pre-service teachers' success in BL environments. However, a methodological challenge has arisen: traditional SDL measurement tools, which were designed for Face-to-Face (F2F) contexts, exhibit significant limitations when applied to BL environments. Existing instruments adapted for online learning typically focus on technical readiness or general motivation, lacking the specific integration of personal responsibility and digital self-monitoring needed by pre-service teachers. This cohort requires a specialized instrument because they are not only learners but future architects of digital learning environments. Furthermore, these scales are not designed to capture unique aspects of SDL in digital environments, such as the ability to self-monitor online or interact in virtual learning communities. This gap is particularly acute for pre-service teachers, who are not only learners experiencing BL but also future educators who will implement these pedagogical models. The lack of a validated and contextualized SDL scale for pre-service teachers in BL environments has hindered the efforts of training institutions in accurately assessing and designing effective pedagogical interventions. Therefore, developing a scale to assess SDL in BL environments and identifying factors affecting SDL not only helps improve training quality but also contributes to the development of an effective and sustainable BL model.
Therefore, this study pursues two objectives: (1) To develop and validate a new SDL scale, specifically designed for pre-service teachers in the context of BL, based on the integration of contemporary theoretical frameworks; and (2) To develop and validate a model of key factors affecting the SDL of this cohort.
This study is structured as follows. Section 2 provides a comprehensive literature review and outlines the study's contribution. Section 3 details the methodology, explaining the procedures for data collection, processing, and analysis. Section 4 presents the analysis and validation of the proposed scale and examines the factors affecting the SDL of preservice teachers. Section 5 discusses the findings and recommends applications. Finally, Section 6 provides the conclusion.
2. Literature Review
BL is defined as a form of teaching that intentionally integrates traditional F2F teaching and computer-mediated instruction/online learning [2, 3]. In Graham’s view, BL is seen as a convergence of two historically separate models: F2F learning environments and technology-supported distributed learning environments. This perspective emphasizes the shift from separate learning systems to a more integrated model. In a similar vein, but with a broader perspective, Abrosimova et al. describe BL as a flexible model that combines diverse elements such as formal and informal learning, F2F learning and independent self-study, using modern technology alongside traditional methods [4]. Fundamentally, BL is not a mechanical combination of two forms of teaching and learning [5] but a deep, intentional integration where F2F and online activities complement each other to optimize the learning experience [4]. Recent studies also identify factors that influence learners' readiness to participate in the BL model, including students' ability to adapt and work independently [6], autonomy and sense of belonging [7], proficiency in information and communication technology (ICT) [8] and demographic factors such as gender, age, ethnicity, and field of study [9]. Effective implementation also requires instructors to develop diverse forms of assessment (e.g., project assignments, online tests, and final exams) to enrich the learning experience, while maintaining continuous support for learners (particularly in models like the flipped classroom) [10]. In addition, material and institutional factors, such as support policies and the readiness of information technology (IT) infrastructure, also play an important role in promoting SDL in the BL model [11].
Alongside the development of new teaching models, SDL is increasingly recognized as a core competency that learners need to possess in the 21st century, especially in the context of lifelong learning [12]. The concept of SDL was first introduced by Malcolm S. Knowles in his classic work. Knowles defines SDL as “a process in which individuals take the initiative, with or without the help of others, in diagnosing their learning needs, formulating goals, identifying human and material resources for learning, choosing and implementing appropriate learning strategies, and evaluating learning outcomes” [13]. This approach places learners at the center, assigning them primary responsibility for their own learning, while reshaping the role of the teacher from a transmitter of knowledge to a facilitator, coordinator, and enabler [14].
The scientific community has witnessed a significant increase in research and scholarly interest in SDL. As a result, many new tools and resources have been proposed to measure SDL competencies and assist educational researchers in developing curricula, teaching methods, and learning materials. Among the most popular scales for assessing students' SDL, the SDL Readiness Scale (SDLRS) developed by Guglielmino in 1977 is considered the most prominent [15]. The SDLRS has been used in numerous research studies, including more than 90 doctoral dissertations. It has been translated into 22 languages and used in more than 40 countries. The adult form of the SDLRS, or the Learning Preference Assessment (LPA), has been used by more than 500 major organizations worldwide, especially in the medical field. The scale has been applied in various contexts, including studies by Zachariah et al. in the pharmaceutical industry [16], Barnes (nursing) [17], K. Premkumar in the medical environment in India [18]. However, the scale has faced critical reviews regarding its limitations, with studies indicating that Guglielmino's scale is structurally unstable and invalid [19] and its overall value remains debated [20]. Therefore, many studies have subsequently sought to develop, identify, or restructure measurement factors to suit specific practices or professions. Examples include M. Fisher's scale in nursing [21], an SDL scale in problem-based learning [22], the Online Learning
Readiness Scale (OLRS), which includes SDL as a dimension [23], and a Self-rating scale of self-directed learning in higher education [24]. This diversification suggests that a general SDL scale may no longer be appropriate, and that context-adapted instruments are needed.
While SDL in traditional (F2F) learning environments is a core factor determining learning effectiveness, in BL environments, the level of readiness for SDL becomes even more important, as most of the learning tasks must be performed independently by students in an online environment. Research by Steinberg et al. (2024) also shows that student-directed learning environments (a characteristic of SDL supported by BL) help maintain a positive reciprocal relationship between academic self-concept and better learning outcomes than a completely teacher-directed learning environment [30]. Furthermore, Khalid et al. provide empirical evidence that online students have higher levels of SDL and a stronger correlation between SDL and academic achievement than students in F2F contexts [31]. However, SDL competence is not only a result but also a necessary condition for students to study effectively in a BL environment. The BL environment requires students to self-manage their time, self-monitor their progress and maintain motivation to study without direct and regular supervision from the instructor. Without these competencies, students are likely to procrastinate, lose direction, feel isolated or confused by the amount of information and self-study requirements [32, 33]. Therefore, implementing BL without assessing or supporting SDL may lead to academic risks for students. Some recent studies have also proposed adding Learner Presence [34], and emphasized the role of self-regulation, a core aspect of SDL [35].
The diversification of SDL instruments suggests that a general scale is no longer sufficient. For instance, while the OLRS includes SDL as a dimension, it focuses heavily on computer/Internet self-efficacy rather than the internal selfdirected process. Furthermore, the BL environment demands a unique synergy of self-management, self-monitoring, and motivation to prevent procrastination and isolation in virtual spaces. By synthesizing the SDL instruments, AMS, and PRO models, this study addresses these gaps by providing a multi-factor structure that captures both the psychological and environmental complexities of SDL in the digital era.
In this study, the theoretical models of SDL measurement presented above and the characteristics of BL are integrated to develop and validate the SDL scale in the BL context for pre-service teachers, and to evaluate the factors affecting SDL. The main contributions of this study include answering the following research questions:
• What factors can be used to measure the SDL of pre-service teachers in the context of BL?
• What factors influence the SDL of pre-service teachers in this context?
3. Methodology
3.1 Define the Theoretical Framework and Build the Test Scale3.2 Pilot Study
The SDLI scale, as applied in a study on nursing training outcomes, includes 42 items divided into three constructs: Self-management ability, Learning motivation, and Self-control and monitoring. Meanwhile, the Academic Motivation Scale (AMS) subdivides motivation into intrinsic motivation (e.g., motivation to know, to accomplish, and to experience stimulation) and extrinsic motivation (e.g., External Regulation, Introjected Regulation, and Identified Regulation). Similarly, Brockett and Hiemstra's Personal Responsibility Orientation (PRO) model emphasizes personal responsibility in the SDL process, highlighting the role of the individual and the social environment in promoting SDL.
The final seven-factor structure of the scale was systematically mapped from these three theoretical pillars to ensure a comprehensive coverage of SDL in the BL context: AMS: This framework guided the development of items for Intrinsic Motivation, Extrinsic Motivation, and Adjustment Motivation, capturing the psychological drivers that sustain learning in a distributed environment. SDLI: This model provided the foundation for items related to the Ability to Plan and Execute and Self-monitoring, focusing on the cognitive and metacognitive strategies necessary for navigating online and face-to-face tasks. PRO Model: This model informed the construction of items for Autonomy and Personal Responsibility, emphasizing the learner's initiative and commitment to their own learning path within the digital ecosystem.
In addition to the main scale items, the theoretical scale also includes 2 reverse-coded items (items phrased in an opposite semantic direction). Scales with many items are often necessary for populations with specialized research needs on SDL (e.g., medical students, nursing students) because they provide detailed and comprehensive information. However, when the scale has too many items, participants may experience respondent fatigue, leading to reduced concentration and response quality. This can compromise the reliability of the survey results. The challenge of respondent inattention in lengthy surveys has been documented by Jon A. Krosnick in the theory of Survey Satisficing [37]. Krosnick pointed out that when the questionnaire is too long, it causes fatigue and cognitive burden on respondents, leading to problematic response behaviors such as straight-lining (choosing the same rating for every item) and acquiescence bias (a tendency to agree with items, regardless of content). The inclusion of these reverse-coded items helps to detect and eliminate responses exhibiting such biases, thereby improving the overall data quality.
Factors affecting SDL were conceptualized based on the Community of Inquiry Framework (CoI) by Garrison et al [38]. The CoI framework posits three core factors that affect the learning experience: Social Presence, Teaching Presence, and Cognitive Presence. Given the characteristics of BL (combining F2F and online learning), the study has added a factor related to technology competence.
Best practices for online survey design recommend a completion time under 10 minutes and no more than 20 minutes [39]. Based on the items from source models, the study adapted and grouped these items suitable for the context of pre-service teacher education. At the same time, the study utilized expert consultation to add constructs specific to BL (e.g., collaboration ability, self-monitoring ability), resulting in a scale with 55 items (this includes 34 items measures of SDL, 2 test questions and 19 items measures of independent variables affecting SDL). These items were measured on a 5-level Likert scale (from 1. Never to 5. Always). The estimated survey time was approximately 56 minutes (average 5s/item).
Before conducting the main survey, the theoretical scale was pilot tested with 183 students from Hanoi National University of Education (HNUE). HNUE is one of Vietnam's seven key universities of education, and changes in its curricula and training models have a significant impact on other teacher training institutions. The participants were randomly selected from students who were experiencing the BL model. The survey was distributed and collected via Google Forms, and the data was subsequently cleaned using Microsoft Excel. Reliability analysis (Cronbach's Alpha) and Exploratory Factor Analysis (EFA) were performed using SPSS 20 software. Based on the results of the rotated component matrix, items that cross-loaded on more than one factor with a factor loading difference of less than 0.2 were eliminated.
3.3 Survey, Test, and Evaluate the Official Scale
4. Results
4.1 Pilot Scale to Measure SDL and Factors Affecting SDL
The revised scale was administered in the main survey to 1,041 students from HNUE, who were experiencing the BL method. The survey was distributed and collected via Google Forms, and the data was cleaned using Microsoft Excel.
The SDL variable was conceptualized according to the hierarchical component model, also known as a higher-order model. In this structure, SDL was treated as the Higher-Order Construct (HOC), and the 7 constituent factors were specified as Lower-Order Constructs (LOCs) measured by survey items. The hierarchical component model is illustrated in Figure 1.
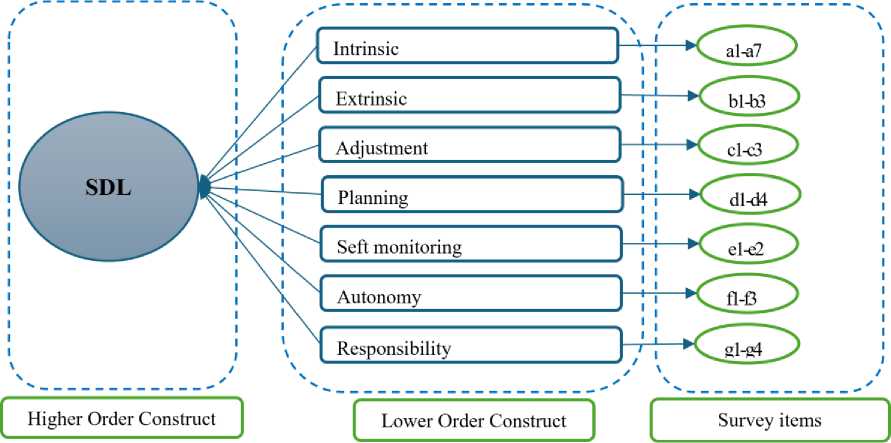
Fig. 1. SDL Definition Hierarchy Model
Scale validation was performed by evaluating the measurement model (outer model), the impact relationships were subsequently assessed by evaluating the structural model (inner model) using SmartPLS 3.
The experimental SDL scale was constructed with 36 questions (included 2 Reverse-coded question) divided into 6 groups, details in Table 1 below.
Table 1. SDL Scale
|
Symbo l |
Variable |
Number of Variables |
Note |
|
A |
Intrinsic motivation |
11 |
Identify: To know, To accomplish, To experience stimulation and 01 Reverse-coded question |
|
B |
Extrinsic motivation |
9 |
Identify: External regulation, Introjected regulation, Identified regulation and 01 Reverse-coded question |
|
C |
Ability to plan and execute |
4 |
Identify learning goals, plans and implementation |
|
D |
Self-monitoring |
4 |
Identify, self-assess your level of understanding, and monitor your progress against your set goals. |
|
E |
Ability to cooperate |
4 |
Evaluate group activities and interaction skills during blended learning |
|
F |
Personal responsibility |
4 |
Students' assessment of initiative and personal efforts to overcome difficulties in learning |
The scale of factors affecting SDL was built based on the Community of Inquiry (CoI) theoretical framework by Garrison et al., including 19 questions divided into 6 groups, details in Table 2 below.
Table 2. Scale of Factors Affecting SDL
|
Symbol |
Variable |
Number of Variables |
Note |
|
G |
Ability to use technology |
3 |
|
|
H |
Level of support from the curriculum |
4 |
|
|
I |
Peer/learning community interaction and support |
4 |
|
|
J |
The impact of student perception |
4 |
|
|
K |
The influence of learning culture |
4 |
-
4.2 Survey and Pilot Scale
The pilot scale was administered to 183 pre-service teachers. First, the scale was tested for Cronbach's alpha reliability. The constructs met the Cronbach's Alpha threshold of 0.7 or higher. The Cronbach's Alpha value for each construct was all > 0.7, showing that the scale constructs were reliable and could be used for subsequent analysis.
Next, the study performed exploratory factor analysis (EFA) for the SDL scale. According to Hair et al. [40], with a sample size of 150-200, the minimum acceptable factor loading is > 0.45. Data were analyzed using Principal Component extraction and Varimax rotation. The Kaiser-Meyer-Olkin (KMO) measure was 0.53, exceeding the recommended threshold of 0.50 and confirming the data's suitability for factor analysis [40]. Although nine factors initially emerged with an eigenvalue of 1.007 and a cumulative variance of 80.112%, the model was further refined. Items with cross-loadings (defined by a loading difference < 0.2) were eliminated, resulting in a final structure of seven factors comprising 27 items. This process redefined the original six theoretical dimensions into seven distinct factors representing Self-Directed Learning (SDL) measures. As detailed in Table 4, the motivation construct diverged into three separate groups: Intrinsic, Extrinsic, and Adjustment motivation. These findings align with Garrison’s [25] model, where motivation serves as a primary driver of the learning process, influencing both self-management and selfmonitoring.
Table 3. Rotated Component Matrix
|
Items |
Component |
||||||||
|
1 |
2 |
3 |
4 |
5 |
6 |
7 |
8 |
9 |
|
|
A1 |
.507 |
.648 |
|||||||
|
A2 |
.585 |
.338 |
.329 |
||||||
|
A3 |
.612 |
.440 |
|||||||
|
A4 |
.591 |
.354 |
.373 |
||||||
|
A5 |
.750 |
.378 |
|||||||
|
A6 |
.686 |
.431 |
|||||||
|
A7 |
.749 |
||||||||
|
A8 |
.390 |
.664 |
.306 |
.310 |
|||||
|
A9 |
.526 |
.566 |
.395 |
||||||
|
A10 |
.444 |
.793 |
|||||||
|
B1 |
.317 |
.751 |
|||||||
|
B2 |
.332 |
.734 |
|||||||
|
B3 |
.384 |
.624 |
|||||||
|
B4 |
.742 |
||||||||
|
B5 |
.358 |
.386 |
.637 |
||||||
|
B6 |
.820 |
||||||||
|
B7 |
.727 |
||||||||
|
B8 |
.304 |
.557 |
.333 |
.356 |
|||||
|
C1 |
.790 |
||||||||
|
C2 |
.374 |
.601 |
.309 |
||||||
|
C3 |
.757 |
.306 |
|||||||
|
C4 |
.493 |
.622 |
|||||||
|
D1 |
.686 |
.330 |
|||||||
|
D2 |
.352 |
.349 |
.647 |
||||||
|
D3 |
.792 |
.320 |
|||||||
|
D4 |
.652 |
.476 |
|||||||
|
E1 |
.457 |
-.437 |
.394 |
.692 |
|||||
|
E2 |
.464 |
.330 |
.487 |
-.419 |
|||||
|
E3 |
.622 |
.378 |
|||||||
|
E4 |
.839 |
||||||||
|
F1 |
.788 |
||||||||
|
F2 |
.333 |
.399 |
.530 |
.449 |
|||||
|
F3 |
.321 |
.336 |
.589 |
.332 |
|||||
|
F4 |
.573 |
.369 |
.309 |
Table 4. SDL Measurement Question Allocation
|
No |
Group of Elements |
Number of Variables |
Items |
|
1 |
Intrinsic motivation |
7 |
a2, a3, a4, a5, a6, a7, a8 |
|
2 |
Extrinsic motivation |
3 |
b6, b7, b8 |
|
3 |
Adjustment motivation |
3 |
b1, b3, b4 |
|
4 |
Ability to plan and execute |
5 |
c1, c3, d1, d3, d4 |
|
5 |
Self-monitoring |
2 |
b5, d2 |
|
6 |
Autonomy |
3 |
c2, e1, e4 |
|
7 |
Personal responsibility |
4 |
a10, f1, f3, f4 |
-
4.3 Main Survey and Scale Validation
4.3.1 SDL Phase 1 Calculation
From a total of 1,041 responses received, 116 invalid responses were eliminated (identified using the reverse-coded items, answers with the same level 1 or 5 for both control and validation questions will be eliminated), leaving a final valid sample of 925 (N=925) for analysis. The participants were mainly second and third year students, the cohorts received the most BL instruction at HNUE. Detailed demographic characteristics of the sample are presented in Table 5. The gender distribution in the sample (76.4% female and 23.6% male) accurately reflects the typical gender imbalance in teacher training institutions across Vietnam. In the Vietnamese pedagogical context, female students traditionally predominate in most fields of study. Therefore, while the sample is numerically imbalanced, it possesses high ecological validity as it represents the actual proportions of the pre-service teacher population. To ensure that this distribution does not skew the results, the study performed a MICOM test in Smart PLS. The results in Table 6 with a p-value > 0.05 confirm that the differences (or lack thereof) in path coefficients between groups are not due to differences in how genders interpreted the survey items.
Table 5. Survey Object Classification Table
|
Classification Characteristics |
Percent (%) |
|
|
Gender |
||
|
- |
Male |
23.6 |
|
- |
Female |
76.4 |
|
Major |
||
|
- |
Pedagogy |
80.1 |
|
- |
Outside of Pedagogy |
19.9 |
|
Subject |
||
|
- |
Major subjects |
8.90 |
|
- |
Introduction to Computer Science |
13.4 |
|
- |
General Information Technology |
62.1 |
|
- |
IT skills |
15.7 |
|
Department |
||
|
- |
Natural sciences |
57.9 |
|
- |
Social sciences |
25.5 |
|
- |
Pedagogical education |
15.1 |
|
- |
Special education |
1.40 |
Table 6. MICOM test
|
Path Coefficients Original (Female) |
Path Coefficients Original (Male) |
Path Coefficients Original Difference |
Path Coefficients Permutation Mean Difference |
2.50% |
97.50% |
Permutation p-Values |
|
|
AWARENESS -> SDL |
0.385 |
0.292 |
0.093 |
-0.002 |
-0.173 |
0.179 |
0.302 |
|
COMMUNITY -> SDL |
0.24 |
0.322 |
-0.083 |
-0.004 |
-0.185 |
0.17 |
0.371 |
|
CULTURE -> SDL |
0.012 |
0.016 |
-0.005 |
-0.003 |
-0.109 |
0.106 |
0.929 |
|
CURRICULUM -> SDL |
0.074 |
0.045 |
0.029 |
0.002 |
-0.17 |
0.169 |
0.733 |
|
DEPARTMENT -> SDL |
0.016 |
0.072 |
-0.056 |
0 |
-0.097 |
0.097 |
0.243 |
|
MAJOR -> SDL |
-0.026 |
-0.026 |
0 |
0 |
-0.092 |
0.093 |
0.992 |
|
SUBJECT -> SDL |
0.016 |
0.016 |
0 |
0.001 |
-0.089 |
0.091 |
0.994 |
|
TECH -> SDL |
0.23 |
0.33 |
-0.1 |
0.004 |
-0.153 |
0.169 |
0.225 |
|
YEAR -> SDL |
-0.042 |
-0.049 |
0.007 |
-0.001 |
-0.092 |
0.091 |
0.885 |
Theoretically, the construct of SDL is conceptualized as a complex, interdependent system of internal and external dynamics, with each dimension operationalized through multiple distinct indicators. To accurately capture this multidimensionality, a second-order factor model (hierarchical model) was employed. This approach allows for the representation of SDL as a higher-order latent construct that accounts for the covariance among its constituent primary factors, thereby reflecting the structural complexity inherent in the theoretical framework.
In Phase 1, the SDL measurement model was specified in SmartPLS according to the repeated indicators approach. In this phase, the analysis focused exclusively on the Lower-Order Constructs (LOCs). The LOC model is illustrated in Figure 2. The evaluation criteria included indicator reliability (factor loadings), internal consistency reliability (Composite Reliability and Cronbach's Alpha), convergent validity (AVE), and discriminant validity.
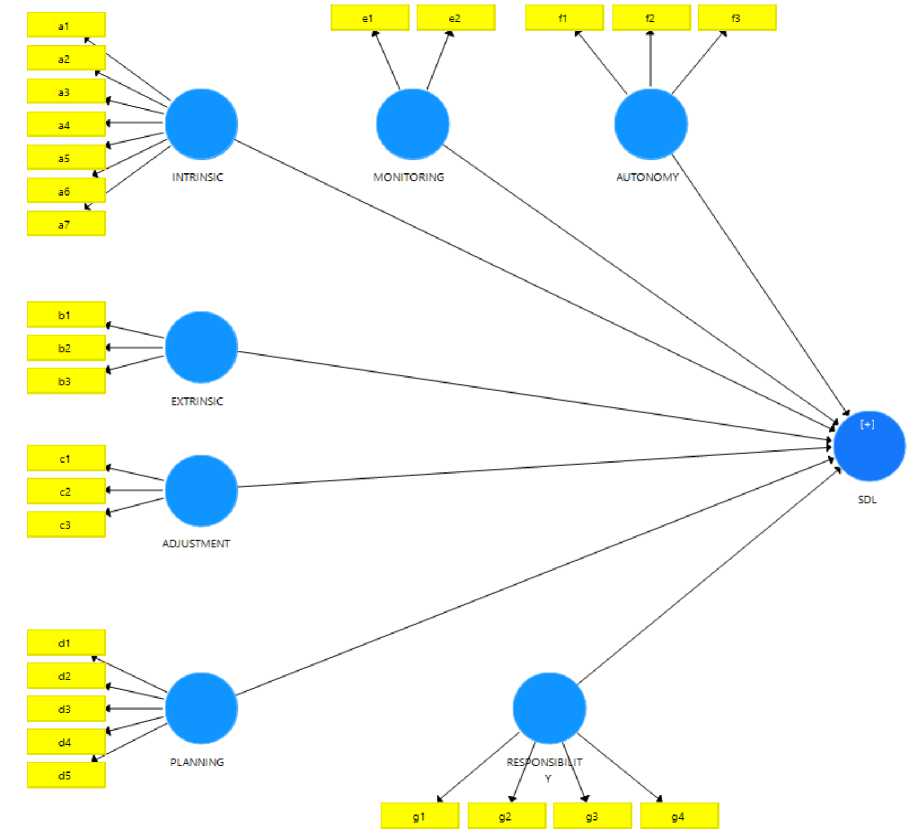
Fig. 2. SDL Measurement Model Phase 1
Indicator Reliability (Outer Loadings): Hair et al. [41] suggested that the outer loadings should be greater than or equal to 0.7 to ensure the reliability of the indicators. The outer loadings results (see Figure 2) showed that only item a1 = 0.584 < 0.7 was below this 0.7 threshold and was thus eliminated from the model. The remaining items had outer loadings > 0.7, indicating they were all retained for the model.
Internal Consistency Reliability and Convergent Validity: The results presented in Table 7 demonstrated that the scale achieved reliability and convergent validity. The Composite Reliability (CR) values exceeded the 0.7 threshold [42], and the Average Variance Extracted (AVE) values surpassed the 0.5 threshold [43].
Table 7. Composite Reliability Index, Average Variance Extracted Index of LOC
|
Variable |
Cronbach's Alpha |
Composite Reliability |
AVE |
|
Adjustment |
0.72 |
0.842 |
0.641 |
|
Autonomy |
0.785 |
0.874 |
0.698 |
|
Extrinsic |
0.854 |
0.912 |
0.775 |
|
Intrinsic |
0.881 |
0.911 |
0.63 |
|
Monitoring |
0.716 |
0.875 |
0.777 |
|
Planning |
0.894 |
0.922 |
0.703 |
|
Responsibility |
0.837 |
0.891 |
0.672 |
Discriminant Validity: Discriminant validity was assessed using the Fornell-Larcker criterion [44]. This method compares the square root of the Average Variance Extracted (SQRT(AVE)) of each construct with the inter-construct correlation coefficients. AVE (average variance extracted) represents the average amount of variance a construct explains in its own indicators. Discriminant validity is established if the SQRT(AVE) value is larger than the interconstruct correlation coefficients. The results in Table 8 show that the scale met this criterion, thus establishing discriminant validity.
Table 8. Fornell and Larcker criterion of LOC
|
Variable |
Adjustment |
Autonomy |
Extrinsic |
Intrinsic |
Monitoring |
Planning |
Responsibility |
|
Adjustment |
0.801 |
||||||
|
Autonomy |
0.341 |
0.835 |
|||||
|
Extrinsic |
0.704 |
0.366 |
0.880 |
||||
|
Intrinsic |
0.592 |
0.404 |
0.673 |
0.794 |
|||
|
Monitoring |
0.554 |
0.530 |
0.570 |
0.572 |
0.882 |
||
|
Planning |
0.396 |
0.670 |
0.400 |
0.445 |
0.604 |
0.838 |
|
|
Responsibility |
0.576 |
0.608 |
0.631 |
0.679 |
0.664 |
0.605 |
0.82 |
In Phase 1, the evaluation results showed that the Lower-Order Constructs (LOCs) met the required criteria for reliability, convergent validity, and discriminant validity, and were thus retained for Phase 2. The calculated latent variable scores of each LOC from SmartPLS were used as the input data for the Phase 2 analysis.
Latent Variable
|
П |
Latent' |
triable |
H Latent Variable Correlations |
u |
Latent Variable Covariances |
H LV D escri ptives |
||||||
|
Cast |
ID |
ADJUSTME... |
AUT0N0MY_ |
EXTRINSIC |
INTRINSIC |
MONITORI... |
PLANNING RESPONSIB... |
SDL |
||||
|
11 |
-A 471 |
-A 770 |
1 под |
A71A |
A7A7 |
-A 144 |
-АК4Ч , |
1.896 |
||||
|
2 |
0.791 |
1.243 |
1.094 |
0.683 |
0.207 |
1.291 |
1.280 |
1.542 |
||||
|
3 |
0.537 |
-0.688 |
1.094 |
-0.574 |
0.207 |
0.142 |
0.136 |
0.323 |
||||
|
4 |
0.791 |
1.237 |
1.094 |
1.211 |
0.961 |
0.993 |
1.651 |
1.542 |
||||
|
5 |
-1.908 |
-0.688 |
-1.867 |
-1.785 |
-1.200 |
-0.741 |
-1.380 - |
0.895 |
||||
|
6 |
-0.382 |
0.680 |
-0.858 |
-0.575 |
-1.200 |
-0.465 |
-0.248 |
0.323 |
||||
|
7 |
-0.168 |
-1.096 |
-1.371 |
-0.528 |
-1.200 |
-0.741 |
0.136 - |
0.896 |
||||
|
8 |
-1.908 |
-0.688 |
-1.867 |
-1.572 |
-1.200 |
-0.741 |
-1.380 - |
0.896 |
||||
|
9 |
-0.382 |
0.272 |
0.110 |
0.168 |
0.207 |
-0.167 |
0.136 - |
0.896 |
||||
Fig. 3. LOC Calculation Results in SmartPLS
-
4.3.2 Phase 2: Higher-Order Construct (HOC) Analysis
In the HOC model, the contribution of the 7 LOCs (as formative indicators) was assessed through two parameters: Outer weights and Outer loadings. The results of the Outer weights (presented in Table 9) showed that P-values were < 0.05 for Autonomy, Extrinsic, Intrinsic, Planning, and Responsibility. These constructs were thus considered statistically significant. For the two LOCs with non-significant P-values (> 0.05) (i.e., Adjustment and Monitoring), the Outer Loadings parameter was subsequently examined. According to Hair et al [41], for formative indicators, if the weight is non-significant, an outer loading > 0.5 is required for retention. The results in Table 10 showed that the outer loadings (see 'Original Sample' column) of both LOCs were > 0.5 (Adjustment = 0.645; Monitoring = 0.757). Therefore, both LOCs were retained. This confirms that the SDL scale, conceptualized as a HOC formed by these 7 LOCs, is a suitable measure of SDL for pre-service teachers in the BL context.
Table 9. Outer Weight of LOC
|
Variable |
Original Sample (O) |
Sample Mean (M) |
Standard Deviation (STDEV) |
T Statistics (|O/STDEV|) |
P Values |
|
Adjustment -> SDL |
0.073 |
0.073 |
0.038 |
1.937 |
0.053 |
|
Autonomy -> SDL |
0.304 |
0.304 |
0.045 |
6.82 |
0 |
|
Extrinsic -> SDL |
0.126 |
0.125 |
0.041 |
3.06 |
0.002 |
|
Intrinsic -> SDL |
0.097 |
0.098 |
0.043 |
2.263 |
0.024 |
|
Monitoring -> SDL |
0.051 |
0.05 |
0.039 |
1.311 |
0.19 |
|
Planning -> SDL |
0.259 |
0.258 |
0.044 |
5.957 |
0 |
|
Responsibility -> SDL |
0.332 |
0.332 |
0.047 |
7.113 |
0 |
Table 10. Outer Loadings of LOC
|
Variable |
Original Sample (O) |
Sample Mean (M) |
Standard Deviation (STDEV) |
T Statistics (|O/STDEV|) |
P Values |
|
Adjustment -> SDL |
0.645 |
0.642 |
0.036 |
18.066 |
0 |
|
Monitoring -> SDL |
0.757 |
0.754 |
0.027 |
28.282 |
0 |
Following the scoring protocol, each item was measured from 1 (Never) to 5 (Always), with the exception of the two reverse-coded items, which were scored in the opposite direction (e.g., 1=Always; 5=Never). The students SDL scores are shown in Table 11. The results showed that students self-assessed their SDL capacity in BL at a relatively high level (SDL = 77/100). Specifically, the highest-rated components were external motivation (84.3/100) and adjustment motivation (84.2/100), while the lowest-rated component was the ability to be autonomous and cooperative (69.7/100).
Table 11. SDL measurement results
|
Variable |
Min |
Max |
MaxS (Max of Scale) |
Sum |
Mean |
Std. Deviation |
Percent (Mean/MaxS) |
|
Intrinsic |
12.00 |
40.00 |
40.00 |
28,641.00 |
30.9632 |
4.60669 |
77.4% |
|
Extrinsic |
8.00 |
20.00 |
20.00 |
15,592.00 |
16.8562 |
2.73424 |
84.3% |
|
Adjustment |
3.00 |
15.00 |
15.00 |
11,682.00 |
12.6292 |
1.97271 |
84.2% |
|
Planning |
5.00 |
25.00 |
25.00 |
16,213.00 |
17.5276 |
3.42997 |
70.1% |
|
Monitoring |
2.00 |
10.00 |
10.00 |
7,123.00 |
7.7005 |
1.41882 |
77.0% |
|
Autonomy |
3.00 |
15.00 |
15.00 |
9,666.00 |
10.4497 |
2.20117 |
69.7% |
|
Responsibility |
4.00 |
20.00 |
20.00 |
14,479.00 |
15.6530 |
2.63912 |
79.4% |
|
SDL (sum) |
37.00 |
145.00 |
145.00 |
103,396.00 |
111.7795 |
14.79708 |
77.2% |
-
4.3.3 . Analysis of Factors Influencing SDL
-
i) Outer Model:
To assess the factors influencing SDL, the study first evaluated the measurement models for the independent variables (exogenous constructs): Ability to use technology (Tech), Support from educational institutions (Curriculum), Support from friends/community (Community), Student awareness (Awareness), and Learning culture (Culture). The evaluation of these constructs followed the standard criteria: indicator reliability (outer loadings), internal consistency reliability, convergent validity, and discriminant validity.
Indicator Reliability (Outer Loadings): Indicator reliability was assessed using outer loadings. Following Hair et al. [41], indicators with loadings < 0.7 were considered for removal. The results (Figure 4) showed that item l2 (loading =0.669) was below this threshold and was eliminated. After re-running the model, item l3 (loading = 0.67) was also below the 0.7 threshold and was subsequently removed.
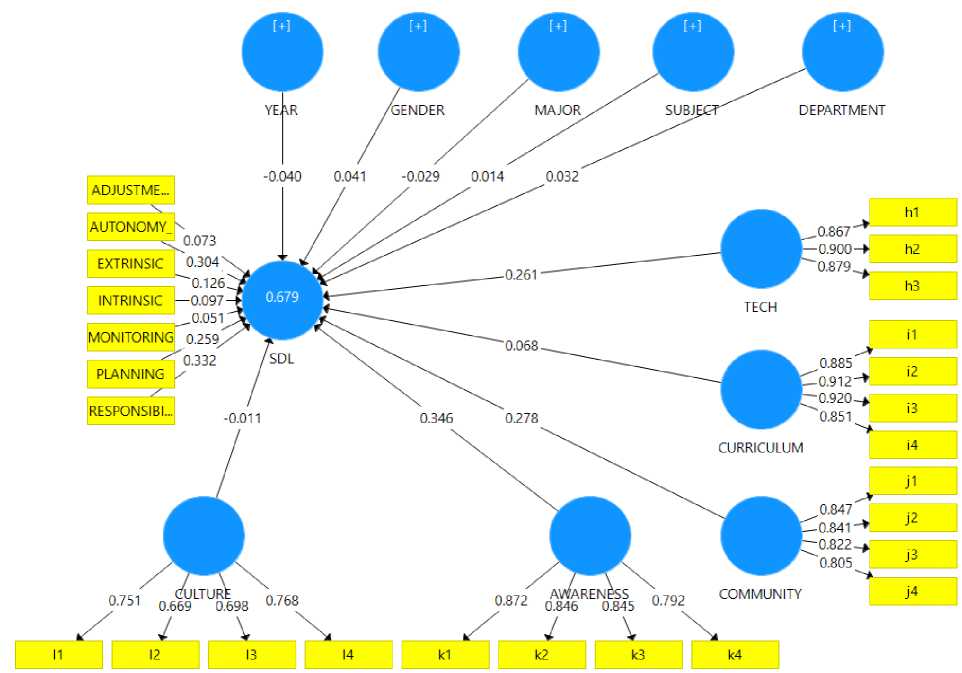
Fig. 4. Structural Model Assessment
Scale reliability and convergent validity were assessed using Composite Reliability (CR) and Average Variance Extracted (AVE). Following Henseler [42], a CR value greater than 0.7 is required to ensure reliability. Furthermore, convergent validity is established when the AVE value exceeds 0.5 (Hock) [43]. The results in Table 12 indicate that all scales meet the required criteria for both reliability and convergent validity.
Table 12. Composite Reliability Index, Average Variance Extracted of Independent Variable
|
Variable |
Composite Reliability |
Average Variance Extracted (AVE) |
|
Awareness |
0.905 |
0.705 |
|
Community |
0.898 |
0.687 |
|
Culture |
0.769 |
0.625 |
|
Curriculum |
0.940 |
0.797 |
|
Tech |
0.913 |
0.778 |
Discriminant validity was assessed using the Fornell and Larcker (1981) criterion. This method requires that the square root of the Average Variance Extracted for a specific construct be greater than its correlation coefficients with all other latent constructs in the model - Where AVE represents the average amount of variance that a construct explains in its own observed variables relative to the variance due to measurement error - Discriminant validity is established when the value for each construct is higher than all its inter-construct correlations. As shown in Table 13, the results support the discriminant validity of all scales.
Table 13. Fornell and Larcker Criterion of Independent Variable
|
Variable |
Awareness |
Community |
Culture |
Curriculum |
Tech |
|
Awareness |
0.840 |
||||
|
Community |
0.781 |
0.829 |
|||
|
Culture |
0.301 |
0.294 |
0.791 |
||
|
Curriculum |
0.583 |
0.652 |
0.158 |
0.892 |
|
|
Tech |
0.519 |
0.593 |
0.148 |
0.531 |
0.882 |
-
ii) Inner Model:
The structural model evaluation focused on several key metrics: collinearity among independent variables (Inner VIF), the significance of path coefficients, the coefficient of determination (R-square), and the effect size (f-square).
To assess collinearity, inner VIF values were examined. Following the guidelines of Hair et al [41, 44], VIF values must be below 5.0 to ensure that multicollinearity is not a significant issue. Furthermore, all inner Variance Inflation Factor (VIF) values were below the threshold of 5.0 (ranging from 1.059 to 3.331), as shown in Table 14, confirming that multicollinearity and method bias did not significantly inflate the structural relationships.
Table 14. Inner VIF
|
Variable |
SDL |
|
Awareness |
2.723 |
|
Community |
3.331 |
|
Culture |
1.128 |
|
Curriculum |
1.893 |
|
Department |
1.162 |
|
Gender |
1.083 |
|
Major |
1.059 |
|
Subject |
1.086 |
|
Tech |
1.664 |
|
Year |
1.103 |
Table 15 presents the results of the analysis examining the relationship between the independent variables and the dependent variable, SDL. The findings indicate that several demographic and academic factors - specifically Culture, Curriculum, Department, Gender, Major, Subject, and pedagogical/non-pedagogical field - were not significantly associated with SDL (all p > 0.05)
In contrast, Awareness (students' awareness), Community (interaction and support from friends/community), Tech (ability to use technology), and Year (year of study) demonstrated a statistically significant association with SDL (all p < 0.05).
Table 15. Path Coefficients
|
Original Sample (O) |
Sample Mean (M) |
STDEV |
T Statistics (|O/STDEV|) |
P Values |
|
|
Awareness -> SDL |
0.35 |
0.35 |
0.037 |
9.387 |
0 |
|
Community -> SDL |
0.267 |
0.268 |
0.037 |
7.244 |
0 |
|
Culture -> SDL |
0.009 |
0.01 |
0.022 |
0.387 |
0.699 |
|
Curriculum -> SDL |
0.065 |
0.065 |
0.034 |
1.912 |
0.056 |
|
Department -> SDL |
0.031 |
0.031 |
0.021 |
1.523 |
0.128 |
|
Gender -> SDL |
0.04 |
0.04 |
0.021 |
1.916 |
0.055 |
|
Major -> SDL |
-0.028 |
-0.028 |
0.02 |
1.408 |
0.159 |
|
Subject -> SDL |
0.015 |
0.015 |
0.019 |
0.804 |
0.421 |
|
Tech -> SDL |
0.264 |
0.264 |
0.033 |
8.026 |
0 |
|
Year -> SDL |
-0.044 |
-0.044 |
0.019 |
2.314 |
0.021 |
The R-squared and f-squared indices are shown in Table 16, the influencing factors explain 67.4% of the variation in SDL in which Awareness and Tech have the greatest impact on SDL.
Table 16. R2 and f2
|
Effect |
f-Square |
R-square |
|||
|
Direct effect |
Indirect effect |
Total effect |
|||
|
Awareness -> SDL |
0.350 |
0.350 |
0.140 |
0.674 |
|
|
Community -> SDL |
0.267 |
0.267 |
0.066 |
||
|
Tech -> SDL |
0.264 |
0.264 |
0.130 |
||
|
Year -> SDL |
-0.044 |
-0.044 |
0.005 |
||
5. Discussion and Recommendations 5.1. SDL Scale of Pre-service Teachers in BL
The results presented in Table 7 and Table 8 indicate that all seven proposed factors demonstrate acceptable reliability and validity for measuring students' SDL in the BL context. This finding aligns with foundational research, such as Guglielmino's scale and Vallerand's [15] study, which identifies motivation (often delineated as intrinsic and extrinsic motivation [29]) as a core component of SDL.
This methodological approach is consistent with recommendations from researchers such as Fisher (2010) (2010) [21] and Hung et al. [23], who have emphasized the necessity of developing contextualized scales for specific learning environments.
-
5.2. Factors Affecting the SDL of Pre-service Teachers in BL
-
5.3. Solutions to Improve SDL of Pre-service Teachers in BL
The results in Table 14 indicate that the proposed model explaining 67.4% of the variance in SDL in BL. This finding suggests that the newly developed scale, grounded in contemporary theoretical frameworks, may be more robust for measuring SDL within the current BL environment.
The analysis also identified the three factors with the strongest predictive relationship with SDL, highlighting potential areas for effective pedagogical intervention: Awareness, Tech (Technological Competence), and Community (Community Engagement).
Awareness emerged as the most significant predictor. This result aligns with Garrison’s (1997) comprehensive model [25], in which awareness is conceptualized as a manifestation of self-monitoring. This finding is also consistent with that of Steinberg et al [30], who suggested that student-directed learning environments help maintain “academic self-concept,” thereby contributing to improved learning outcomes.
The Tech factor, while a novel component in traditional SDL scales, is highly relevant to the BL environment, which inherently integrates online and offline modalities [45]. This finding aligns with the research of Hung et al. (2010) [23], who identified “computer/Internet self-efficacy” as a critical component of online learning readiness. The results suggest that within the BL context, technological competence transcends being merely a supplementary skill and functions as a significant factor related to students' self-directed learning capabilities.
Furthermore, the Community factor corroborates the established role of social presence within the Community of Inquiry (CoI) framework [38]. This finding is particularly salient when considering the caution raised by Adigun et al. [32], whose research indicated that BL students lacking these social connections are susceptible to “procrastination, disorientation, and feeling isolated”. The present study suggests that the community dimension also serves as an important contributor to fostering SDL.
Currently, BL implementation within HNUE is concentrated primarily in foundational natural science courses (e.g., general informatics, computer science), though institution-wide pilot programs are emerging. The present study surveyed a diverse student cohort participating in experimental BL courses, encompassing various fields (pedagogical and non-pedagogical), majors (natural sciences, social sciences, special education), and subject types (general and specialized).
The findings indicated that these demographic and academic variables were not significantly associated with students' SDL. This consistency preliminarily suggests that BL implementation could be considered for broader institutional application, rather than being restricted to foundational natural science courses for first and second-year students. Although the data was collected from a single institution (HNUE), the findings possess a degree of representative value within the Vietnamese teacher training system. HNUE is one of the seven key pedagogical universities in Vietnam, and its curricula often serve as a blueprint for other regional institutions. The internal diversity of the sample (N=925), covering various majors and departments, further strengthens the stability of the results. However, the authors acknowledge that environmental and cultural differences in other universities or countries might influence SDL levels. Therefore, while the scale is robust, its application in different contexts should be interpreted with caution.
Furthermore, students' “learning culture” - whether characterized by proactive, collaborative tendencies or by traditional preferences for instructor guidance and memorization - was also not found to be significantly related to SDL. The inherent characteristics of BL, such as the integration of online and face-to-face instruction, the interspersion of individual and group work, and the flexibility of learning “anytime, anywhere,” offer adaptability in teaching and knowledge acquisition. This adaptability likely renders the BL methodology suitable for diverse student learning preferences and a wide range of academic subjects.
Student awareness was the primary predictor of SDL, a critical finding as BL demands high student autonomy. The student perception that BL “encourages deep thinking and thorough problem analysis” supports the application of Problem-Based Learning (PBL) and Case Studies, where instruction begins with a complex “problem” requiring student-led analysis.
To reinforce the perception that students “can apply the knowledge they have learned to solve real-life problems”, curricula could integrate Project-Based Learning, which necessitates sustained research and practical application. Additionally, instructors' use of the Socratic Questioning Method can stimulate students to construct knowledge independently rather than passively awaiting answers.
Students' technological ability is also significantly related to SDL. This finding is characteristic of the BL context, where self-study now extends beyond traditional resources to include interaction within the digital environment. This suggests that technology integration, guided by frameworks like the TPACK model, should be applied across all subjects, not just isolated to Informatics. Based on the observed correlations, curricula could potentially be designed to build confidence in “real-life contexts.” For example, a “Methods of Teaching Mathematics” module might require students to design a lesson on fractions using simulation tools and present it via Google Classroom, rather than only learning the tool's theory. Instructors should also monitor the ethical use of technology, implementing strict citation requirements to ensure the use of reputable academic sources and mitigate the misuse of AI.
While the current study identifies significant predictors of SDL, it is important to note that the cross-sectional and correlational nature of the design precludes the establishment of definitive causal links. Therefore, the pedagogical recommendations provided—such as the integration of Project-Based Learning and technology-guided frameworks— should be viewed as evidence-informed strategies to foster SDL, rather than guaranteed interventions. Future longitudinal studies are needed to confirm the causal influence of these factors over time.
6. Conclusion
This study had two main objectives: To develop and validate a Self-Directed Learning (SDL) scale for pre-service teachers in a BL context, and to identify key factors associated with this competency. Consistent with prior research, the study identified intrinsic and extrinsic motivation as foundational factors. However, reflecting the technology-supported, distributed nature of BL, the study also identified novel factors: Self-Monitoring (reflecting intrinsic motivation and metacognition) and Autonomy (manifested as proactive resource-seeking and positive online social interaction).
The study also identified factors associated with students' SDL, offering a basis for educators to design interventions that enhance self-learning in BL. The model explained 67.4% of the variance in SDL (R 2 = 0.674), a substantial value suggesting a need to shift curriculum focus from “Content” to “Experience Design”. Programs must cultivate learning environments (online and offline) that foster SDL awareness, with instructors acting as “architects” who design open-ended questions, problem-based projects, and real-life situations to activate this competency
Given their dual role as learners and future teachers, students must experience and develop their own SDL. This process equips them with a pedagogical model to apply in their teaching careers, thereby creating a sustainable impact for the next generation of students.
Author Contributions Statement
Thuy K. Phuong - Conceptualization, Methodology, and Supervision: Proposed research ideas, Constructed the overall framework, Data analysis, Writing - Review - Editing and Supervised project execution.
Binh. T.T. Tran - Literature review, Research gap identification, Questionnaire design and Survey support.
Anh D.P. Pham - Data collection and Data preprocessing.
All authors have read and agreed to the published version of the manuscript.
Conflict of Interest Statement
The authors declare no conflicts of interest.
Funding Declaration
This research was supported in part by a grant from the Educational Science project (code: SPHN25-12).
Data Availability Statement
This study analyzed publicly available datasets. The results obtained and datasets can be found here: gDrive, accessed on “60 days”.
Ethical Declarations
This study was deemed exempt from ethical review by HNUE because the survey content was public, randomized, and the responses were anonymous.
Acknowledgment
The authors wish to thank Hanoi National University of Education.
Declaration of Generative AI in Scholarly Writing
The study uses Gemini for proofreading the manuscript.
Abbreviations
The following abbreviations are used in this manuscript:
BL - Blended Learning
SDL - Self-Directed Learning
SDLRS - SDL Readiness Scale
OLRS - Online Learning Readiness Scale
EFA - Exploratory Factor Analysis
F2F - Face-to-Face
ICT - Information and Communication Technology
IT - Information Technology
PRO - Personal Responsibility Orientation
AMS - Academic Motivation Scale
CoI - Community of Inquiry Framework
HNUE - Hanoi National University of Education
HOC - Higher-Order Construct
LOC - Lower-Order Constructs
Appendix A. Self-Directed Learning Readiness Scale
|
Symbol |
Item |
Note |
|
Scale of SDL |
||
|
A a1 a2 a3 a4 a5 a6 a7 |
Intrinsic Motivation I can search for materials and participate in online discussions in addition to face-to-face classes I want to better understand the world around me I feel pleased when I can solve difficult assignments Overcoming academic challenges gives me a sense of satisfaction I like the feeling of accomplishing something important in my studies I feel a sense of achievement when my academic efforts pay off I feel excited about learning new things through both online classes and face-to-face sessions I feel tired when I have to study online |
Reverse-coded item |
|
B b1 b2 b3 |
Extrinsic Motivation I believe that learning is important for my life I think learning is useful I find personal value in what I learn I think learning is not my responsibility |
Reverse-coded item |
|
C c1 c2 c3 |
Adjustment Motivation I want to have a good job after graduation I want to feel that I am a responsible person I would be ashamed if I did not try to study |
|
D d1 d2 d3 d4 d5 |
Planning and Monitoring Implementation I often set clear and specific learning goals for myself in blended learning I am able to select and apply learning methods appropriate for each content and learning format (online/face-to-face) I regularly check my level of understanding throughout the learning process, without waiting for a test I adjust my study approach based on the results of tests or self-assessment activities I perform I closely monitor my progress towards the learning goals I have set |
|
|
E e1 e2 |
Self-monitoring I want to prove to myself that I can do it I can recognize when I do not clearly understand a problem and need to research it more deeply |
|
|
F f1 f2 f3 |
Autonomy I actively participate in group discussion activities or online learning forums I proactively search for learning resources (books, scientific articles, videos, online courses) beyond what the lecturer provides I feel comfortable sharing opinions and asking questions to the lecturer in blended learning |
|
|
G g1 g2 g3 g4 |
Responsibility I feel a sense of excitement when I understand something new I believe my academic results depend mainly on my own effort and proactivity I conscientiously complete learning tasks and am motivated to study even without direct supervision from the lecturer I proactively seek solutions and resources when facing difficult learning content |
|
|
Scale of Factors Affecting SDL |
||
|
H h1 h2 h3 |
Ability to Use Technology I feel confident using online tools such as Google Classroom, Zoom, or other online learning platforms I can easily search for, use, and share learning materials from online sources I am willing to use new technologies to enhance my learning effectiveness |
|
|
I i1 i2 i3 i4 |
Support From the Curriculum The lecturer always provides sufficient materials and clear instructions for online learning activities I feel the lecturer provides enough constructive feedback to improve my learning outcomes The lecturer creates a blended learning environment that supports the development of my selflearning competency The lecturer regularly encourages us to participate in active learning activities (discussions, presentations, group projects) |
|
|
J j1 j2 j3 j4 |
Friend/Community Support I actively participate in group learning activities and support my peers in their studies I feel supported by the online learning community (forums, study groups) in solving academic problems I feel that learning from peers and lecturers in the blended learning environment is an important part of my learning process I feel that the lecturer is interested in my participation and individual contributions |
|
|
K k1 k2 k3 k4 |
Student Awareness Activities in the blended classroom encourage me to think deeply and analyze problems thoroughly I often participate in discussions to build a shared and deeper understanding of a topic I feel I can apply the knowledge I have learned to solve real-world problems or complex situations The lecturer often asks open-ended questions that stimulate critical thinking and exploration |
|
|
L l1 l2 l3 l4 |
Learning Culture I feel pressured to get high grades in my studies to please my family and society I usually wait for detailed instructions from the lecturer rather than figuring out and deciding how to learn on my own I prioritize memorizing knowledge to pass exams rather than deeply understanding and applying the knowledge I feel more comfortable and effective when learning in a group compared to learning alone |
