
Relationship between body composition and motor abilities of soccer players
Journal: Sport Mediji i Biznis @journal-smb
Article in issue: 2 vol.12, 2026.
Free access
This research analyzed how morphological characteristics relate to physical performance in youth football players. Thirty-two male competitors aged 10 to 13 participated in the study. Anthropometric and tissue metrics evaluated were stature, total weight, body mass index (BMI), adiposity percentage (%BF), and skeletal muscle percentage (%MM). Physical performance was measured using linear speed runs (at intervals of 5 m, 10 m, 20 m, and 30 m), directional change capacity (T-test executed with and without a soccer ball), and lower-body reactive power (CMJ, CMJa, and SJ). Pearson’s bivariate correlations mapped the links between body composition and athletic output. The analysis revealed that skeletal height had a notable positive link with vertical leap height (r=0.438-0.548, p<0.05) alongside moderate negative associations with times over 20 m and 30 m (r=-0.324 to -0.352, p<0.05). Adiposity percentage displayed the most stable correlations with linear speed times (r=0.343-0.463, p<0.05), indicating that elevated body fat impedes acceleration. In contrast, muscle percentage positively supported vertical jump scores (r=0.378-0.451, p<0.05), and its negative links with sprint times showed that greater muscle development boosts performance over brief acceleration distances. BMI failed to yield meaningful relationships with the majority of the physical fitness tests.
Short address: https://sciup.org/170213389
IDS: 170213389 | UDC: 572.512.087:796.332.071.2; 796.332.012.1 | DOI: 10.58984/smb2602024o
Text of the scientific article Relationship between body composition and motor abilities of soccer players
DOI:
In sports science, association football is recognized as a complex physical and tactical pursuit, holding a position as one of the globally dominant sporting disciplines (González-Fernández et al., 2022). Achieving elite standards in football demands a highly developed array of physical traits. Thanks to cutting-edge biomechanical monitoring, targeted dietary strategies, and sports medicine, players continually push their functional limits. The chaotic, intermittent nature of match-play imposes heavy physiological loads (Nicholas et al., 2000; Rienzi et al., 2000), requiring modern coaching to rely on rigorous scientific protocols. Over the past decade, football has evolved rapidly, showing faster game speeds and requiring superior physical preparation from its participants (Sever & Zorba, 2018). This evolution demands higher metabolic efficiency and endurance during competition, which is directly supported by optimized body composition and mechanical power. To sustain these high performance levels, coaches must closely monitor players' physiological indicators. Consequently, research heavily prioritizes body composition and motor skills as vital pillars of soccer success. While balanced physical development is necessary, the core determinant capacities remain linear speed, explosive leg power, aerobic stamina, change-of-direction speed, and coordination (Nurhidayat et al., 2019; Andrašić, 2021).
An individual's body composition reflects their overall health status and is defined by the relative distribution of skeletal muscle, adipose tissue, bone density, and other physiological structures within total body mass (Solway, 2013). Nutritional profiles and somatic dimensions dictate both general well-being and competitive capacity (Ackland et al., 2012). Indeed, reaching high-level athletic success is highly unlikely unless an athlete's physical makeup matches the specific physiological demands of their sport (Nikbakht et al., 2012). Mapping the physical features of athletes, alongside tracking differences across competitive classes, gives coaching staffs vital insights for managing different youth age brackets. While certain morphological metrics may not directly determine success, maintaining low adiposity levels and high relative skeletal muscle mass remains a primary goal for maximizing athletic output in football (Rienzi et al., 2000; Gil, 2007).
Motor skills represent the functional qualities of human movement capacity, often categorized in literature as physical, motor, or psychomotor attributes (Živanović et al., 2018). The foundational elements of physical fitness include force production, movement speed, systemic endurance, joint range of motion, and motor control. Because soccer is an acyclic, highly variable sport, competitive success is dictated by specialized movement patterns, individual motor characteristics, and tactical synergy among teammates (Talović et al., 2010). A variety of research projects have investigated how body composition shapes physical performance metrics in football (Atakan et al., 2017; Leão et al., 2002; Bangsbo et al., 2006). Multiple authors have verified that elevated body fat percentages hinder running speed, agility, and power generation (Pérez-López et al., 2015; Zanini et al., 2020; França et al., 2024). In contrast, fat-free mass and muscle volume show strong positive links with vertical jump height, short-distance acceleration, and change-of-direction speeds (Aurélio et al., 2016; Pérez-Contreras et al., 2021; Leão et al., 2022). Interventions also highlight the influence of
Okičić, M., Đokić, N., Stanković, D., Mašić, Z., & Mihajlović, M. (2026). Relationship between body composition and motor abilities of soccer players, Sport media and business, 12(2), 11-24 biological growth and physical development, as older cohorts consistently demonstrate superior athletic performance (Toselli et al., 2022). Longitudinal and cross-sectional work with youth athletes shows that basic capacities like strength and velocity grow continuously during maturation, whereas position-specific technical skills, like ball control, are highly prominent in midfielders at early competitive stages (Mujika et al., 2009). Additionally, targeted exercise programs—including core stability regimens—can positively alter both somatic characteristics and functional capacities (Yaraş & Harmanci, 2022;
The aim of this study was to investigate the relationships between body composition metrics and motor capacities in a cohort of young football players. We hypothesized that morphological profiles, specifically adiposity (BF) and muscle percentage (MM), would show statistically significant associations with physical test results in youth players, with higher MM positively relating to performance and higher BF negatively associating with speed, agility, and explosive power.
Methods
Participants
The initial sample for this cross-sectional project comprised forty-one youth soccer players (mean age: 11.5\pm1.5 years, weight: 49.7\pm11.18 kg, and height: 157.82\pm10.10 cm). Following the attrition of nine participants who missed specific evaluation sessions, thirty-two competitors remained for the final dataset. Prior to testing, all players and their legal guardians received a detailed briefing regarding the study's scope, after which they provided signed informed consent. Inclusion required players to be in good health, actively training for a minimum of two years (with at least three sessions per week), and participating in regional or national tournaments. Anyone presenting with a lower-limb injury over the preceding trimester, active physical discomfort, or limiting medical diagnoses was excluded. The experimental design was aligned with the ethical standards of the Declaration of Helsinki, receiving formal clearance from the Ethics Committee of the Faculty of Sport and Physical Education, University of Niš (protocol code: 04-542/5).
Study Design
To ensure protocol compliance, all young players underwent a familiarization session where researchers demonstrated and explained every trial. Testing occurred in a highly structured sequence on the designated days, using uniform laboratory apparatuses overseen by the same research staff. Stature was recorded with a Swiss Martin anthropometer (GPM 101) to the nearest 0.1 cm. Somatic metrics—including body weight (BM), body mass index (BMI), relative adiposity (%BF), and skeletal muscle mass (%MM)—were recorded using a multifrequency bioelectrical impedance platform (InBody 770; Biospace Co. Ltd, Seoul, Korea). Linear velocity was tracked over a 30 m distance, capturing intermediate split times at 5 m, 10 m, and 20 m using a wireless timing system (Witty, Microgate, Bolzano, Italy). Change-of-direction agility was evaluated through the standardized T-test (performed both with and without dribbling a soccer ball) utilizing the same timing gates. Lower-extremity vertical power was examined via three jump protocols: Squat Jump (SJ), Countermovement Jump with hands fixed (CMJ), and Countermovement Jump with free arm swing (CMJa), recorded using a precision optical system (Optojump, Microgate, Bolzano, Italy).
Testing Procedures
Morphological evaluations were completed in a temperature-controlled laboratory, whereas physical trials took place on an outdoor natural turf pitch. To mitigate physical fatigue, the evaluations were divided across two back-to-back testing sessions. The initial day started with body composition profiling and basic anthropometrics (BH, BM, BMI, %BF, and %MM). Following these measurements, players completed a structured 15-minute dynamic preparation routine incorporating low-intensity running, active stretching, and quick directional changes (Soligard et al., 2008; Daneshjoo et al., 2013). This was immediately followed by the vertical power trials: first SJ, then CMJ, and finally CMJa. The second session focused on linear speed and agility evaluations, preceded by the same warm-up protocol. Running speed was assessed across the 5 m, 10 m, 20 m, and 30 m zones. To avoid circadian performance variations, all testing took place between 10:00 a.m. and 1:00 p.m. under the direction of two expert examiners who gave identical verbal prompts. All assessments were scheduled on mid-week days (Wednesdays and Thursdays) to guarantee a minimum recovery window of 72 hours after any competitive match. This exact timeline was repeated the subsequent week for the rest of the cohort over a total of four collection days.
Anthropometry
Body composition
Speed Tests
Linear running speed was evaluated through max-effort sprints across 5 m, 10 m, 20 m, and 30 m intervals. Electronic timing cells (Witty, Microgate, Italy) captured running times to the nearest 0.01 seconds. In line with soccer-specific testing protocols (Mendez-Villanueva et al., 2011), participants set up in a split-stance standing start 0.5 m behind the initial sensor. On their own choice, they accelerated at maximum velocity past each intermediate gate. Timing heights were set at approximately 1 m to avoid premature triggering by limbs. Players performed two complete sprint trials, separated by a 2-minute passive recovery window, with only the fastest run retained for statistical analysis.
Agility Test
Change-of-direction speed was evaluated using the T-test, which measures multidirectional coordination and acceleration. The protocol was performed following Semenick's (1990) design, requiring players to complete forward sprinting, lateral shuffling (left and right), and backpedaling, performed both with and without dribbling a ball. Cones were positioned in a "T" layout. Each player completed three maximal attempts, with the best trial selected for final processing. The psychometric properties of this agility assessment are well-documented in youth soccer cohorts (Sporiš et al., 2010).
Muscle Power Tests
Dynamic leg power was examined via three vertical leap conditions: countermovement jump (CMJ), countermovement jump utilizing arms (CMJa), and the classic squat jump (SJ). Vertical leap height was calculated via optical flight-time sensors using the Optojump platform, which is a validated system for jump height estimations (Glatthorn et al., 2011). For the CMJ trial, players started upright with hands fixed on their waist, performed a self-selected countermovement knee flexion, and immediately exploded upward. The CMJa used an identical jumping motion but allowed an active, free arm swing to maximize vertical height. For the SJ, participants descended into a 90^\circ knee flexion, held the static position for 2 seconds to eliminate elastic energy storage, and then jumped vertically on command without any countermovement. The maximum height (measured in centimeters) was recorded, with the validity of these jumping assessments supported by previous research (Glatthorn et al., 2011).
Statistical Analysis
All calculations were executed using the SPSS statistical software package (v26.0, SPSS Inc., Chicago, IL, USA). Standard descriptive metrics were calculated for every evaluated variable, and the normal distribution of the dataset was confirmed using the Kolmogorov-Smirnov test. Pearson product-moment correlations assessed the degree of association between somatic indices and motor variables. In line with Hopkins et al. (2009), correlation strengths were interpreted as: trivial (0 < r \leq 0.1), small (0.1 < r < 0.3), moderate (0.3 < r < 0.5), large (0.5 < r < 0.7), very large (0.7 < r < 0.9), and nearly perfect (0.9 < r \leq 1.0).
Results
The physical characteristics and body composition of the evaluated players (n = 32) are detailed in Table 1, while Table 2 outlines the performance means and standard deviations for the physical tests.
Table 1. Mean values ± SD for descriptive characteristics and body composition parameters of soccer players (n = 32).
|
Variables |
Mean ± SD |
Kolmogorov-Smirnov test |
|
Height (cm) |
157.82 ± 10.10 |
0.516 |
|
Body mass (kg) |
49.70 ± 11.18 |
0.652 |
|
Body mass index |
19.50 ± 3.19 |
0.566 |
|
Body fat (%) |
9.10 ± 5.03 |
1.194 |
|
Muscle mass (%) |
21.69 ± 5.34 |
0.527 |
Table 2. Mean values ± SD for motor abilities of young soccer players (n = 32).
|
Variables |
Mean ± SD |
Kolmogorov-Smirnov test |
|
CMJ (cm) |
25.58 ± 5.72 |
0.843 |
|
CMJa (cm) |
30.49 ± 6.90 |
0.443 |
|
SJ (cm) |
24.89 ± 5.99 |
0.532 |
|
5 m (s) |
1.33 ± 0.12 |
0.596 |
|
10 m (s) |
2.23 ± 0.16 |
0.610 |
|
20 m (s) |
3.70 ± 0.27 |
0.472 |
|
30 m (s) |
5.24 ± 0.42 |
0.661 |
|
T-test (s) |
11.26 ± 0.68 |
0.596 |
Table 3 lists the bivariate Pearson correlation values between the body metrics and the physical fitness scores. These correlations are also visually mapped in Figure 1. In general, stature and muscle percentage displayed clear positive correlations with vertical leap heights (specifically CMJa and SJ). On the other hand, relative body fat showed a clear negative relationship with sprint performance (indicated by longer sprint times), along with a weak, non-significant negative association with jump height.
Table 3. Pearson’s correlation coefficients between body composition and motor abilities.
|
Variables |
CMJ |
CMJa |
SJ |
5 m |
10 m |
20 m |
30 m |
T-test without ball |
T-test with ball |
|
Body height |
+0.490** |
+0.548** |
+0.438* |
-0.309 |
-0.354* |
-0.324 |
-0.352* |
+0.110 |
+0.068 |
|
Body mass |
0.101 |
0.234 |
0.136 |
-0.163 |
-0.095 |
-0.064 |
-0.046 |
+0.202 |
+0.008 |
|
Body mass index |
-0.223 |
-0.130 |
-0.168 |
+0.126 |
+0.174 |
+0.164 |
+0.208 |
+0.174 |
-0.017 |
|
Body fat (%) |
-0.278 |
-0.300 |
-0.315 |
+0.343 |
+0.404* |
+0.409* |
+0.463** |
+0.290 |
-0.010 |
|
Muscle mass (%) |
+0.306 |
+0.451** |
+0.378* |
- 0.435* |
-0.352 |
-0.257 |
-0.273 |
+0.098 |
+0.031 |
|
Note. |
* p < .05, |
** p < .01. + indicates positive correlation; - indicates negative correlation. CMJa countermovement jump with arm swing; SJ = squat jump. |
= |
||||||
Pearson’s correlation coefficients between morphological characteristics and motor performance variables are illustrated in Figure 1. Overall, body height and muscle mass percentage demonstrated significant positive associations with vertical jump performance (CMJa and SJ). Body fat percentage was significantly associated with decreased sprint performance, while also exhibiting a non-significant negative trend with jumping ability.
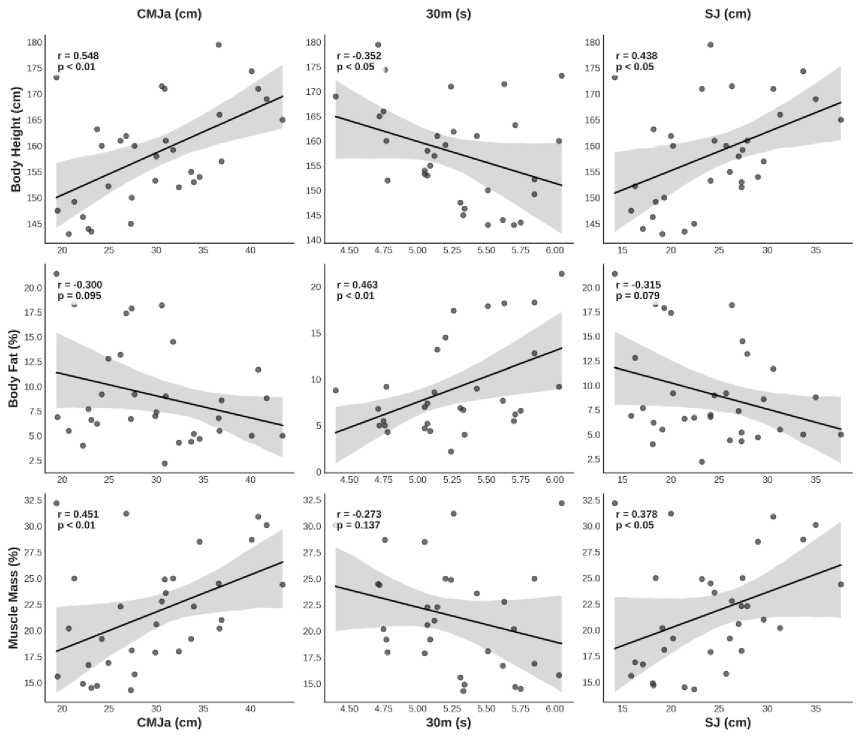
Figure 1. Correlation matrix between body composition and motor abilities.
Table 4 presents a summary of the multiple linear regression models.
Table 4. Multiple regression analysis for motor performance variables
|
Dependent variable |
Predictor |
SE |
β |
t |
p |
|
30 m sprint |
Body fat (%) |
0.01 |
0.56 |
3.99 |
<0.001* |
|
30 m sprint |
Body height |
0.01 |
- .17 |
-1.16 |
0.258 |
|
30 m sprint |
Muscle mass (%) |
0.02 |
- 0.31 |
-1.78 |
0.086 |
|
CMJa |
Body height |
0.03 |
0.51 |
4.47 |
<0.001* |
|
CMJa |
Muscle mass (%) |
0.07 |
0.33 |
2.97 |
0.006* |
|
CMJa |
Body fat (%) |
0.06 |
-0.18 |
-1.69 |
0.098 |
Note: SE = standard error; β = standardized coefficient. * p < 0.05. Model summary: 30 m sprint R² = 0.45, p = 0.001; CMJa R² = 0.52, p < 0.001.
Discussion
The aim of this study was to investigate the relationship between body composition and motor abilities in young soccer players. The statistical analysis showed significant correlations between specific somatic variables (stature, weight, BMI, body fat, and muscle percentages) and motor tests (including short-distance sprints, explosive leg power, and agility). Regarding player height, we found positive associations with jump heights (CMJ, CMJa, and SJ), suggesting that taller athletes benefit from structural advantages when generating vertical force. This matches observations by Pérez-López et al. (2015), who noted that body proportions affect jump mechanics. Conversely, negative links between height and performance in the 20 m and 30 m sprints suggest that taller players may face mechanical disadvantages during early acceleration. This supports the views of Aurélio et al. (2016), who pointed out that longer lower limbs can slow down the initial strides of a run. Similarly, total body mass (BM) by itself is not a direct measure of physical ability. Although heavier players in this study did not perform significantly worse in sprint or agility trials, the correlation results indicate that body mass is best understood by looking at its internal components— specifically, the ratio of muscle to fat. These insights align with Atakan et al. (2017) and Esco et al. (2018), who noted that body mass is most informative when split into its fat and fat-free components.
Okičić, M., Đokić, N., Stanković, D., Mašić, Z., & Mihajlović, M. (2026). Relationship between body composition and motor abilities of soccer players, Sport media and business , 12(2), 11-24 extra body fat increases inertia and limits rapid force development, which is essential for speed and agility. In this study, body fat was the most consistent negative factor for performance, a finding also supported by França et al. (2024), who highlighted fat percentage as the key negative factor for velocity and agility in youth players. In contrast, muscle mass percentage (%MM) was positively linked to jump scores (CMJ, CMJa, SJ) and negatively linked to sprint times, showing that greater muscle mass supports explosive power and running speed. These findings match the work of Pérez-Contreras et al. (2021), Leão et al. (2022), and França et al. (2024).
We conducted multiple regression analyses for variables with significant correlations. The model for the 30 m sprint was statistically significant (R^2 = 0.45, p < 0.01), accounting for 45% of the performance variance. Body fat percentage was the primary predictor (\beta = 0.56, p < 0.001), showing that higher adiposity leads to slower sprint times. Muscle mass percentage showed a marginal trend toward significance (\beta = -0.31, p = 0.086), whereas height did not make a significant contribution (p > 0.05). For the CMJa jump, the regression model was also significant (R^2 = 0.52, p < 0.001), explaining 52% of the variance. Stature (\beta = 0.51, p < 0.001) and muscle mass percentage (\beta = 0.33, p < 0.01) were key predictors, indicating that taller players with higher muscle mass jump higher. The remaining variance suggests that future studies should include a broader range of motor tests to fully capture how body composition influences youth player development. This study focused on male players aged 10 to 13, a development stage marked by major growth differences. Children at this stage may be in pre-pubertal, circ-pubertal, or post-pubertal growth phases, creating notable variations in speed, strength, and motor skills due to biological maturity. Additionally, playing positions likely influence physical profiles, meaning future studies should incorporate position-specific assessments. Key limitations of this study include the modest sample size, the inclusion of male participants only, and the absence of biological maturity markers. The cross-sectional approach prevents us from making causal claims, and bioelectrical impedance analysis can be affected by hydration and external factors. Future research should use larger samples, track maturity markers, and analyze positional differences.
Conclusion
Based on the analysis of the present study, it was demonstrated that body composition metrics correlate significantly with running speed, explosive power, and change-of-direction agility. The evidence indicates that higher relative body fat limits speed, agility, and power, while greater relative muscle mass supports physical fitness. Determining target body composition ranges for young players can significantly benefit coaching and talent development. Consequently, we recommend routine body composition monitoring using validated methods, paired with structured strength and power programs to optimize athletic performance. These findings offer practical insights for coaches and fitness staff designing youth training programs. Future research should involve larger, more diverse samples spanning various age groups and competitive tiers.
Declarations
Funding: This research did not receive any specific grant from funding agencies in the public, commercial, or not-for-profit sectors.
Ethical Approval Statement: This study was approved by the Ethics Committee of the Faculty of Sport and Physical Education, University of Niš (protocol code: 04-542/5).
Informed Consent Statement: Informed consent was obtained from all participants involved in the study.
Conflict of Interest: The authors declare no conflicts of interest regarding this study.
Data Availability Statement: Data supporting this study is available from the authors upon reasonable request.
