Rent-based income redistribution in developed market economies

Author: Izyumov A., Vahaly J.
Journal: Вестник Пермского университета. Серия: Экономика @economics-psu
Section: Экономическая теория
Article in issue: 1 т.16, 2021.
Free access
Public-sector workers in many countries earn more, on average, than their private-sector peers with similar characteristics. In terms of economic theory, these rewards represent economic rents most of which paid by a nation’s taxpayers. In contrast to economic rents accruing to recipients at the top of income distribution, most of these payments flow from one group of workers to another. For this reason, we call these payments “horizontal” economic rents. The level of horizontal rents is analyzed in this paper for 28 OECD countries, mostly representing Europe, based on public-private sector pay gap data from a number of studies. We found that measured as a ratio of public-sector overpayments to GDP, the highest horizontal rents are paid to government workers in Mediterranean EU countries. These rents are relatively low in larger EU countries, such as Germany and the United Kingdom and negative in Scandinavian countries, possibly reflecting the recognition of the non-monetary benefits of public employment, such as job security. Analyzing the determinants of horizontal rents, we found that their levels are lower in countries with stronger trade unions, as measured by trade-unions density and higher in countries with larger foreign-born populations. Macroeconomic variables, including GDP per capita, trade openness, labor force participation and government indebtedness were found to not measurably influence the level of horizontal rents. Further research is seen to be connected with a wider range of the countries under analysis, including the developing countries, and the other groups of employees with the horizontal economic rent, as well as the possible ways to decrease or to invalidate it as regards the practices analysis of the countries with the negligible or negative rent such as Denmark, Norway, Sweden, Portugal, and Iceland.
Economic rents, income redistribution, public employment, public-sector wages, private-sectors wages, trade unions
Short address: https://sciup.org/147246829
IDR: 147246829 | UDC: 330.564 | DOI: 10.17072/1994-9960-2021-1-39-53
Перераспределение дохода работников с учетом экономической ренты в развитых странах
В настоящее время недостаточно исследованы проблемы перераспределения экономической ренты в группах со средним уровнем дохода, таких как работники государственного сектора экономики. При этом во многих странах уровень заработной платы государственных служащих в среднем выше, чем уровень заработной платы работников с аналогичными характеристиками в частном секторе экономики. С точки зрения экономической теории подобная разница в заработках квалифицируется как экономическая рента, которая преимущественно выплачивается из средств, поступивших от уплаты налогов. Для объяснения феномена перераспределения дохода работников частного сектора экономики к государственным служащим предложен новый термин - горизонтальная экономическая рента. На основе статистических данных о разнице в выплатах в государственном и частном секторах экономики и ее соотношения с ВВП страны оценивается уровень горизонтальной экономической ренты для 28 стран - членов ОЭСР, самый высокий уровень которой характерен для стран ЕС Средиземноморского бассейна. Уровень горизонтальной экономической ренты относительно невелик в крупных странах ЕС, например Германии и Великобритании, и является отрицательным в Скандинавских странах. Вероятно, это может быть объяснено наличием неденежных выгод в государственных учреждениях, в первую очередь связанных с гарантиями трудовой занятости. Регрессионный анализ детерминантов горизонтальной экономической ренты выявил, что уровень ренты ниже в странах с высоким уровнем охвата профсоюзным движением работников и выше в странах, где проживает много мигрантов. Определено, что такие макроэкономические показатели, как ВВП на душу населения, открытость торговли, доля экономически активного населения и государственный долг не оказывают серьезного влияния на уровень горизонтальной экономической ренты. Перспективы исследования связаны с возможностью расширить количество исследуемых стран, в особенности стран с развивающейся экономикой, рассмотреть другие группы работников, получающих горизонтальную экономическую ренту, а также определить способы ее сокращения или нивелирования на основе анализа опыта стран, где такая рента незначительна или отрицательна, как в Дании, Норвегии, Швеции, Португалии и Исландии.
Text of the scientific article Rent-based income redistribution in developed market economies
I n competitive labor markets, average wage in public and private-sectors should be roughly the same given comparable worker and job characteristics, geographic location, and other factors. However, numerous studies and anecdotes have exposed public-sector workers overpayment on a significant scale on both national and local levels. For example, in the U.S., a recent
Congressional Budget Office study estimated “unexplained” federal employees’ overpayment at 17% of their average compensation1. Publicsector pay premium was estimated to be 10.6% in Canada, 18.8% in Greece and 26.5% in Spain [1; 2]. Extreme cases of above market compensation of public employees include some US small-city administrators earning annual salaries above $1 million, or California’s beach lifeguards paid two-hundred thousand dollars1.
More generally rent payments to labor from non-competitive outcomes can accrue to various income groups. In addition to horizontal rents that accrue to middle income recipients, one can distinguish “top rents” flowing to the highest-income earners, such as bankers and CEOs, and “bottom rents” captured by low income recipients through fraud and misallocation of welfare payments (See [3]).
While economic rents, flowing to top income groups are widely discussed in the economics literature [4; 5] much less attention has been devoted to rent-type incomes accruing to middle-income groups such as public-sector workers. The excess payments to these workers are economic rents paid to them by taxpayers, most of whom private-sector workers. These rent payments represent redistribution of income from one group of workers to another and can therefore be called horizontal rents.
National differences in the level of horizontal rents are compared in this paper based on the results of several studies examining public-sector compensation. The rent loads and their determinants are analyzed for 28, mostly European OECD countries, for 2007, the last year prior to the Great Recession.
Cumulatively, public-sector pay premiums can be quite significant. For the U.S., the estimated annual total of unexplained pay premiums of federal, state, and local publicsector workers amounts to 1.26% of GDP. In some European countries, public-sector rent loads are higher, such as 2.03% in Greece, 2.54% in Spain, and 2.55% in Portugal. For comparison, these GDP shares are comparable to the level of national governments’ public education spending in these countries.
At the same time in some countries publicsector workers are reported to be underpaid unlike their private-sector peers with similar skills and experience. Negative horizontal rent loads generated by these underpayments are most sizeable in Sweden (–1.51% of GDP), Norway (–1.58%), and Iceland (–1.72%).
Finding the reasons behind particularly generous attitude of some countries to their public-sector workers and lack of such generosity in other countries is the main focus of this paper.
STUDIES OF PUBLIC-SECTOR RENT
F or the US, original research regarding the public-private wage gap may be found in [6; 7] and [8] who estimated that public-sector employees in the U.S. earned 10 to 15% more than their equally skilled and experienced private-sector counterparts. Other research for the U.S. and other countries point to similar results. Thus, S. Nickell and G. Quintini [9] found public pay premium of 5–15% in the UK and 10–20% in Canada, while K.A. Bender [10] estimated it to be 12–23% in Australia2. More recent estimates of public-sector overpayment in the US are found in [13] for state and local government workers and in CBO for federal employees3. M. Gittleman and B. Pierce [13] found the hourly overpayment rate to be between 3–10% for state and 13–18% for local workers. A CBO study4 reported that controlling for observable characteristics, perhour compensation of federal employees in 2010 was 16% above that of private-sector workers5. Using these data and weighing compensation premiums by the number of federal, state and local workers, one analysis [3] estimated the average overpayment rate to be at approximately 13.5% in the US public-sector.
For Canada, C. Lammam et al [1] estimated the 2015 public-sector wage premium using monthly data on individual workers from Canada’s Labor Force Survey. Controlling for gender, age, marital status, education, job tenure, size of firm, type of job, industry, and occupation, the premium was found to average 10.6%. The study also estimated the extent of additional benefits enjoyed by the public-sector employees, including earlier retirement and greater job security. Compared to their privatesector peers, government employees in Canada retire on average 2.3 years earlier and have seven times lower probability of being fired: 0.5% versus 3.8% [1].
For the EU countries, public-private sector differentials have been studied quite extensively. R. Giordano [14] analyzed public pay in ten Eurozone countries (Austria, Belgium, France, Germany, Greece, Ireland, Italy, Portugal, Slovenia, and Spain). They found a net wage gap favoring the public-sector in all but two countries, Belgium and France. M.M. Campos et al [2] estimated the public-sector pay gap for 27 EU countries in 2004–2007 controlling for age, education, gender, and occupation. Of all countries studied, the largest net wage gap was found in Cyprus (39%), Spain (26%) and Luxembourg (25%), followed by Portugal, Italy, and Greece. At the same time Norway, Sweden, Iceland, Denmark and Malta were found to have a negative public-private pay gap, suggesting that public-sector workers in those countries are underpaid compared to their private counterparts1.
Individual EU country results largely confirm the findings of the multi-nation studies. L. Hospido and E. Moral-Benito [16] explored the public-private sector wage gap in Spain accounting for gender, skills, duration of employment, regional differences and various other characteristics and found a 10% hourly wage gap in favor of public workers. In a study of the public-sector wage gap in Greece, R. Christopoulou and V. Monastiriotis [17] estimated the public-sector net premium in 2008 to be approximately 15%. They also found that the net wage gap was at its highest during the global financial crisis when private-sector wages fell but public-sector wages were relatively stable. During the recovery, however, wages in the private-sector increased faster than those in the public-sector, thereby reducing the gap. By 2013, the net public wage premium in Greece had decreased to approximately 10% [17].
Studies for European Post-Communist economies for the same period have largely found similar results. Most of the analyzed countries demonstrated public-sector premiums with the rate of overpayment ranging between 4.2% in Hungary and 11.9% in Poland [2; 18; 19]2.
A number of recent studies of the public pay premium focused on its micro-level determinants. Thus, J. Brueckner and D. Neumark [21] analyzed differences in overpayment of publicsector workers across US states and metro areas. They established that higher premiums are found in states and cities with attractive amenities that discourage taxpayers to vote with their feet against higher local taxes. In a related line of research, R. Diamond [22] found that higher public-sector premiums are also associated with scarcity of land available for residential housing.
Most studies of public-private pay gap report that wherever a public premium is found, it primarily reflects more generous health and pension benefits that on average comprise about one third of total public-sector compensation compared to approximately one quarter of compensation in the private-sector [22]. In addition, many authors stress that income-based comparisons of public- and private-sector pay understate the true public pay premium as it ignores the significantly higher job security afforded to public employment. Existing studies estimate the monetary value of this attribute of public-sector employment at 9–10% of total compensation [8; 23; 24]. An additional premium to public-sector pay could be imputed to reflect other aspects of public employment such as the less strenuous work effort, shorter working hours, and higher frequency of shirking [1; 13; 25]3.
MEASURING HORIZONTAL RENTS
I n the literature, economic rents are typically measured as the cost of rentseeking , a concept originating in the works of G. Tullock [26], A.O. Krueger [27], and others. The latter generally includes the costs of rent-seeking activity itself and the resulting efficiency losses measured by foregone GDP. Estimates of the costs of rent-seeking in the U.S. and other countries are provided in works of A.O. Krueger [27], S. Mohammad and J. Whalley [28], D.N. Laband and J.P. Sophocleus [29], W.R. Dougan [30] and others [31].
In contrast to that, our horizontal rent-load measure focuses on the amounts of direct income transfers from rent-payers to rent recipients. Economic rent, defined as income in excess of marginal productivity, is generated when actual income of a factor of production exceeds its income in a competitive economy.
A rent-based approach to income distribution proposed by the Fabian school [32; 33] and elaborated by A.B. Sorensen [34; 35]. effectively starts with a perfectly competitive economy where every factor of production is paid its marginal revenue product and no exploitation occurs. Corresponding definition of economic rent is as follows:
R i = у ? - y i , (1) where R i is the money value of economic rent for asset i ; y ? is the actual income received on asset i ; y f is income, that would be received under perfectly competitive market conditions [35, p. 1536].
Assets in (1) include labor to allow for the fact that some workers can receive economic rents when compensated above their marginal productivity. In this framework of analysis, we call horizontal rents payments accruing to some groups of workers in excess of compensation that would prevail under competitive economic conditions. In this paper, we are focusing on one type of horizontal rent: overpayment of publicsector workers.
The definition of rents in (1) does not explicitly identify their funding sources. However, it can be assumed that the principal source of public-sector rents is the labor income of a median private-sector worker. Rents are extracted from the income of this worker contemporaneously in the form of higher taxes.
An estimate for the US indicated that in 2012, for an average public-sector worker the horizontal rent payment corresponded to an annual premium of $7,770. If all of this premium were paid by the transfer of income from the private-sector, the corresponding “rent penalty” of an average private-sector worker would amount to $1,580 [3].
To estimate the aggregate value of the rent premium accruing to public workers in a country N, we start with an estimate of the average rate of overpayment of its public-sector workers compared to their private-sector peers. Knowing the average rate of overpayment r n , the aggregate monetary value of the public-sector rent premium accruing to public workers in country N is defined as:
R * = w n L n [ r n / (1+ r n )], (2) where R * is the money value of public-sector rent in country N ; r n is the average rate of overpayment of a public-sector worker compared to his / her private-sector peer; w n is the average compensation of a public-sector worker; L n is the number of full-time publicsector workers1.
For the purpose of cross-country comparisons, horizontal rents are measured as a share of country’s GDP:
h nt = R * / ¥ nt , (3) where hnt is the public-sector rent load ratio in country N in time period t ; R n is the money value of public-sector rent in time period t , Ynt is the country’s nominal GDP in time period t .
The horizontal rent load in (3) can be interpreted as one of the quantitative measures of a difference between income-distribution outcomes in the actual and an ideal, perfectly competitive economy. Since perfectly competitive conditions are impossible to obtain, some level of rents will always be present, with some of it being socially desirable [36]. However, moving from less to more competitive economic conditions should reduce the rent load.
This makes rent beneficiaries natural opponents of competitive markets [35, p. 1535–1538]. The intense political struggle over preservation of public-sector pay and pension benefits in various OECD countries, such as teachers strikes in the US in 2016–2019 and public-sector work stoppages in France in 2019–2020 are recent manifestations.
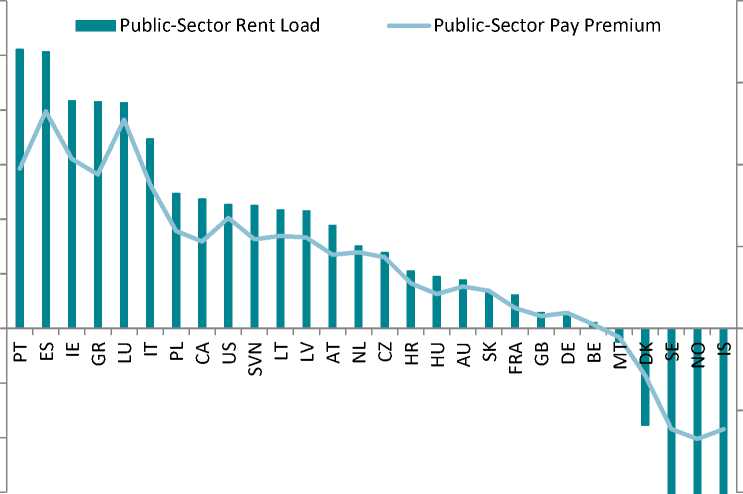
In our investigation, data for computation of rent payments comes from several studies detailed in Table 1 and Figure 1. In each of them, public-sector wage premium is computed following similar methodology. First, gross average employee salaries inclusive of wages and benefits are calculated for private and public-sector workers. Next, compensations of public- and private-sector workers controlled for observable characteristics, such as age, gender, education and experience are compared. Adjusting public-sector wages under this model yields an approximation of the hypothetical earnings of public-sector workers if they were employed under private-sector conditions. Following the literature [1; 2; 17], we term the estimated difference between public- and private-sector workers with similar observable characteristics, the net wage gap or public-sector pay premium. In case of underpayment of public-sector workers compared to their privatesector peers, the term used is public-sector pay penalty.
Table 1. Public-sector pay premiums and rent loads*
Таблица 1. Премиальные выплаты и экономическая рента работников государственных учреждений
|
Country |
Public-sector pay premium |
General government compensation (% of GDP), 2007 |
Public-sector rent load (% of GDP) |
|
Australia |
0.051 |
8.83 |
0.45 |
|
Austria |
0.092 |
10.50 |
0.94 |
|
Belgium |
0.005 |
11.1 |
0.06 |
|
Canada |
0.106 |
11.2 |
1.19 |
|
Croatia |
0.055 |
11.3 |
0.62 |
|
Czech Republic |
0.087 |
8.00 |
0.69 |
|
Denmark |
–0.058 |
15.3 |
–0.89 |
|
France |
0.025 |
12.00 |
0.31 |
|
Germany |
0.019 |
7.1 |
0.14 |
|
Greece |
0.188 |
10.8 |
2.03 |
|
Hungary |
0.042 |
11.2 |
0.47 |
|
Iceland |
–0.123 |
14.0 |
–1.72 |
|
Ireland |
0.207 |
10.1 |
2.09 |
|
Italy |
0.176 |
9.9 |
1.74 |
|
Latvia |
0.111 |
9.8 |
1.09 |
|
Lithuania |
0.113 |
9.6 |
1.09 |
|
Luxembourg |
0.255 |
8.1 |
2.07 |
|
Malta |
–0.011 |
12.3 |
–0.13 |
|
Netherlands |
0.093 |
7.9 |
0.74 |
|
Norway |
–0.135 |
11.7 |
–1.58 |
|
Poland |
0.119 |
10.5 |
1.25 |
|
Portugal |
0.195 |
13.1 |
2.56 |
|
Slovakia |
0.046 |
7.3 |
0.34 |
|
Slovenia |
0.109 |
10.4 |
1.134 |
|
Spain |
0.265 |
9.6 |
2.54 |
|
Sweden |
–0.123 |
12.3 |
–1.51 |
|
United Kingdom |
0.015 |
10.1 |
0.15 |
|
United States |
0.135 |
9.3 |
1.26 |
|
Average |
0.073 |
10.48 |
0.68 |
* Sources for pay premiums [1, p. 5; 2, p. 12, Table 1; 19, p. 22, Table 3; 37, p. 4; 38, p. 16, Table 2].
2,5
0,40
0,30
£
0,20 E
2 i го
0,10 t о ■w
CH
0,00 Л
-0,10
-0,20
Fig. 1. Public-sector pay premiums and public-sector rent loads for 28 countries, 2007
Рис. 1. Премиальные выплаты и экономическая рента работников государственных учреждений в 28 странах, 2007 г.
THE SIZE AND THE DETERMINANTSOF HORIZONTAL RENTS
T he sample of countries for which we have data for public-sector premiums includes 28 countries mostly representing Europe. To determine the publicsector rent loads for these countries, following (3) we used estimates of the net unexplained public-sector pay premium and / or penalty rates ( r ) taken from studies detailed in Table 1 above and data for the public-sector compensation from the OECD (see Table 1). Out of 28 countries in the sample, 23 demonstrate an unexplained public pay premium and five have a public-pay penalty . Countries with the largest public-pay premiums include Spain (26.5%), Luxembourg (25.5%), Portugal (19.5%), and Greece (18.8%). Of the five countries with underpaid public-sector workers, Malta has a relatively small pay penalty of –1.1%, while the other four countries, all Scandinavian, have public-pay penalties ranging from –5.8% (Denmark) to –12.3% (both Iceland and
Sweden), and –13.5% (Norway).
One is tempted to hypothesize that public compensation systems in countries underpaying their public employees implicitly consider difficult-to-measure but very valuable attributes of public employment, in particular higher job security. Based on the Scandinavian sample of countries, the average labor market value of nonmonetary benefits of a public-sector job is close to 10% of the average private-sector pay. It may not be a coincidence that this level of publicsector pay penalty closely matches the estimated value of non-monetary attributes of public-sector employment found in survey-based micro-level studies quoted above (See [23; 24]).
To find the determinants of the public-sector rent load levels for the 28 countries in our sample, we tested a number of variables reflecting macroeconomic, structural, and institutional characteristics of countries.
The level of economic development as measured by real GDP per capita (2011 PPP dollars). The direction of a possible relationship between this indicator and rent loads is ambiguous. On the one hand, countries at a higher level of development could be expected to have more sophisticated institutional checks that would minimize rent flows to government workers. On the other hand, higher income per capita can provide a possibility for a more generous public pay, which may include a renttype premium. In the sample, the highest values of real GDP are for Luxembourg ($97,864) and the United States ($50,898). The lowest values are for Poland ($19,653) and Latvia ($21,939).
The level of national indebtedness measured as a percentage of GDP. Based upon the view that relatively lax fiscal discipline creates additional opportunities for bloated government payrolls this measure can be predicted to be positively correlated with rent loads. However, financial market constraints on the size of a country’s national debt could force its government to take austerity measures that could reduce public-sector rents. In the sample, the debt ratio to GDP is highest in Greece (103%) and Italy (100%), while Australia and Luxembourg have public debt under 10% of GDP.
The degree of trade openness as measured by the ratio of import and export flows to GDP. Generally speaking when foreign trade comprises a larger part of GDP, it should add to the competitiveness of the domestic labor market [39]. In turn, it could be associated with lower levels of public-private wage gaps. Thus, a higher level of this indicator could have a negative impact on rent loads. In our sample, the U.S. economy is the least open with trade share of 28% of GDP while Luxembourg is the most open (332%).
Labor-force participation rates. Higher labor participation rates can reflect a more competitive economic environment that would reduce opportunities for public-sector rents. In addition, higher labor participation rates can be related to smaller scale government programs to support employment implying lower chances for public-sector rents. Both factors should work towards a negative relationship between participation rates and rent loads. In the sample the labor force participation rate is highest for Norway (73%) and Canada (67%). The lowest labor participation rates are in Italy (49%) and Hungary (50%).
Total union penetration. As documented in a number of studies (e. g. Campos et al . [2]), a higher overall labor force unionization rate including public- and private-sector unions generally leads to lower public-private pay gap due to the leveling effects of collective bargaining. That in turn can lead to the lower public-sector rents. In the sample, the total union penetration is the highest in Iceland (84.8%) and Sweden (71.0%) and the lowest in France (7.9%) and Lithuania (9.3%).
Private-sector unionization. A higher level of private-sector unionization can be an obstacle for public-sector workers overpayment. In their negotiations with employers, private-sector trade unions can use their public-sector peers pay as a benchmark. In addition, members of privatesector unions can protest the excessive pay of public-sector workers as taxpayers. In 2011, private unions in the U.S. state of New Jersey openly clashed with the public-sector unions when the latter demanded large pay raises [40]. Thus, the level of private-sector unionization may serve as one of the negative determinants of public-sector rent load. In the sample, largest private-sector trade unionization rates are found in Iceland (90.6%) and the lowest in Hungary (5.4%)
The two binary variables included in the statistical tests aim to reflect national differences rooted in economic histories and institutions of two group of countries. The first includes membership in the South European / Mediterranean-group of countries including Cyprus, Greece, Italy, Malta, Portugal, and Spain. Numerous studies describe these countries as having particularly influential and expansive government bureaucracies [41]. The second group covers Post-Communist countries with a shared history of government-owned and operated economies – Croatia, Estonia, Hungary, Latvia, Lithuania, Poland, Serbia, Slovak Republic, and Slovenia. The legacy of communist bureaucratic controls there could still be strong enough to ensure overpayment of public workers and higher public-sector rents. Alternatively, populations in these nations may have become less tolerant of government graft and incompetence, leading to lower publicsector rent capture.
Share of foreign-born in the population. Nations that have comparatively high levels of foreign-borns are likely to need larger publicsector to provide social services to immigrants and refugees. Larger public-sector employment serving immigrants may generate additional public-sector rents. On the other hand, immigrants themselves are typically lower paid and less likely to be employed in the publicsector that could make their larger population a negative factor for rent loads. In the sample, the immigrant population share is the highest in Australia (24%) and Luxembourg (33%) and the lowest in Poland and Slovakia (both 2%).
A measure of economic freedom from the Heritage Foundation1. Economic freedom could be associated with more competitive labor markets providing less opportunity for publicsector overpayments [42]. However, it could also be true that economic freedom applies only to the private-sector leaving public-sector size and pay levels unaffected. In our sample, Australia, Ireland, and the U.S. have the highest levels of economic freedom (all 0.81 out of 1). It is lowest in Greece (0.58) and Poland (0.59).
Measure of overall corruption as reflected by the Transparency International Corruption Perception Index (TI-CPI) . Most studies of rents agree that corruption is one of the main factors contributing to the generation of rents [43; 44]2. One can hypothesize that countries with higher levels of corruption will also have larger public-sector rents reflecting the power of government bureaucracies to set their own wages. However, higher levels of corruption can also be correlated with underpayment of government workers if they resort to bribes to compensate their low salaries [22]. The TI-CPI variable itself rates lack of corruption on the scale of 0 to 10 with “cleanest” countries having higher scores3. In our sample of countries, the TI-CPI highest score is for Sweden (9.3 out of 10) and lowest for Croatia (4.1).
Descriptive statistics for these variables are listed in Table 2.
Table 2. Descriptive statistics*
Таблица 2. Описательная статистика
|
Variable |
Obs. |
Mean |
Std. Dev. |
Min |
Max |
|
Public-sector rent load |
28 |
0.682 |
1.147 |
–7.72 |
2.56 |
|
GDP per capita ($2011 in 2000s) |
28 |
38,626 |
15,838 |
19,563 |
97,864 |
|
Debt as % of GDP |
28 |
0.44 |
0.26 |
0.06 |
1.03 |
|
Trade openness |
28 |
1.068 |
0.66 |
0.28 |
3.33 |
|
Labor force participation |
28 |
0.603 |
0.075 |
0.49 |
0.83 |
|
Total union penetration |
28 |
31.0 |
20.0 |
7.9 |
84.8 |
|
Private-sector unionization |
28 |
25.5 |
21.2 |
5.4 |
90.6 |
|
South-European |
28 |
0.18 |
0.39 |
0 |
1 |
|
Post-Communist |
28 |
0.29 |
0.46 |
0 |
1 |
|
Foreign-born share |
28 |
0.2 |
0.33 |
0.02 |
0.33 |
|
Economic freedom |
28 |
0.0711 |
0.073 |
0.55 |
0.82 |
|
TI-CPI |
28 |
6.91 |
1.74 |
4.1 |
9.5 |
* Authors’1calculation2from3publication: Index of Economic Freedom, 2019. Heritage Foundation. Available at: (accessed 10.07.2020); OECD: labor force participation, total union penetration, foreign-born share. Available at: (accessed 10.07.2020); Transparency International. Corruption Perception Index, 2019. Available at: (accessed 10.07.2020); World Development Indicators, 2019. World Bank. Available at: dataset/world-development-indicators (accessed 10.07.2020); Visser J. ICTWSS Data base. Version 5.0. Amsterdam, Amsterdam Institute for Advanced Labour Studies AIAS. 2015. Available at: (accessed 10.07.2020); and authors’ calculations (public-sector rent load, see Table 1.).
As defined in (2) and (3), the cost of the horizontal rent collected by the nation’s publicsector workers is the product of the average public-sector worker overpayment and the total size of public-sector payroll measured as a percentage of GDP. In view of the fact that public-sector wages are funded by taxes one can hypothesize that the average rate of public worker overpayment and the relative size of public-sector employment are inversely related. That is, in countries where public-sector workers are particularly numerous, taxpayers are probably less willing to pay them large wage premiums. Alternatively, in countries where public-sector is relatively small, taxpayers may be more willing to grant public workers higher pay and / or pension premiums. If such inverse relationship between overpayment rates and relative size of public labor force is strong enough, the horizontal rent loads in different countries might tend to fluctuate within similar ranges and even gravitate to similar averages.
The simple test of the relationship between overpayment rates and relative size of public labor force for the counties in our sample is presented in Figure 2.
This test indicates a statistically significant inverse correlation between the pay premiums of public workers and their relative numbers as a proportion of total tabor force. However, the relationship is not strong enough to ensure horizontal rent loads to gravitate to similar values across countries1.
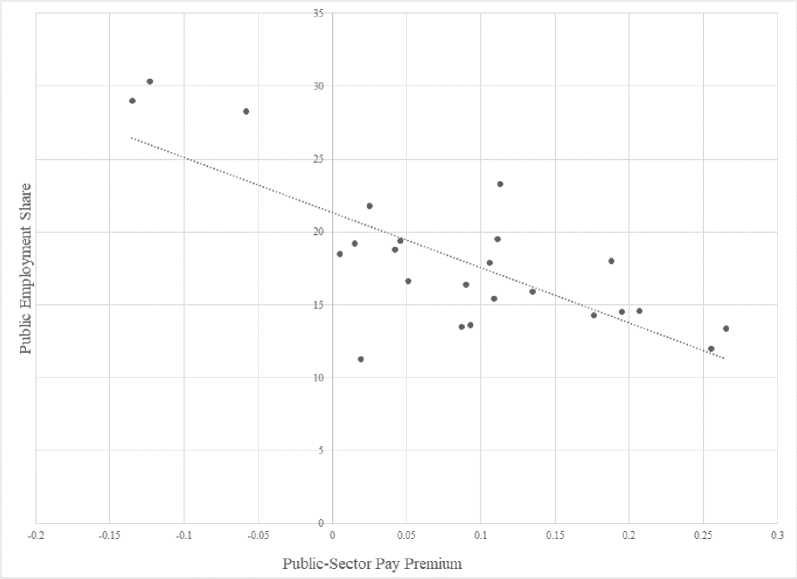
Fig. 2. Public employment share and public-sector pay premium for 24 countries, 2007
Рис. 2. Доля занятых в государственном секторе и премиальные выплаты работникам государственных учреждений в 24 странах, 2007 г.
Tables13 and 4 show the estimations of horizontal rent load determinants. The equations differ by the unionization variable included: total union density rate, and private-sector unionization rate. For each union variable, all other independent variables are included with subsequent estimates identifying the significant determinants of the public-sector rent load.
Table 3. Public-sector rent regression results using total trade union density rate Таблица 3. Результаты регрессионного анализа экономической ренты в государственном секторе с учетом общего коэффициента плотности профсоюзов
|
Variable list |
(1) |
(2) |
(3) |
(4) |
|
GDP per capita (2000s) |
0.009 (0.017) |
|||
|
Debt as % of GDP |
0.665 (1.287) |
–0.04 (0.647) |
||
|
Trade openness |
0.174 (0.311) |
0.182 (0.219) |
0.232 (0.206) |
|
|
Labor force participation |
2.481 (3.859) |
|||
|
Total union penetration |
–0.035*** (0.010) |
–0.034*** (0.009) |
–0.037*** (0.008) |
–0.038*** (0.006) |
|
South European |
1.753** (0.699) |
1.433** (0.400) |
1.377*** (0.337) |
1.442*** (0.323) |
|
Post-Communist |
0.662 (1.183) |
|||
|
Foreign-born share |
6.204* (3.791) |
5.513** (2.437) |
5.549** (2.271) |
5.631*** (1.909) |
|
Economic freedom |
3.514 (3.984) |
2.522 (3.081) |
||
|
TI-CPI |
–0.157 (0.235) |
–0.160 (0.158) |
–0.067 (0.104) |
|
|
Adj.R2 |
0.642 |
0.676 |
0.694 |
0.688 |
|
N |
28 |
28 |
28 |
28 |
Table 4. Public-sector rent regression results using private-sector union density rate Таблица 4. Результаты регрессионного анализа экономической ренты в государственном секторе с учетом коэффициента плотности профсоюзов в частном секторе экономики
|
Variable list |
(1) |
(2) |
(3) |
(4) |
|
GDP per capita (2000s) |
0.012 (0.019) |
0.015 (0.017) |
||
|
Debt as % of GDP |
0.588 (1.384) |
0.283 (1.170) |
||
|
Trade openness |
0.116 (0.370) |
0.024 (0.299) |
0.174 (0.232) |
|
|
Labor force participation |
1.808 (4.130) |
|||
|
Private-sector unionization |
–0.030*** (0.010) |
–0.029*** (0.010) |
–0.029*** (0.009) |
–0.034*** (0.006) |
|
South European |
1.742** (0.752) |
1.725** (0.734) |
1.398*** (0.366) |
1.426*** (0.348) |
|
Post-Communist |
0.690 (1.275) |
0.683 (1.240) |
||
|
Foreign-born share |
6.588* (4.070) |
5.885** (3.655) |
6.294** (2.042) |
6.025** (2.056) |
|
Economic freedom |
4.026 (4.296) |
4.042 (4.199) |
2.994 (3.059) |
|
|
TI-CPI |
–0.183 (0.252) |
–0.164 (0.243) |
–0.194* (0.161) |
|
|
Adj.R2 |
0.586 |
0.604 |
0.681 |
0.639 |
|
N |
28 |
28 |
28 |
28 |
Table 3 contains the first set of regression estimates. None of the macroeconomic variables were significant, indicating that the level of development, national debt load, trade openness, and labor-force participation were not important determinants of public-sector rents. Table 3 estimates use total union density rate as the unionization measure. For all three estimated equations, this variable is significant and negative, indicating that a relatively high levels of unionization of the total labor force reduces the ability of public-sector rent capture. This confirms findings of M.M. Campos [2] and other studies.
Significant variables also include the immigrant population share and membership in the Southern European group of countries both of which are positive. The positive immigration share sign suggests that impact of immigrants’ demand for public services outweighs immigrants’ labor supply impact. Public-sector rent in the South-European countries has the expected positive sign even in the presence of the measure of corruption (TI-CPI). While the TI-CPI (lack of corruption) variable itself has the correct sign, it is not significant. Estimates in columns 2 and 3 find the same results. Estimates in column 4 that contains only significant variables confirm these findings.
The next series of regressions shown in Table 4 changes from the total union penetration variable to the private labor force unionization. This variable is also negative and highly significant. The foreign-born population share and the Southern Europe variables remain positive and significant. The TI-CPI again has the correct sign but is only significant in one of estimates. The macro variables continue to be insignificant.
CONCLUSIONS
In the literature, rent capture by publicsector workers has usually been studied as the public-private pay gap and measured at the micro level for individual workers and / or groups of workers. Our analysis has attempted to quantify the aggregate macroeconomic cost of the public-sector rent. For that purpose, we used the measure of horizontal rent load – the sum of unexplained public-sector overpayments as a percentage of GDP.
Since in developed market economies most of the public-sector wages are paid out of taxes and most taxpayers are private-sector workers, we consider overpayment going to public-sector workers as rents. We call these overpayments horizontal rents as most of them effectively are transfers from one group of workers to another.
Out of 28 OECD countries included in the survey, for 23 nations the horizontal rent load was positive and for five – negative. There was a considerable variation in the level of these rent loads – between 2.5% of GDP in Portugal and negative –1.7% in Iceland. Out of four countries with sizeable negative rent loads, all four are Scandinavian countries. One can hypothesize that in these countries the pay systems consider the unmeasurable benefits of public-sector jobs such as higher job security and less strenuous job effort. Put differently, Scandinavians possibly examine economic situation of their public workers with more attention and are not willing to provide them with pay premiums on top of more favorable working conditions compared to everybody else. “Labor aristocracy” is not welcome there.
For the studied countries as a group we have found an inverse relationship between the relative size of the overall public labor force and the average rate of individual public-sector pay premium. That is, in countries with particularly numerous public workers, average overpayment tended to be lower. In countries with smaller public labor forces these individual overpayments were higher. However, this relationship is not strong enough to ensure a tendency towards horizontal rent load convergence across countries.
Regression analysis of the determinants of rent loads revealed that its level is constrained in countries with higher trade union penetration of the labor force. Larger and stronger privatesector trade unions presumably prevent their public-sector peers from receiving excessively generous benefits.
We also found that horizontal rents are higher in countries with higher proportion of foreign-borns in the population and in the South-European countries. The former is probably linked with the growth of public-sector bureaucracy necessary for serving larger immigrant population. The latter is seen to reflect the traditional power and influence of government bureaucracy in the countries of Mediterranean region.
Importantly, macroeconomic variables, including GDP per capita , trade openness, labor force participation and government indebtedness were found not to influence the level of horizontal rent loads. Similarly, institutional characteristics such as the level of economic freedom and level of corruption were also found not to be the significant determinants of rent loads.
The phenomenon of the public-sector rent has been and keep as is a highly controversial issue. Quantifying the economic cost of economic rent is one of the important ways of evaluating its role in the society, including its impact on fairness in income distribution. Future research could look at other groups of labor receiving horizontal rents and expand the number of studied countries, in particularly countries of developing world. It should also aim to identify ways of containment and possibly elimination of horizontal rents. Experience of countries where such rent loads are negligible or negative, such as Scandinavian countries, could be of particular value in this regard.
References Rent-based income redistribution in developed market economies
- Palacios M., Lammam C., Ren F., Clemens J. Comparing Government and Private Sector Compensation in Canada. Journal of Self-Governance and Management Economics, 2016, vol.4 (1), pp. 95-127.
- Campos M.M., Depalo D., Papapetrou E., Pérez J.J., Ramos R. Understanding the public-sector pay gap. IZA Journal of Labor Policy, 2017, vol. 6 (7), pp. 1-29. DOI: 10.1186/s40173-017-0086-0
- Izyumov A., Vahaly J. Rent-based exploitation: Top, bottom and horizontal. Kyklos, 2014, vol. 67, iss. 1, pp. 74-81. DOI: 10.1111/kykl.12036
- Stiglitz J. The price of inequality. New York, W.W. Norton & Company, 2012. 590 p.
- Piketty T. Capital in the twenty-first century. Cambridge, MA, Harvard University Press, 2014. 640 p. DOI: 10.4159/9780674369542
