Свечение ночной атмосферы в RGB цветовом представлении

Автор: Михалев А.В., Подлесный С.В., Стоева П.В.
Журнал: Солнечно-земная физика @solnechno-zemnaya-fizika
Статья в выпуске: 3 т.2, 2016 года.
Бесплатный доступ
С целью исследования динамики верхней атмосферы рассматриваются результаты фотометрии ночной атмосферы с применением цветной ПЗС-камеры с учетом собственного излучения верхней атмосферы и особенностей его спектрального состава. Использовались данные наблюдений свечения ночной атмосферы за 2010-2015 гг. в Геофизической обсерватории (ГФО) ИСЗФ СО РАН (52° N, 103° E) камерой с охлаждаемой цветной ПЗС-матрицей KODAK KAI-11002. Получены оценки средней светимости ночного неба в спектральных диапазонах R-, G-, B-каналов цветной камеры для региона Восточной Сибири с характерными значениями ~0.008-0.01 эрг·см-2·с-1. Определен сезонный ход светимостей ночного неба в R-, G-, B-каналах цветной камеры, характеризующихся понижением в весенние месяцы, возрастанием в осенние месяцы и наличием летнего максимума, который объясняется рассеянным солнечным светом и связан с месторасположением Геофизической обсерватории. Рассматриваются геофизические явления, имеющие оптические проявления в R-, G-, B-каналах цветной камеры. Показана возможность для некоторых геофизических явлений (геомагнитных бурь, внезапных зимних стратосферных потеплений) количественно связывать усиление сигналов в G- и R-каналах с ростом интенсивностей дискретных эмиссий 557.7 и 630.0 нм, которые доминируют в спектре собственного излучения верхней атмосферы.
Свечение атмосферы, фотометрия
Короткий адрес: https://sciup.org/142103615
IDR: 142103615 | УДК: 551.510 | DOI: 10.12737/19040
Текст научной статьи Свечение ночной атмосферы в RGB цветовом представлении
The glow in the night sky (GNS) can be split into a glow caused by extra-atmospheric sources (stars, planets, nebulae) and a glow of terrestrial origin such as natural airglow, light scattered in the troposphere by extra-terrestrial sources, and multiply scattered sunlight in Earth’s umbra. In clear moonless nights, the fraction of airglow can reach 60 % and more [Fishkova, 1983]. The airglow provides valuable information about aeronomic processes at heights of its luminescence.
GNS components are of particular interest and are normally studied separately.
Nowadays, however, there arise problems that require knowledge of morphology of total (in a spectral range) GNS intensity. First, such problems are associated with climatic changes in the atmosphere [Chefov et al., 2006] and, in particular, with the dynamics of integral GNS, trends and variations in characteristics of aurorae as compared to previous centuries [Vázquez et al., 2016]. Second, GNS determines the minimum night illuminance, which we should know in a 106
number of cases to solve practical problems related for example to the operation of ground- and space-based optical systems [Zuev et al., 1990], peculiarities of human and animal vision under low illuminance, and astronomical observations [Leinert et al., 1998].
Notice that in recent years great attention has also been given to light pollution of the atmosphere. In this case, GNS is a natural background allowing us to determine the level of light pollution, hence the need to know morphology and physics of airglow under diverse heliogeophysical conditions.
In recent decades, the above mentioned problems as well as the possibility of solving them have arisen largely due to the wide practical application of all-new highly-sensitive light receivers, based on CCD sensors, to astronomical, atmospheric, and applied research.
The extensive use of up-to-date color CCD cameras and the current practice to put images online during global heliogeophysical disturbances (large geomagnetic storms, meteorite impacts, etc.) offer an opportunity to employ these images in studies of GNS to gain information on atmospheric disturbances in regions that lack special-purpose geophysical stations. To do this requires data on the response of airglow in spectral ranges, exploited in color channels, to disturbances of various types.
This paper presents some results of studies of GNS carried out at the Geophysical Observatory with the use of a color camera in 2010–2015.
INSTRUMENTATION AND MEASUREMENT TECHNIQUE
Instrumentation
The camera in hand is based on a cooled color KODAK KAI-11002 CCD sensor (camera VideoScan-11002 designed by RPC VideoScan, Russia []). The input objective lens is Mir-20 with a focal distance of 20 mm and a relative aperture of 1:3.5. The camera has a thermally-stabilized housing and a rotating turret assembly; it is pointed at the northern part of the sky, at the celestial pole. A Peltier thermoelectric element is used to directly cool the sensor at 25° relative to the temperature in the housing. The temperature sensor installed in the KODAK KAI-11002 CCD sensor enables us to control its operating temperature through software. The angular field of view of the camera is ~90°; sensor resolution, 4004×2671 pixel.
Choice of exposure period
To reliably detect the airglow, we provided all pixels in the sensor with required light loading exceeding the noise level. This was done by choosing adequate exposure. To suit the requirement for regular observations, the exposure period was taken to be 300 s.
Figure 1 gives a histogram of typical light loading of the sensor. Registration of GNS was almost always accompanied by registrations of the spectrum or the main emission lines of airglow.
Distribution of GNS components over R, G, B channels of the sensor
According to [Fishkova, 1983], the upper atmospheric emission in the visible spectrum during clear moonless nights contributes most significantly to the integral night airglow emission. Figure 2 schematically shows the mean GNS spectrum ( а ) and spectral sensitivity of the KODAK KAI-11002 sensor ( b ). It is worth noting that one of the intensive airglow components in total intensity in spectral ranges of R, G, B channels of the camera is continuum. In the absence of aurorae, hydroxyl emission in the near infrared spectrum can contribute to the signal of the R channel [Ammosov, Gavrilyeva, 1999]. Yet 557.7 and 630.0 nm emissions of atomic oxygen [OI] being the brightest discrete lines both in polar aurorae and in airglow occur respectively in different color channels G and R and are situated in regions with maximum spectral sensitivity of these channels. At middle latitudes, intensities of these emissions during some geophysical phenomena, such as geomagnetic storms ([OI] 630 nm emission) and sudden winter stratospheric warmings ([OI] 557.7 nm emission) can increase by an order of magnitude or more [Mikhalev et al., 2001; Mikhalev et al., 2004]. This allows us to consider the possibility of quantitatively associating the increase in signals in the G and R channels with the increase in intensities of the discrete emissions at 557.7 and 630.0 nm for the above geophysical phenomena.
A decrease in the contribution of the stellar component and its variations to the integral emission can be ensured by the selection of respective area of sky image near the celestial pole.
Absolute calibration
Absolute sensitivity of the camera was assessed with respect to the standard star Dubhe (Dubhe, Alpha Ursae Majoris (α UMa), the apparent stellar magnitude is 1.79 m); its image was in the field of view of the camera and was taken directly during the observation of GNS each clear night in all frames during the night. The absolute calibration technique consisted in choosing several clear nights.
Then, for images, captured during those nights, for each of the RGB channels, we calculated energy luminosities of sensor pixels, which formed the star images, through convolution of spectral sensitivities of the sensor (Figure 1) with spectral energy distribution of the star Dubhe. In our case, due to the long exposure period the star images were obtained in the form of tracks (Figure 3). Next, we compared signals of the light loading of sensor pixels in the star image and adjacent pixels in the background image, using readings of an analog-digital converter (ADC) in the assumption that the light loading of pixels in the background image was made just by GNS. The obtained luminosities enabled us to evaluate the energy value of ADC reading (in erg/(cm2СН∙s∙reading) in order to recalculate night sky luminosities registered during other nights.
Notice that the discrete character of images taken by digital cameras causes some difficulties for quantitative image analysis. In particular, a point star image in the ideal case can expose one sensor pixel to light. The ideality in our case means that the optics in use forms an image of a point object with sizes being smaller than pixel sizes in the sensor. The image does not fall on the boundary between two and more adjacent pixels. Real images depend on amplitude-frequency characteristics of optics, exposure period, and other factors. Figure 3 displays Dubhe images captured during six nights on October 8–13, 2015 ( а ), and for comparison, an image of the Polar Star (Alpha Ursae Minoris, α UMi) ( b ).
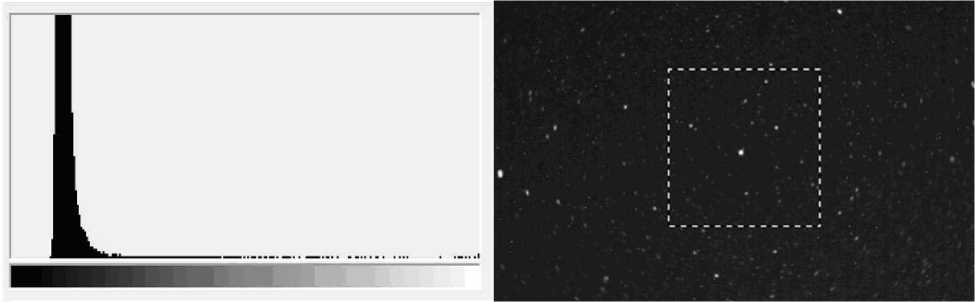
Figure 1. Light loading of the sensor. On the left is a histogram of levels of light loading of sensor pixels, stretched four times its original size. On the right is a scaled-up area of the image. The dashed square denotes a region used to draw the histogram
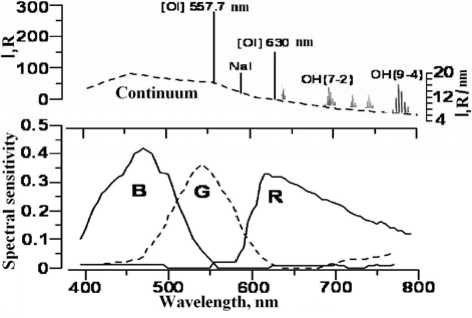
Figure 2. Schematic mean GNS spectrum ( а ) and spectral sensitivity of the KODAK KAI-11002 sensor ( b )
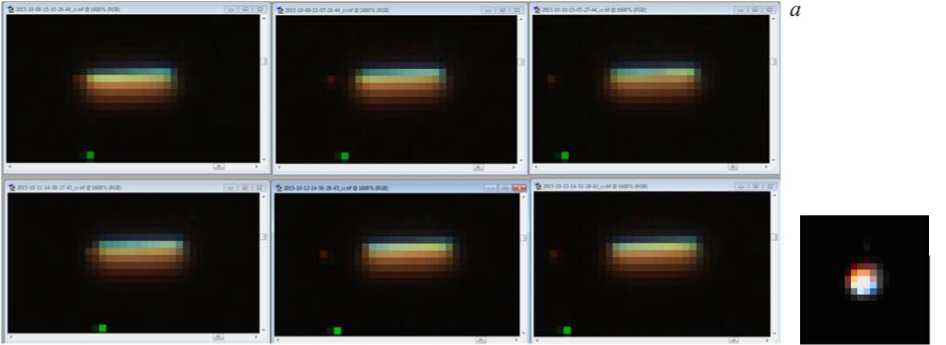
Figure 3. Images of the star Dubhe captured during six nights on October 8–13, 2015 ( а ), and an image of the Polar Star (α UMi) ( b ). The exposure period is 300 s; the binning is 2×2
Sizes and character of blurring of the star (point sources) images in our case are dictated by resolution of the lens employed (~50 line/mm) and the operational mode of the camera (binning is 2×2; exposure period is 300 s). The absolute calibration of the camera and night sky luminosities were estimated by comparing mean ADC values separately for each color R, G, B channels of the sensor in the Dubhe region and in adjacent regions without stars.
We have used data on spectral energy distribution of the star Dubhe [Kharitonov et al., 1978].
RESULTS AND DISCUSSION
Diurnal and seasonal variations of GNS
Interpretation of observed data quite often requires information about diurnal and seasonal variations of GNS. Figure 4 gives examples of night variations of GNS in RGB channels, which show some variability in them. Yet the amplitude of night variations in GNS during moonless nights is relatively low and is lower on average than amplitudes of the main mesospheric Na and OH emissions in the OI 557.7 nm line [Fishkova, 1983; Mikhalev, 2011; Mikhalev, 2011].
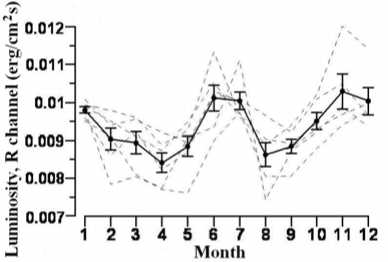
Seasonal variations of GNS, as deduced from data for 2010–2015 for the region of interest, occur regularly: it decreases in spring, peaks in summer, and increases in autumn. Figure 5 illustrates seasonal variations of GNS in the R channel. The thick line shows mean seasonal variations of GNS in the R channel in 2010–2015; thin lines depict seasonal variations for some years of the period under study. We attribute the summer maximum to scattered sunlight due to the Sun being slightly below the horizon during summer months (midnight Sun effect).
Some components of the night sky luminosity according to data acquired in this paper (R, G, B) and in [Chefov, 1962;
Fishkova, 1983; Budnik, Lunev, 2008]
|
Measurement range, nm |
luminosity erg∙cm–2∙s–1 |
|
|
R channel |
Total airglow is 580–800 |
~0.0094 |
|
G channel |
Total airglow is 470–620 |
~0.0078 |
|
B channel |
Total airglow is 400–550 |
~0.01 |
|
[Chefov, 1962] |
Continuum is 400–700 |
~0.021 |
|
[Fishkova, 1983] |
Continuum is 500–700 |
~0.013 |
|
[Budnik, Lunev, 2008] |
Airglow at a wavelength λ=530 nm |
~0.007–0.0185 |
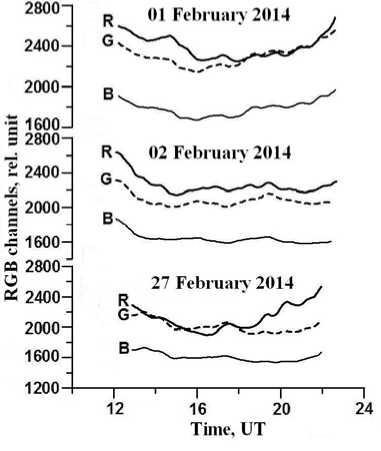
Figure 4. Night variations of GNS in RGB channels during geomagnetically quiet days (February 1 and 2, 2014) and during the magnetic storm on February 27, 2014
In autumn, winter, and spring, seasonal variations of GNS coincides with seasonal variations of its continuum [Fishkova, 1983]. This can be explained by the decisive contribution of GNS continuum to the general night sky luminosity.
Mean luminosities in the celestial pole were ~0.0094, ~0.0078, and ~0.01 erg∙cm–2∙s–1 in the R, G, and B channels respectively.
The table lists the obtained luminosities compared to some published data.
Fishkova [Fishkova, 1983], estimating the absolute intensity of the continuum in a range 500–700 nm, found a value of 4000 R that is equivalent to ~0.013 erg∙cm–2∙s–1 for the average wavelength of 600 nm. Budnik, Lunev [Budnik, Lunev, 2008] discuss the brightness of the airglow in the visible spectrum in a range 3.38·10–7–1.47·10–6 W/(m2∙sr) – it corresponds to luminosity ~7·10–3–1.85·10–2 erg∙cm–2∙s–1.
Geophysical phenomena detectable by color cameras during monitoring of night airglow
Among geophysical phenomena detectable and studied with the aid of color CCD cameras are geomagnetic storms [Podlesny, Mikhalev, 2015], large meteorite impacts [Mikhalev et al., 2014], stratospheric warmings, propagation of mesospheric waves [Mikhalev et al., 2007; Mikhalev, 2011], etc.
Figure 6 gives an example of an optical manifestation of a magnetic storm in RGB channels of the color camera.
The difference between RGB images, obtained from aspect observations and spectrophotometric measurements, enables us to determine heights of polar glow in the main dominant [OI] 557.7 and 630 nm emissions and the distance to the polar glow from an observing site.
a
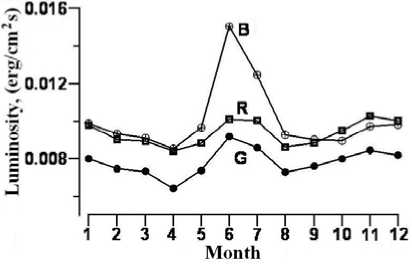
Figure 5 . Seasonal variations of GNS in the R channel ( а ) and in comparison with the RGB channels ( b ). The thick line depicts average variations for 2010–2015; dashed lines show seasonal variations in some years over the period of interest. Vertical lines indicate standard errors
b
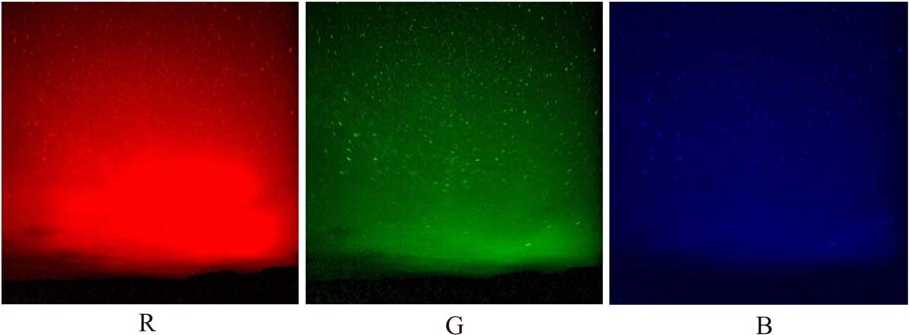
Figure 6 . Optical manifestation of the magnetic storm on March 17, 2015 in RGB channels at the ISTP SB RAS Geophysical Observatory
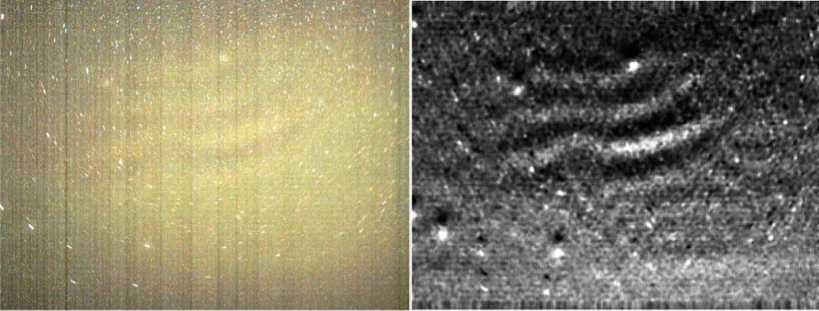
Figure 7 . Optical manifestation of small-scale mesospheric waves registered with the aid of the color camera at the ISTP SB RAS Geophysical Observatory on August 11, 2013 at 17:28 UT. The exposure period is 300 s. On the left is the original frame; on the right, the processed image
Podlesny, Mikhalev [Podlesny, Mikhalev, 2015] indicate that this storm exhibited high correlation between 630 nm emission intensity variations and the signal in the R channel of the color camera.
Figure 7 gives an example of registration of small-scale mesospheric waves. On the left is a segment of the original image; on the right is an image processed to identify low-contrast irregularities (waves). The bright point at the top of the images indicates the Polar Star; in the left bottom corner, UMa stars. The typical transverse scale of the wave disturbances presented in Figure 7 is estimated as ~5.3° or ~9 km in the assumption that the disturbances occur at a height of ~100 km, close to the heights of luminescence of OH (~70–115 km), 557.7 nm emission (~85– 115 km), and continuum (~80–110 km). The horizontal velocity of wave packet is ~15 m/s; its direction is from south to north.
The obtained characteristics of mesospheric waves, shown in Figure 7, are consistent with our results obtained from observations of wave irregularities in hydroxyl emission, which have been made at the ISTP SB RAS Geophysical Observatory [Tashchilin et al., 2010], as well as with results of other works (see, e.g., [Ammosov et al., 2006]).
Thus, the above examples show the possibility in principle to detect and study some geophysical phenomena with color CCD cameras during registration of GNS.
CONCLUSION
We have obtained the following results:
-
1. Using observed data acquired at the ISTP SB RAS Geophysical Observatory in 2010–2015, we obtained the mean night sky luminosity in spectral ranges of R, G, B channels of the color camera for eastern Siberia with typical values ranging from ~0.008 to 0.01 erg∙cm–2∙s–1.
-
2. We determined seasonal variations of night sky luminosities in R, G, B channels of the color camera, which decrease in spring, increase in autumn, and have a summer maximum. The summer maximum in seasonal variations is attributed to scattered sunlight.
-
3. We discussed some geophysical phenomena which had optical manifestations in R, G, B channels of the color camera.
-
4. We established that for some geophysical phenomena it is possible to quantitatively associate signal enhancement in G and R channels with an increase in intensities of 557.7 and 630.0 nm discrete emissions.
This work was carried out as part of the Russia-Bulgaria project "Atmos".
Список литературы Свечение ночной атмосферы в RGB цветовом представлении
- Аммосов П.П., Гаврильева Г.А. Цифровая камера для регистрации пространственной структуры свечения ночного неба//Приборы и техника эксперимента. 1999. № 3. С. 120-124.
- Аммосов П.П., Гаврильева Г.А., Колтовский И.И. Наблюдения короткопериодических волн камерой всего неба в инфракрасном свечении ОН над Якутском//Геомагнетизм и аэрономия. 2006. Т. 46, № 6. С. 801-805.
- Будник А.П., Лунев В.П. Свечение ночного неба Препринт ФЭИ (Физико-энергетический институт) -3139. Обнинск. 2008. 61 с.
- Зуев В.Е., Белан Б.Д., Задде Г.О. Оптическая погода. Новосибирск: Наука, Сиб. отд., 1990. 192 с.
- Михалев А.В, Белецкий А.Б, Костылева Н.В., Черниговская М.А. Среднеширотные сияния на юге Восточной Сибири во время больших геомагнитных бурь 29-31 октября и 20-21 ноября 2003 г.//Космические исследования. 2004. Т. 42, № 6. С. 616-621.
- Михалев А.В. Вариабельность атмосферной эмиссии 557.7 нм//Солнечно-земная физика. Вып. 17. 2011. С. 184-188.
- Михалев А.В., Ратовский К.Г., Медведев А.В. и др. Одновременные наблюдения усиления атмосферной эмиссии 557.7 нм и образования спорадических слоев в периоды температурных возмущений в страто-мезосфере//Оптика атмосферы и океана. 2007. Т. 20, № 12. С. 1071-1076.
- Михалев А.В., Подлесный С.В., Стоева П.В. Оптические характеристики ночного неба в Восточной Сибири после падения Челябинского метеорита. I. Яркость ночного неба//Оптика атмосферы и океана. 2014. Т. 27, № 12. С. 1085-1089.
- Подлесный С.В., Михалев А.В. Спектрофотометрия среднеширотных сияний, наблюдаемых в регионе Восточной Сибири во время магнитных бурь 27 февраля 2014 г. и 17 марта 2015 г.//Международная Байкальская молодежная научная школа по фундаментальной физике. Труды XIV конференции молодых ученых «Взаимодействие полей и излучения с веществом». Иркутск 2015. С. 175-177.
- Тащилин М.А., Белецкий А.Б., Михалев А.В. и др. некоторые результаты наблюдений пространственных неоднородностей в эмиссии гидроксила//Солнечно-земная физика. 2010. Вып. 15. С. 131-134.
- Харитонов А.В., Терещенко В.М., Князева Л.Н. Сводный спектрофотометрический каталог звезд. Алма-Ата: Наука, КазССР. 1978. 198 с.
- Фишкова Л.М. Ночное излучение среднеширотной верхней атмосферы Земли. Тбилиси: МЕЦНИЕРЕБА, 1983. 271 с.
- Шефов Н.Н. Атлас спектра излучения ночного неба λλ 3000-12400 Å. Институт физики атмосферы им. А.М. Обухова РАН. Москва, 1962. 31 с.
- Шефов Н.Н., Семенов А.И., Хомич В.Ю. Излучение верхней атмосферы -индикатор ее структуры и динамики. М.: ГЕОС, 2006. 741 с.
- Leinert Ch., Bowyer S., Haikala L.K., et al. The 1997 reference of diffuse night sky brightness//Astron. Astrophys. Suppl. Ser. 1998. V. 127. P. 1-99.
- Mikhalev А.V. Variability of the 557.7 nm atmospheric emission//Geomagnetism and Aeronomy. 2011. V. 51, N 7. P. 968-973.
- Mikhalev A.V., Medvedeva I.V., Beletsky A.B., Kazimirovsky E.S. An investigation of the upper atmospheric optical radiation in the line of atomic oxygen 557.7 nm in East Siberia//J. Atm. Solar-Terr. Phys. 2001. V. 63, N 9. P. 865-868.
- Vázquez M., Vaquero J.M., Gallego M.C., et al. Long-term trends and Gleissberg cycles in aurora borealis records (1600-2015).//Solar Phys. 2016. V. 291, iss. 2, P. 613-642 DOI: 10.1007/s11207-016-0849-6
- URL: http://videoscan.ru/(дата обращения 19 апреля 2016).
