The Effect of Two Computer Simulations on Learning Quantum Measurement Concepts

Author: Khalid Ait Bentaleb, Saddik Dachraoui, Taoufik Hassouni, Aimad Belboukhari, El Mehdi Alibrahmi
Journal: International Journal of Education and Management Engineering @ijeme
Article in issue: 3 vol.14, 2024.
Free access
The majority of undergraduate students finddifficulty to understand the concept of postulates of quantum mechanics, precisely the postulates of measurement, reduction and evolution. Here, we include In this context we propose a pedagogical innovation technique based on the integration of two simulation projects of Quvis and Quilts. Then, we assess the student's understanding capacity. Here, Our results demonstrate , that the explanation of the postulates of quantum mechanics by manipulating the two simulations by the experimental group , For evaluated our pedagogical innovation , a pre-test and a post-test were administered for two experimental and control groups; the pre-test is composed of 19 multiple choice questions, and the post-test is composed of 12 questions for two groups, one using the simulations during quantum mechanics lectures and the other group learned the course of quantum mechanics without using simulations. A statistical analysis of the results showed that the distribution of pre-test results of the experimental group wasn't normal. In contrast, the distribution of the results of the control group was normal, so the Mann-Whitney U Test analysis showed that there is no difference between the results of the two groups in the pre-test, which shows the homogeneity of the two groups. The distribution of the post-test results of the two groups is normal, so the T-test analysis showed that there is a difference between the results of the two groups, with the average of results of the control group is 7.4, and of the experimental group is 11.4, the comparison of the pre-test and post-test results of the experimental group shows that there is a significant increase in the students' results after the integration of two simulations. The analysis of the results of the quiz showed that there was a significant improvement in understanding of the concepts of measurement and evolution in the group that benefited from the use of the simulations.
Quantum concepts, Computer simulation, Understanding, Visualization, Learning
Short address: https://sciup.org/15019310
IDR: 15019310 | DOI: 10.5815/ijeme.2024.03.01
Text of the scientific article The Effect of Two Computer Simulations on Learning Quantum Measurement Concepts
Today, there is a worldwide competition to master new research and technologies in the subatomic world, which is governed by the laws of quantum mechanics, such as quantum entanglement, which is now used in quantum cryptography [1,2]. The design of future quantum computers based on the Qubit quantum concept, the design of new nonmaterial and applications of Bose-Einstein condensation [3], the development of transistors and semiconductors, The technology of lasers developed at the basis of quantum physics [4], quantum computing [2], the photonics and superconductivity [5], this proves at no time the primordial role of training new researchers, teachers, and engineers with a deep understanding of quantum concepts so that they can innovate and continue this nano-technological progression of the future.
However, the teaching/learning of quantum mechanics knows several difficulties that are linked to several causes of didactic and epistemological orders, such as the misconceptions of learners and teachers, epistemological obstacles, difficult level of abstraction, not intuitive quantum concepts, complicated mathematical formalism, traditional teaching practices, and persistence of classical paradigms. Indeed, several studies have shown that students find it challenging to understand quantum concepts such as the role of observables in the measurement, the probabilistic process of measurement, the reduction of the state during the measurement, and the temporal evolution of a quantum state are still challenging to assimilate according to the students [4-20].
However, several studies suggest innovations in learning quantum concepts, such as the use of new technologies, programming, the use of simulations, experimentation, cartoons, multimedia web, etc. Then, simulations, visualization, and programming are new technologies that can carry out the task effectively. Indeed, among the most essential tools to make the learning/teaching of quantum concepts active are simulations and visualization. In fact, the phenomena at the atomic and subatomic scale governed by quantum concepts are inaccessible to our senses, which is why we do not have daily experiences with the quantum world. On the other hand, much research has focused on the importance of visualization in learning. Furthermore, the research finds that approximately 50% of the brain is related to vision [8], which incites many researchers to focus on the importance of visualization in improving learning mathematics and science [21-25] which proves the use of simulation and visualization in the learning of quantum concepts that are always too abstract, counterintuitive, and far from the daily experiences of the learner.
In this context, several researchers in the field of quantum mechanics teaching research have developed several projects of simulations and visualizations, and computer programs to improve the teaching/learning of quantum concepts, PhEt[26], QuILTs[27], QuVis[28], Quantum Composer [29], Physlet [30, 31, 32, 26, 16, 33], All these projects have proposed series of simulations that have proven their effectiveness in improving the learning of quantum concepts.
the use of the simulation tools mentioned below have shown that there is a very important improvement after their integration in quantum mechanics teaching, thus the use of QuILTs simulations in Zhu's study [20] have been shown the following results, the scores of students who used QuiLts simulations are above 80% while the scores of students who learned quantum mechanics traditionally are below 50%.The use of Physlet simulations increased the students' mean scores from 11% to 66% between a pre-test and post-test [30]. In the study of Singh[27] the authors have proven the effectiveness of QuILTs simulations to improve the understanding of the concept of the temporal development of the wave function from 53% to 85%, and the improvement of the understanding of the uncertainty principle from 42% to 83%.
In the present work, we have studied the effect of the integration of two simulations from the QuILTs and Quivis projects on the learning and understanding of the concepts of measurement, the evolution of the quantum state, and the reduction principle during the measurement. Moreover, the objectives of this study are:
• Assessment the effect of the integration of two simulations in the performance in learning quantum mechanics.
• Checking the increase in performance and understanding of quantum concepts in students who learned the postulates of quantum mechanics using simulations compared to students who learned it traditionally.
• Comprehension of how did the two simulations help the students understand the postulates of quantum mechanics.
2. Materials and Methods
2.1 Description of the two simulations2.1.1 Description of the measurement simulation (QuILTs)
The two simulations used in this study are the Quvis Projects (The Quantum Mechanics Visualisation) and QuILTs projects (Quantum Interactive Learning Tutorials); the descriptions and the aims of the two simulations are shown in Tables 1 and 2.
Table 1. Descriptions of the two simulations
Name of simulation Project Authors Development language Measurement QuILTs s (Singh, 2008) Chandralekha Singh , Wolfgang Christian , Mario Belloni and PER team at the University of Pittsburgh USA JAVA EMeasurement Quvis QuVis ( (Kohnle et al., 2015) Antje Kohnle and his team in university St Andrews Scotland HTML5 JavaScript et Adobe Flash
Table 2. Aims of the two simulations
|
Simulation |
Simulation objective |
|
Measurement |
Understand ing and learning of measurement concepts, measurement difference by position, Hamiltonian, and momentum observables; reduction and evolution of a quantum state. |
|
EMeasuremen t |
The understanding and learning of the probabilistic aspect of measurement, the reduction principle, and the evolution of the probability density. |
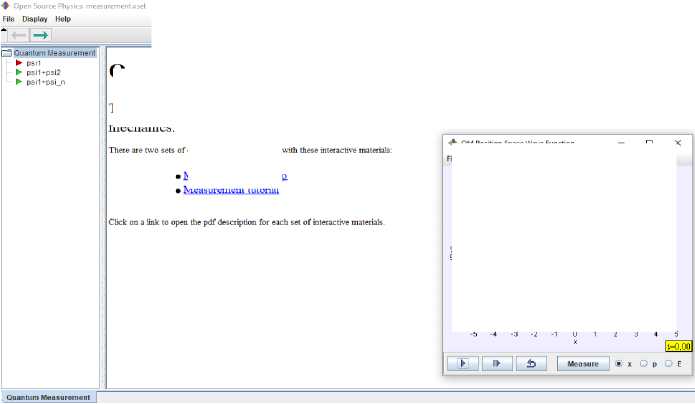
The measurement simulation in the QuILTs project is an interactive simulation whose studied system is a quantum particle confined in a well of infinite potential; the purpose of the simulation is to facilitate the learning and teaching of the process of measurement in quantum mechanics and especially the measurement of the position, momentum and energy, the reduction during the measurement, the distinction between the measurement by the observables Position, Momentum, and Hamiltonian, and the temporal evolution of a state, figure 1 shows the homepage of the simulation.
Measurement Wannup
Measurement tutorial
Quantum Measurement Quilt
This package contains interactive exercises for the teaching and learning of energy and position measurement in quantum mechanics.
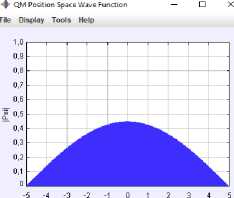
Fig. 1. The home page of simulation Measurement QuILts
The simulation allows the learner to choose the initial quantum state to make the measurement of the momentum, position, and energy and to visualize the result of the measurement, as well as the visualization of the reduction principle immediately after the measurement to visualize the evolution of a stationary state and a non-stationary state and to get an idea on the proper states of each observable. To reinforce the learning of these concepts mentioned above, tasks to accomplish are attached to the simulation, which presents a tool to support and reinforce the learning.
-
2.1.2 Description of the Emeasurement simulation (Quvis)
-
2.2 Study sample
-
2.3 Research Instruments
In this interactive simulation, there are two systems: a particle confined in a well of infinite potential and the harmonic oscillator. The simulation allows the understanding of the probabilistic aspect of the measurement of energy while choosing the quantum state, either a stationary state or a superposed state. The graph shows the density of probability; the learner visualizes well the difference between the evolution of the density of a stationary state and a superposed state. Another thing the student, by manipulating the measure of energy, understands is that the measurement is probabilistic; Figure 2 shows the homepage of the simulation.
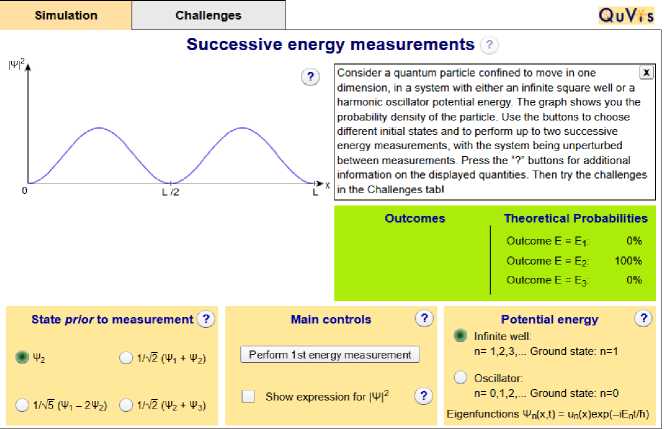
Fig. 2. The home page of simulation Emeasuremnt QuVis
The simulation is interactive; the learner can choose between a stationary or non-stationary state. By manipulating the measurement, students visualize the act of measurement, and some applications are attached to the simulation and present a tool for reinforcement and consolidation of learning.
In this work, we followed this methodology: we divided 70 students who are studying in the Ecole Normale Supérieure Marrakech in the field of education license option Physics-Chemistry into two groups; the students of the first group learned the quantum mechanics with the integration of the two simulations during the learning of the postulates of quantum mechanics and especially the postulates of the measure while opening the discussion to the students to give their interpretations by manipulating the different interactive parameters of two simulations. The students of the second group learned the postulates of quantum mechanics traditionally. Before learning the postulates of quantum mechanics, the students are asked to answer a pre-test to indicate that the two groups have the same prerequisite and are homogeneous and to compare the experimental group by comparing the pre-test and post-test results obtained by the experimental group students. After completing the quantum mechanics course, the students were asked to answer a post-test about the measurement postulates in quantum mechanics.
The data collected from the investigation in this study is done by two tests, a pre-test and a post-test. The pre-test comprises 19 multiple-choice questions to assess the necessary prerequisites and determine the homogeneity of the students of the two groups. The pre-test was developed by us and presented to a professor from the Higher Normal School Marrakech, who teaches quantum mechanics, and two other professors at the Faculty of Sciences, Cadi Ayyad University. Then, after discussion sessions, the questionnaire went through several versions until the final version was used. The reliability was obtained by statistical analysis of the results, which showed that the internal consistency index alpha Cronbach was 0.71, indicating that the investigative tool used was reliable. The pre-test covers Fundamental aspects, the wave-corpuscle duality, Understanding the wave function, the principle of uncertainty and indeterminism, Mathematical formalism, and Dirac notation.
The post-test comprises nine multiple-choice questions and three open-ended questions about the measurement postulates in quantum mechanics. The post-test items are inspired and taken from Measurement Warmup, linked with the Measurement simulation (QuILts), open-source physics; the alpha Cronbach was 0,755. The topics covered by the post-test are the probabilistic aspect of the measurement, the reduction during the measurement, the difference in measurement between the position and Hamiltonian observables, and the temporal evolution of the quantum state.
3. Results
To argue that there is an important impact of the use of the two simulations in the understanding and learning of concepts about the postulates of quantum mechanics and especially the process of measurement, the difference between the measurement by two observables (observable position and Hamiltonian), the concept of reduction and the temporal evolution of a quantum state. Statistical analysis is required to show that there is a significant difference between the results of the two samples. The statistical analysis has been done using the SPSS package version 25, following the statistical protocol below.
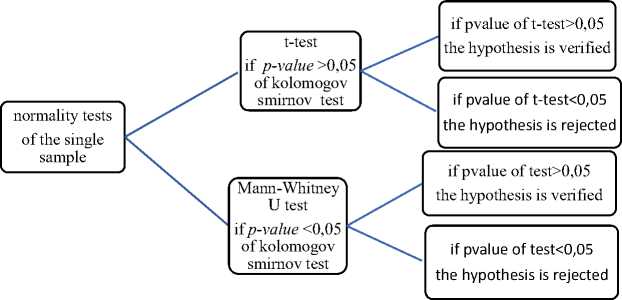
Fig. 3. Flow chart of the statistical analysis of the results using the spss package
-
3.1 Statistical analysis of pre-test results
First, the normality analysis of each of the results of two groups in pre-test and post-test is made, to check whether the distribution of the results of two samples is a normal distribution or not, then the normality tests of Kolmogorov-Smirnova, Shapiro-Wilk, and Kurtosis are made, then the statistical tests gave the following results:
Table 3. Tests of Normality of pret-test
|
Mean |
p-value of Kolmogorov-Smirnovtest |
p-value of Shapiro-Wilk |
Kurtosis |
|
|
Experiment group |
7,798 |
0,029 |
0,108 |
1,989 |
|
Control group |
8,018 |
0,200 |
0,951 |
-0,218 |
The Kolmogorov-Smirnov test gave a significant p-value=0.029<0.05 for the experimental sample (while a p-value>0.05 shows that the distribution is normal). The Kurtosis test is greater than 1 (the distribution is normal if the Kurtosis test is less than 1). The distribution of the pre-test results of the experimental group students is not normal. At the same time, the normality tests of the control group show that the distribution is normal, with a p-value of the Kolmogorov-Smirnov test > 0.05 and a p-value of the Shapiro-Wilktest > 0.05. Then, compare the pre-test results of the two groups to show whether there is a difference between the two groups concerning the necessary prerequisites to learn the postulates of quantum mechanics. On the other hand, since the distribution of the results of the experimental group students is not normal, we recourse to a nonparametric test, which is the Mann-Whitney U Test. The results of this test are given in Table 4.
Table 4. Mann-Whitney U Test of pre-test
|
Null Hypothesis |
Test |
p-value |
Decision |
|
The distribution of Marks is the same across groups of students |
Independent Samples Mann-Whitney U Test |
0,507 |
Retain The null hypothesis |
In fact the comparison of the pre-test results of two groups using the Mann-Whitney U test which gave a p-value=0,507 >0,05 showing that there is no difference between the students of two groups, then the two groups are homogeneous and having the same level of pre-requisite.
-
3.2 Statistical analysis of post-test results
In the same way, in order to compare the post-test results of two experimental and control groups, first of all the statistical analysis of each sample is done by performing the statistical tests of normality, then these tests have given the following results displayed in Table 5.
Table 5. Tests of Normality of post-test
|
Mean |
p-value of Kolmogorov-Smirnovtest |
p-value of Shapiro-Wilk |
Kurtosi s |
|
|
Experiment group |
11,776 |
0,200 |
0,955 |
0,012 |
|
Control group |
7,398 |
0,200 |
0,561 |
0,256 |
The Kolmogorov-Smirnov test gave a significant p-value=0.200>0.05 for the experimental sample, and a p-value=0.200, for control group. Shapiro's test gave that p-value= 0.561 for the control group and a p-value =0.955 for the experimental group.
The two distributions have a bell shape (Figure 4), which shows the normality of the distributions. The comparison of the different means of the two groups shows that they are comparable, and the Skewness and Kurtosis values are less than 1. All these normality tests showed that the distribution of the two groups was normal; to compare the results of the two groups, we resorted to a parametric test, the T-test, and always used the statistical treatment SPSS software.
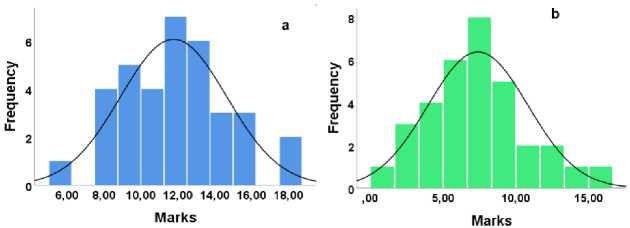
Fig. 4. a. The distribution graph of the experimental group results of post-test; b. The distribution graph of the control group results of post-test
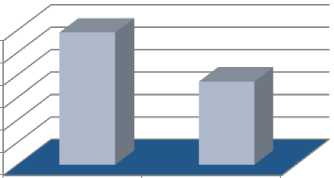
Then, the t-test result with a p-value =0.00 shows that the results obtained are different, with an average of 11.77 for the experimental group and an average of 7.40 for the control group. So, the students who benefited from integrating two simulations obtained better results than those who traditionally learned the postulates of quantum mechanics. Figure 5 shows the difference between the average post-test results of the experimental and control groups.
8 щ
3 6
и 4
experiemental control group group
Fig. 5. Means of the experimental and control group on post-test
-
3.3 Comparison of pre-test and post-test results for the experimental group
Finally, to show the impact of the use of two simulations on the development of comprehension in the students of the experimental group, we compare the results of pre-test and post-test for this group, then the statistical analysis using the Mann-Whitney U Test, gave the following results in the Table 6.
Table 6. Mann-Whitney U Test of pre-test
|
Null Hypothesis |
Test |
p-value |
Decision |
|
The distribution of Marks is the same across groups of students |
Independent Samples Mann-Whitney U Test |
0,000 |
reject The null hypothesis |
The significant p-value is 0.000< 0.05, which means the rejection of the hypothesis that the pre-test and post-test results are the same. There is a difference in the averages obtained by the students before and after the integration of two simulations in the learning of postulates of quantum mechanics. Figure 6 shows the increase in the mean scores of the experimental group in the post-test when compared to the mean scores in the pre-test.
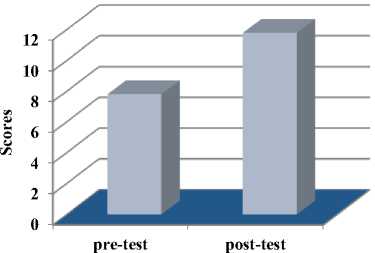
Fig. 6. Means of the experimental group on pre-test and post-test
The question that now arises is how the two simulations helped the students to understand the concepts of the postulates of quantum mechanics, especially the measurement process, the principle of reduction, superposition, and the temporal evolution of a quantum state.
4. Discussions
-
4.1 How do learners better understand the measurement process via the two simulations?
-
4.1.1 The probabilistic aspect of the measurement and the reduction of the state during the measurement
-
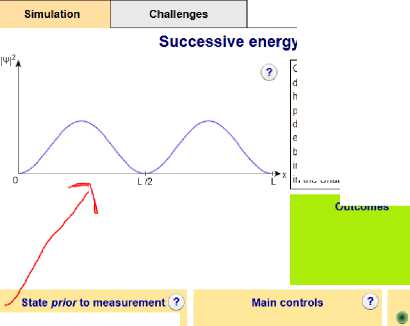
In the EMeasurement (Quvis) simulation, the studied system is a particle confined in a well of infinite potential, the learner chooses an eigenstate of the Hamiltonian, then he makes the measurement, and he finds the certain value E2 , and the state will remain in the eigenstate ψ 2 ) , then by this way of interacting with the simulation, the learner visualizes the act of measurement and the probabilistic aspect of the measurement.
Outcomes measurements
Outcome E = E<
Outcome E = Ej:
Outcome E = E3:
[ Perform 1st energy measurement |
01^ W + чу
I | Show expression for |Ф|'
QuV.s
Consider a quantum particle confined to move in one [x dimension, in a system with either an infinite square well or a harmonic oscillator potential energy. The graph shows you the probability density of the particle. Use the buttons to choose different initial states and to perform up to two successive energy measurements, with the system being unperturbed between measurements. Press the “?" buttons for additional information on the displayed quantities. Then try the challenges in the Challenges tab!
Theoretical Probabilities
0%
100%
0%

Potential energy
Infinite well:
n= 1,2,3,... Ground state: n=1
О 1^ W - 2Фг) о ^ (^2 + Тз)
О
Oscillator:
n= 0,1,2,... Ground state: n=0
Eigenfunctions ФпМ)= Un(x)exp(-iEnt/h)
Fig. 7. The screen shot of the Emeasurement simulation showing the choice of the initial state and the probability density versus time curve and the energy measurement button.
Furth more the students manipulate the simulation, by choosing a superposed state such that:
1 ( ψ 1 - 2 ψ 2))
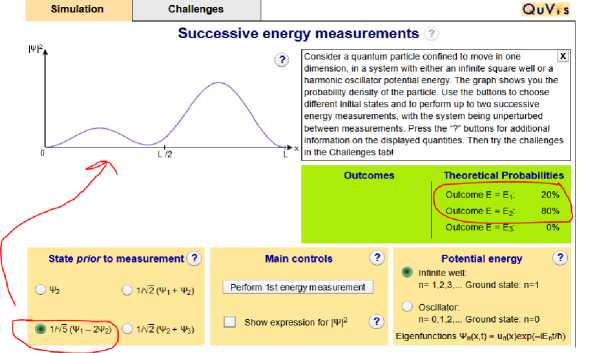
Fig. 8. The screen shot of the Emeasurement simulation showing the choice of the superposed initial state, the development of probability density and the possible energies with their probabilities.
The students by measuring the energy, they visualize the reduction of the state either in ψ1 ) or ψ2 ) , the energy obtained is either E1 or E2, then by carrying out a great number of measurements on the same initial state the students notice that the statistical distribution is probabilistic. On the other hand, the students visualize that the probability density of a superposed state evolves with time while a stationary state its density does not evolve with time.
-
4.2 The difference between the measurement by the position observable and the Hamiltonian observable
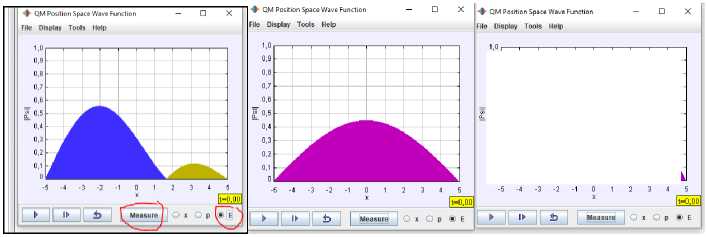
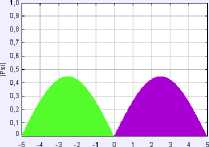
By using the simulation measurement (Quilts), the learners understand well the difference between the measurement by different observables; by choosing the state psi1+psi2 , the students measure by the Hamiltonian observable they find either the stationary state psi1 or psi2 corresponding to the energy E 1 and E 2 , they visualize that the probability density does not evolve with time, after the measurement, while before the probability density evolves with time, the learners visualize well the reduction of the state during the measurement.
(b)
(a)
Fig. 9. Screenshots of the Measurement simulation showing :(a) the initial state psi1+psi2 and the choice of the Hamiltonian observable, (b) the possible state psi1 after the energy measurement, (c) the possible state psi2 after the energy measurement
(c)
After the students will measure with the position observable on the same initial state superposed (figure 9 (a)) the measurement result gives a Dirac peak (figure 10) centered on a possible position value in the potential well, then the students observe that the reduction gives an eigenstate of the position observable which can be a superposition of the eigenstates of the Hamiltonian, the probability density evolves with time, then the learners deduce from the visualization the difference between the measurement by the position observable and the Hamiltonian observable well.
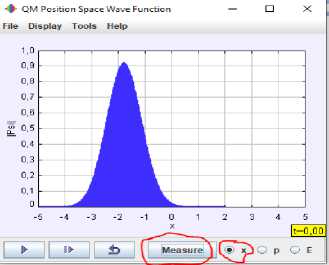
Fig. 10. Screenshots showing the wave function immediately after the measurement by the observable Position
-
4.3 Analysis of the results of the questionnaire items
The comparison of the results of the answers to the 12 items of post-test of the two groups is represented by the Table 7.
Table 7. The mean scores of each post-test question
|
The mean scores of each post-test question |
||
|
Item |
Group used The two simulations |
Group without used The tow simulation |
|
1 |
77% |
85% |
|
2 |
68% |
56% |
|
3 |
80% |
91% |
|
4 |
26% |
38% |
|
5 |
6% |
18% |
|
6 |
23% |
6% |
|
7 |
97% |
42% |
|
8 |
55% |
20% |
|
9 |
87% |
55% |
|
10 |
63% |
14% |
|
11 |
79% |
12% |
|
12 |
47% |
8% |
For questions 6 to 12, the percentage of mean sores is higher for the experimental group, while for questions 1, 2 and 3 the two groups have comparable percentages of mean scores.
For question 9
We suppose that the initial state of a particle is ψ , if we measure the energy of the system we find, choose the good propositions.
-
A. The value E 1
-
B. Any value of the energy En
-
C. Z En
-
D. The probability density ψ ( x , t ) 2 does not vary with time.
The mean scores reached 87% of the experimental group, while only 54% of the control group.
For question 10
We suppose that the initial state ψ of a particle is superposed of the eigenstate and the eigenstate ψ , if we measure the energy of the system we find, choose the good proposals
-
A. Any value of the energy E 1
-
B. E 1 or E 2
-
C. E 1 + E 2
-
D. The probability density 2 varies with time.
The mean scores of the students in the experimental group is 63%, while only 14% of the control group.
Zhu [20] in his study about the probability of energy measurement found that the mean score of the students who used the simulations was 77%.
Students by visualizing through the manipulation of the simulation memorize and understand well the probabilistic aspect of the measurement.
For the question 11
We suppose that the initial state ψ of a particle is superposed of the eigenstate ψ and the eigenstate , if we measure the energy of the system we find, choose the good proposals
-
A. The state of the system after the measurement of the energy is reduced either to the state or to the state
-
B. The state of the system after the energy measurement is a stationary state
-
C. The state of the system after the energy measurement reduces to any eigenstate of energy.
The mean scores reached79% of the experimental group, and only 12% of the students in the control group .
The difference of these percentages between the two groups shows the impact of two simulations to understand the probabilistic aspect of the measurement, the immediate reduction of the state after the measurement, and the evolution of the density of a stationary and non-stationary state.
In the study Zhu[20]) a question was asked to the students about the energy measurement of a superposed state, the mean score of the students who used QuiLTs simulations was 100% completed while the mean score of the students who learned quantum mechanics traditionally was only 40%, the students by manipulating the simulation they visualize the act of the energy measurement and memorize it well.
For the question 12
We suppose that the initial state of a particle is an eigenstate ψ of the energy, we make the measurement by the observable position X . Choose the good propositions
A. The state of the system immediately reduces to a Dirac peak centered on a position
B. The state of the system evolves and does not return to the initial state
C. The state of the system remains in a stationary state after the measurement of the position
D. If after the measurement of the position the energy is measured, the state reduces to any eigenstate of the
5. Conclusion
energy.
Only the mean scores of the students in the control group is 8%, while the mean scores is 47% of the students in the experimental group.
This question investigates the level of understanding of the measurement distinction between two different observables, namely the position observable and the Hamiltonian observable, and the difference in the reduced states immediately after the measurement by each observable.
In the Zhu [20] study a question was asked to the students about the successive energy measurement after the position measurement then the mean scores of the students who used QuiLTs simulations was high at 93% while the mean scores of the students who learned quantum mechanics traditionally was 0% which clearly shows the visual impact of the simulation on the understanding of the difference in measurement between the position observable and the Hamiltonian observable.
In other hand in the questions 9,10- and 12-Time development of wave function has been investigated, the two simulations have well helped the students of experimental group to understand the temporal evolution of quantum states while visualizing them via simulations. Singh [27] found that students' scores increased from 53% to 85% between a pre-test and post-test about the Time development of wave function.
We conclude that the interactivity and manipulation of the simulations and the visualizations significantly develop the understanding and learning of the concepts of measurement, reduction, and evolution of a quantum state, knowing that these concepts are still too abstract and bizarre for the students of the control group. The students, by visualizing the act of measurement, the reduction of the quantum state immediately after the measurement, and the temporal evolution of a stationary and non-stationary state, the tasks to be performed attached with the two simulations constitute tools of reinforcement of the co-understanding of the concepts quoted above. In the case of quantum concepts that have an abstract aspect, counterintuitive and far from the learner's daily life, the quantum mechanics simulations constitute active learning tools that help the students formulate correct conceptions about the quantum concepts.
Acknowledgment
The authors would like to thank the professors who contributed to the validation of the questionnaires, the students who participated in this study, the PER team at the University of Pittsburgh USA for allowing them to use the QuILTs simulation freely, and the PER team in university St Andrews Scotland for allowing them to use the Quvis simulation freely.
References The Effect of Two Computer Simulations on Learning Quantum Measurement Concepts
- Z.Toffano, “Intrication quantique: mythe ou réalité?”Revue Française de Systémique, 2015.
- S. Gambs, “Apprentissage quantique,” doctorate’s thesis University of Montréal, 2008.
- D. A. Muller, “Inside the quantum mechanics lecture: Changing practices,” presented at 28th Higher Education Research and Development Society of Australasia Annual Conference, The University of Sydney Australia, 3-6 July 2005.
- I. D. Johnston, K. Crawford, and P. R. Fletcher, “Student difficulties in learning quantum mechanics,”International Journal of Science Education, vol.20, no. 4, pp. 427-446, 1998.
- H. R. Sadaghiani, “Conceptual and mathematical barriers to students learning quantum mechanics,” doctorate’s thesis, The Ohio State University, 2005.
- M. Ayene, J. Kriek, and B. Damtie, “Wave-particle duality and uncertainty principle: Phenomenographic categories of description of tertiary physics students ’ depictions,” PHYSICAL REVIEW SPECIAL TOPICS - PHYSICS EDUCATION RESEARCH, vol. 7, pp1–13, 2011.
- L.Bao, E. F.Redish, , and E. F. Redish, “Understanding probabilistic interpretations of physical systems : A prerequisite to learning quantum physics Understanding probabilistic interpretations of physical systems : A prerequisite to learning quantum physics,”American Journal of Physics, vol. 70, no, 3, pp. 210–217, 2002.
- K. Cataloglu, “Development and validation of an achievement test in introductory quantum mechanics: the quantum mechanics visualization instrument (QMVI),” doctorate’s thesis The Pennsylvania State University, 2002.
- E., Gire, and C. Manogue, “Making sense of quantum operators, eigenstates and quantum measurements,” In Proc. AIP Conference Proceedings, pp. 195–198. 2012.
- K. Krijtenburg-Lewerissa, H. J. Pol, A.Brinkman, and W. R. Van Joolingen, “Insights into teaching quantum mechanics in secondary and lower undergraduate education,”Physical Review Physics Education Research, vol. 13, no, 1. 2017.
- E.Marshman, and C. Singh, “Framework for understanding the patterns of student difficulties in quantum mechanics,”Physical Review Special Topics - Physics Education Research, vol.11, no. 2, pp. 1–26, 2015.
- M.Oldache, C.Khiari, “Représentations d’apprenants relatives aux concepts quantiques,” Educational Journal of the University of Patras UNESCO Chair, vol. 2, no. 1, pp. 184-197, 2015
- M.Oldache, C.Khiari, “Ce que nous apprend l’histoire des sciences à propos du concept de fonction d’onde et impact sur l’enseignement de la physique quantique,” Educational Journal of the University of Patras UNESCO Chair, vol. 3, no. 2, pp. 287-296, 2016.
- G.Sezgin Selçuk, and S. Çalýskan, “Student Understanding of Some Quantum Physical Concepts,”Latin-American Journal of Physics Education, vol. 3, no. 2, pp. 202–206, 2009.
- C. Singh, “Student understanding of quantum mechanics,” American Journal of Physics, vol. 69, no. 8, pp. 885–895, 2001
- W.Christian, M.Belloni, F.Esquembre, B. A.Mason, L.Barbato, and M. Riggsbee, “The Physlet approach to simulation design,” The Physics Teacher, vol. 53, no. 7, pp. 419-422. 2015.
- C.Singh, and E. Marshman, “Review of student difficulties in upper-level quantum mechanics,”Physical Review Special Topics-Physics Education Research, vol. 11, no. 2,pp. 1–24, 2015.
- C. Singh, and G. Zhu, “Surveying students’ understanding of quantum mechanics,” In Proc. AIP Conference Proceedings, 1289, 301–304, 2010.
- D. F. Styer, “Common misconceptions regarding quantum mechanics,”Americain Journal of Physics, vol. 64, 31-34, 1996.
- G.Zhu, and C. Singh, “Improving students’ understanding of quantum measurement. II. Development of research-based learning tools,” Physical Review Special Topics - Physics Education Research, vol. 8, no. 1, 2012.
- L. R.Aiken, “Intellective variables and mathematics achievement : directions for research,”Journal of School Psychology,vol . 9, no. 2, pp. 201–212. 1971.
- C.Bayrak,“Effects of computer simulations programs on university students’ achievments in physics,”Turkish Online Journal of Distance Education, vol. 9, no. 4, pp. 53–62, 2008.
- K.Chang, , Y.Chen, , H.Lin, , and Y.Sung, “Effects of learning support in simulation-based physics learning,”Computers and Education. vol. 51, pp. 1486–1498. 2008
- P.Shadaan, and L. K.Eu, “Effectiveness of Using Geogebra on Students ’ Understanding in Learning Circles,”Malaysian Online Journal of Educational Technology. vol. 1, no. 4,pp. 1–11. 2013
- C. J.Brigas, “Modeling and Simulation in an Educational Context: Teaching and Learning Sciences,” Research in Social Sciences and Technology. vol. 4, no. 2, pp. 1–12. 2019
- S. B. McKagan, K. K. Perkins, M. Dubson, C.Malley, S. Reid, R. LeMaster, and C. E. Wieman, “Developing and researching PhET simulations for teaching quantum mechanics,” American Journal of Physics vol. 76 no. 4, pp. 406–417, 2008.
- C. Singh, “Interactive learning tutorials on quantum mechanics,”American Journal of Physics, vol.76, pp. 400, 2008.
- A.Kohnle, , C.Baily, A.Campbell, , N.Korolkova, and M. J. Paetkau, “Enhancing student learning of two-level quantum systems with interactive simulations,” American Journal of Physics, vol. 83, no. 6, pp. 560–566, 2015
- S. Zaman Ahmed, , J. H. M.Jensen, C. A. Weidner, J. J.Sørensen, M.Mudrich, , and J.Friis Sherson, “Quantum composer: A programmable quantum visualization and simulation tool for education and research,”American Journal of Physics , vol. 89, pp. 307, 2021.
- M.Belloni, and W.Christian, “Physlets for quantum mechanics,” Computing in Science & Engineering, vol. 5, no. 1, pp. 90–97, 2003.
- G. J. Kelly, R. E. Mayer, S., Editors, G. Kalkanis, P. Hadzidaki, and D. Stavrou, “An Instructional Model for a Radical Conceptual Change Towards Quantum Mechanics Concepts,” Learning.257–280. 2002
- P.Hadzidaki, G.Kalkanis, and D. Stavrou, “Quantum mechanics: A systemic component of the modern physics paradigm,”Physics Education, vol. 35. No. 6, pp. 386–392, 2000.
- A.Kohnle, D.Cassettari, T. J.Edwards, C.Ferguson, , A. D.Gillies, C. A.Hooley, N.Korolkova, J.Llama, and B. D. Sinclair, “A new multimedia resource for teaching quantum mechanics concepts,” American Journal of Physics, vol. 80, no. 2, pp. 148–153, 2012
