
Toward Malaria Burden Eradication: A Tree-Based Ensemble Model for Precise Classification of Malaria Burden on Households
Journal: International Journal of Intelligent Systems and Applications @ijisa
Article in issue: 5 vol.18, 2026.
Free access
Inaccurate classification of the malaria burden on households hinders precise evidence required for effective malaria control through strategic interventions, early detection of risk, optimal allocation of resources, informed decision-making, and formulation of appropriate policies; thus, raising the global malaria burden to approximately 95%. Addressing this menace requires the development of a tree-based ensemble model for precise classification of malaria burden on households, which utilizes characteristic features of data associated with malaria burden on households obtained from the repository of Malaria Indicator Survey of 2015 and 2021 and the Demographic and Health Survey of 2018 respectively, covering six geopolitical zones of the selected households in urban and rural Nigeria. The model incorporates majority voting, k-fold cross-validation and grid search algorithms for optimal model tuning and was implemented in the Python programming language using relevant features of data sourced from these repositories. The model performance was evaluated with precision, recall, F1-score, and Area under Curve (AUC). The overall mean accuracy achieved by the ensemble model classifier was 90.34%, indicating a high level of predictive performance and the model’s suitability for the precise classification task, and outperforming the other base models such as XGBoost (89.61%), Gradient Boosting (93.26%), CatBoost and LightGBM (89.60%), AdaBoost (87.69%). Nevertheless, the significant result is primarily driven by the high feature importance scores of the three most influential features, namely H20 (26.8%), H25 (24.5%), and H26 (21.2%). However, this model offers a practical tool for precise classification, enabling field personnel to identify high-priority areas for intervention. This tool can serve as a valuable asset for government agencies and policymakers by facilitating evidence-based decision-making and the formulation of targeted strategies to alleviate malaria burden on households. By harnessing data-driven insights, interventions can be more precisely directed toward the most vulnerable populations, thereby supporting the eradication of the disease on households. This study would further contribute to the achievement of Sustainable Development Goal (SDG) 3: ensuring healthy lives and promoting well-being for all.
Short address: https://sciup.org/15020675
IDS: 15020675 | DOI: 10.5815/ijisa.2026.05.07
Text of the scientific article Toward Malaria Burden Eradication: A Tree-Based Ensemble Model for Precise Classification of Malaria Burden on Households
Published Online on October 8, 2026 by MECS Press
Malaria burden refers to the measurable impact of the disease on a specific population [1]. It includes a range of influencing factors such as environmental, economic, behavioral, and demographic aspects and is evaluated using
This work is open access and licensed under the Creative Commons CC BY 4.0 License.
indicators like morbidity (case numbers), mortality (death rates), economic costs, and the strain placed on healthcare systems. Additionally, malaria burden is quantified in terms of productivity losses and earnings foregone due to illness-related absenteeism, and cost of treatment [2]. In the WHO (2023) global report, over 263 million infected cases of malaria were recorded and 597,000 deaths annually with 95% (251 million) of all malaria cases and 96% (580,000) malaria deaths associated with sub-Saharan Africa. Similarly, statistics of malaria in Nigeria indicated 68.1 million (28%) active cases and 1,940,000 (31%) deaths with the highest infected population of about 27% in Africa. About one million maternal deaths and nearly 300,000 deaths are attributed to malaria annually in Nigeria. This incidence recorded in the sub-Saharan African region is shown in Fig. 1(a) and (b).
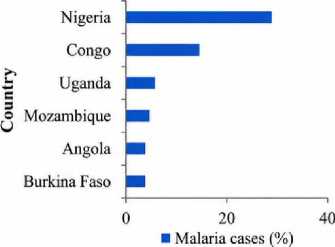
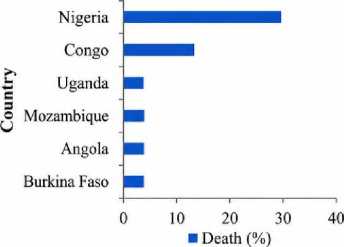
Fig. 1(a). Percentage of six West African Countries with highest malaria Incidence and death (%) [2]
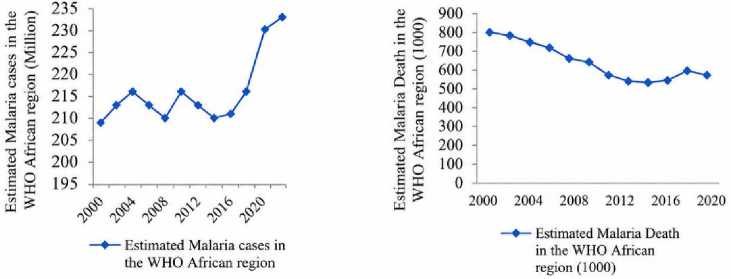
Fig. 1(b). Estimated malaria cases and deaths in the WHO African Region from 2000-2022 [2]
With this prevailing increasing trend among children and adults, there is a need for a retrospective data-driven study that would support evidence-based generation to identify the most vulnerable households especially in the malaria endemic regions. This evidence enhanced proper prioritization of limited resources to the vulnerable groups at any given time. Despite the effort made on adherence to evidence-based recommendation in accordance with the standard and processes [3], precise evidence to support eradication of malaria burden is still inadequate. This precise evidence is hindered by the quality and nature of the data used, including outdated or insufficient datasets, the types of models applied, the lack of advanced technological tools, and the use of inadequate classification systems. However, for effective classification system required to support evidence-based generation of malaria burden, accurate data classification is necessary. Classification of data could be performed either using parametric or non-parametric approach [4]. The parametric approach describes pre-defined fitting functions that superimpose a model on the available data, whereas the non-parametric approach learns the underlying pattern of available data to generate complex models for precise evidence(s) [5]. Data classification using any of the aforementioned approaches could be implemented with machine learning.
In public health research, current applications on the classification of malaria burden on households are focused on parametric models. Examples of these methods are linear regression, Multivariate logistic regression, and Probit regression models [6-8]. These are linear models that superimpose pre-defined functions on the available data of malaria burden obtained from households; hence, they are incapable of generalizing solutions to new sets of data. Also, adapting varying features associated with the malaria burden on households suffers a setback in these models due to limited weights update functions and hyperparameters to support model tuning [9]. To address the challenge of inadequate evidence required for decision-making and fill the research gap posed by the existing models, this study, therefore, focuses on the adoption of a non-parametric model for multi-class classification of the burden of malaria at the household level [10-11]. This is informed by the availability of high dimensional and complex features of data associated with malaria burden as well as the proven effectiveness of the models in terms of preciseness and interpretability of solutions.
Although several non-parametric machine learning approaches have been employed for malaria disease classification using binary classification models [12], to the best of our knowledge, no studies have investigated improving the accuracy of burden classification through a multi-class classification approach. Specifically, such a learning model would provide more precise information for identifying different categories of disease-burdened households, which is essential for planning future needs, setting priorities in health research, supporting strategic interventions and policy formulation aimed at addressing the disease burden on households.
Given the variety of existing machine learning models, this study focuses on supervised learning, which is well-suited for both classification and regression tasks [53-59]. Accordingly, a tree-based boosting ensemble machine learning approach is proposed for implementing multi-class classification of malaria burden among households. This model utilizes characteristic features such as geolocation, socioeconomic status, sociodemographic factors, behavioral risks, malaria treatment history, and women-related indicators. These features are derived from the Malaria Indicator Survey [13-14] and the Demographic and Health Survey [15], covering six geopolitical zones of the selected households in urban and rural Nigeria. The choice of the tree-based boosting ensemble learning is informed by its ability to accomplish accurate classification tasks with interpretability, effectiveness, reduce bias and variance [16]. The implementation of this model will facilitate the generation of accurate evidence to support planning and strategic interventions, particularly in the allocation and prioritization of limited resources for malaria-endemic households. Ultimately, this will contribute to reducing the burden of malaria and advancing progress toward the World Health Organization’s Sustainable Development Goals (SDGs), particularly those targeting good health and well-being.
The paper is organized into 5 sections as follows: section 1 introduces the background study. Section 2 provides a review of related literature in the domain of this research. Section 3 provides the details of the methodology adopted in this study. Section 4 presents the model development, while Sections 5, 6 and 7 provide the conclusions, recommendation and suggestions for future studies, respectively.
2. Related Works
In recent times, the demand for adherence to evidence-based recommendations in accordance with WHO standards and processes [17] has elicited research towards providing precise evidence to guide decision-making and policy formulation on the eradication of malaria burden in Nigeria [41]. Globally, this effort has yielded positive outcomes in the process of eradicating malaria burden at various levels, namely: households, local, state, and national levels of surveillance [18]. Due to the proliferation of computing technologies with support for collaboration in data generation and sharing [19], large volumes of data are easily generated and analyzed with modern tools/ algorithms (e.g., machine learning) to provide accurate evidence for decision-making and policy formulation. Therefore, machine learning models with proven effectiveness in solving data-driven problems in various fields of human endeavors with their capacity to explore intricate and multidimensional patterns inherent in data serve as veritable tools for the generation of precise evidence [61].
Despite huge losses incurred by malaria endemic households and countries in terms of economic burden, impeded economic growth and development, decreased population growth, reduced saving and investment, low productivity by workers, absenteeism, premature mortality, and exorbitant medical costs [20], there is a dearth of literature on availability of stratified information to guide households, caregivers, donor agencies and governments for informed decision making and policy formulation. However, given that malaria vulnerability is shaped by dynamic environmental conditions and evolving socioeconomic and sociodemographic factors [21], data-driven systems that classify households into malaria burden levels (e.g., low to highest burden), thereby supporting timely evidence-based recommendation, are important for improving intervention planning.
Recent studies targeting malaria burdens at the households’ level relied on a parametric-based approach. This approach focused on estimations generated from direct and indirect costs to classify the burden of malaria as either high or low on households [1,7,22-25]. The limitation of these studies stems from the inability of the models to take into cognizance malaria burden on households which unfolds slowly over time, or with seasonal variations [9,26-27]. Also, these studies were grossly inadequate to address high-dimensional features as well as many categories of malaria burden associated with various households in Nigeria [26,28-29]. Lastly, there was inadequate computing software to support the implementation of existing models on real-time applications [30]. A multivariate statistical model, descriptive statistics, measures of central tendency, and dispersion to characterize data obtained from the direct cost of malaria treatment to classify the burden of malaria were adopted in the study of [31]. A retrospective costing approach was also used to quantify the burden of malaria on households based on the assessment of direct medical costs incurred by patients with uncomplicated malaria disease. This approach was incapable of quantifying the varying features associated with malaria burden on households over time. Also, the study was suitable for binary classification, hence unable to address multiclass classification tasks associated with the burden of malaria at household levels. A randomized cross-sectional and hospital-based study to obtain demographic information on households, socio-economic, and environmental variables using a well-structured and pre-tested questionnaire was conducted by [32]. The analysis of data was performed using a descriptive statistical analysis approach. This study was limited to quantifying malaria burden over a predefined period under study, without provision for accommodating the current variable features of malaria burden in households. The burden of malaria in terms of health, adaptation, and natural hazard costs at household levels was classified using survey data collected from western Nepal [33]. Ingredient-based approach and Probit regression model were used to estimate the cost of health and adaptation as well as to assess the relationship between prevalent disease and climate adaptation, respectively. The formulation of relationships between the burden and cost variables was defined without explicitly learning from varying patterns of data to adapt the classification of the burden of malaria on households.
Furthermore, the classification of the economic burden of malaria at the household level for adults and children in low and high malaria transmission areas of central India using the human capital method was also studied by [34]. This study used a linear model that showed interactions between direct and indirect cost features to quantify the burden of malaria on households. However, the linear model used assumed the shape of the model curve before performing model fitting, thereby being unlikely to match the underlying patterns of data associated with the classification of malaria burden on households. Therefore, to fill the knowledge gap existing between the parametric-based approach and classification of malaria burden on households, a non-parametric approach (e.g., machine learning model) will be adopted to address the following research questions on the classification of the burden of malaria on households, namely:
• What are the valid predictors of malaria burden required for the development of a precise classification model?
• How can we develop a model that performs accurately in one distribution and also generalizes well in another distribution during the classification of malaria burden on households?
• How can the classification of malaria burden on households inform evidence–based decision-making and strategic formulation of policies?
3. Methodology3.1. Data Collection
Data was sourced from the repository of the Malaria Indicator Survey (MIS) of 2015 and 2021 and the Demographic and Health Survey (DHS) 2018 domiciled at “https://DHSprogram.com/data/dataset”, covering six geopolitical zones of the selected households in urban and rural Nigeria, as presented in Table 1. Both databases comprise internationally recognized malaria indicators used to assess the impact of interaction on households and complex features such as household ownership of insecticide-treated mosquito nets and their use by vulnerable populations (e.g., children under five years old, pregnant women). They also provide information on intermittent preventive treatment against malaria during pregnancy, the type and timing of treatment of high fever in children under five years old, indoor residual spraying of the insecticide to kill mosquitoes, and diagnostic blood testing of children under five years old. The characteristic features of MIS, such as socioeconomic, socio-demographic, behavioral risk features, and malaria treatment features (in terms of direct and indirect costs), have been studied individually to classify malaria burden. However, this study combines relevant features related to malaria burden drawn from MIS and DHS data to implement a tree-based boosting ensemble learning model for precise classification of malaria burden on households.
Within the scope of the reviewed literature, no study to date has implemented a multi-class classification model for the classification of malaria burden on households in Nigeria using a tree-based boosting ensemble approach. This gap underscores the relevance and necessity of the present study.
A tree-based boosting learning model for precise evidence-based classification of malaria burden on households was designed, implemented, and evaluated using appropriate software tools and techniques. In the design phase, a Structured System Analysis Design Methodology (SSADM) is adopted, while Python programming language and related libraries are used for the implementation of the system. SSADM defines a software design technique that implements a framework of research steps and stages defined with inputs and deliverables in each of the stages. The study implements a classification model using tree-based boosting ensemble learning with data sets sourced from the repository of the National Malaria Indicator Survey and the Demographic and Health Survey covering six geopolitical zones of the selected households in urban and rural Nigeria within the periods of 2015, 2018, and 2021 [13-15], respectively. The study adopts feature engineering techniques and a tree-based boosting ensemble model to construct relevant features and model a multiclass solution for the classification of malaria burden on households, respectively.
Table 1. Source of data obtained from MIS and DHS
Name Source Year No. of households No. of features MIS 2015 2015 8,034 3,293 DHS 2018 2018 127,542 1,202 MIS 2021 2021 14,475 1,648
The selection of features based on characteristic indicators was informed by existing studies [7,32,34-40,42-46]. The summary of the features obtained from the MIS and DHS datasets, curated from the six geopolitical zones of the selected households in urban and rural Nigeria, is presented in the excerpt of Table 2. A total of 70,428 household instances with 40 features were extracted from the repositories for use in implementing the proposed learning model. Furthermore, the categories of MIS and DHS features associated with malaria burden considered in this study are those extensively examined and documented in the works of [1,7,47].
Table 2. Excerpt of curated features of MIS and DHS data from household covering six geopolitical zones of the selected households in urban and rural Nigeria
|
Sample strata for sampli ng error |
Region |
Type of place of reside nce |
Source of drinking water |
Main floor material |
Main wall materi al |
Main roof materi al |
Numb er of househ old memb ers |
Number of children 5 and under (de jure) |
Sex of head of househol d |
Age of head of household |
Wealt h index combi ned |
|
Benue_ Urban |
Benue |
Urban |
Protected well |
ceramic tiles |
cement |
metal/z inc |
7 |
1 |
Male |
39 |
Richer |
|
Benue_ Urban |
Benue |
Urban |
Protected well |
ceramic tiles |
cement |
metal/z inc |
7 |
1 |
Male |
39 |
Richer |
|
Benue_ Urban |
Benue |
Urban |
Protected well |
ceramic tiles |
cement |
metal/z inc |
7 |
1 |
Male |
39 |
Richer |
|
Benue_ Urban |
Benue |
Urban |
Protected well |
ceramic tiles |
cement |
metal/z inc |
7 |
1 |
Male |
39 |
Richer |
|
Benue_ Urban |
Benue |
Urban |
Protected well |
ceramic tiles |
cement |
metal/z inc |
1 |
0 |
Female |
33 |
Richer |
|
Benue_ Urban |
Benue |
Urban |
Ponds/str eams /canal/rai n |
cement |
cement |
metal/z inc |
1 |
0 |
Male |
27 |
Richer |
|
Benue_ Urban |
Benue |
Rural |
Ponds/str eams /canal/rai n |
earth/san d |
Bambo o with mud |
metal/z inc |
7 |
2 |
Male |
37 |
Poorer |
|
Benue_ Urban |
Benue |
Rural |
Ponds/str eams /canal/rai n |
earth/san d |
Bambo o with mud |
metal/z inc |
7 |
2 |
Male |
37 |
Poorer |
|
Benue_ Urban |
Benue |
Rural |
Ponds/str eams /canal/rai n |
earth/san d |
Bambo o with mud |
metal/z inc |
7 |
2 |
Male |
37 |
Poorer |
|
Benue_ Urban |
Benue |
Rural |
Bottled water |
earth/san d |
Bambo o with mud |
metal/z inc |
7 |
2 |
Male |
37 |
Poorer |
|
FCT_U rban |
FCT |
Urban |
Bottled water |
ceramic tiles |
cement |
metal/z inc |
5 |
3 |
Male |
40 |
Richest |
|
FCT_U rban |
FCT |
Urban |
Bottled water |
ceramic tiles |
cement |
metal/z inc |
5 |
3 |
Male |
40 |
Richest |
|
FCT_U rban |
FCT |
Urban |
sachet water |
ceramic tiles |
cement |
metal/z inc |
5 |
3 |
Male |
40 |
Richest |
|
FCT_R ural |
FCT |
Rural |
sachet water |
ceramic tiles |
cement |
metal/z inc |
5 |
1 |
Male |
35 |
Richest |
|
FCT_R ural |
FCT |
Rural |
sachet water |
ceramic tiles |
cement |
metal/z inc |
5 |
1 |
Male |
35 |
Richest |
|
FCT_R ural |
FCT |
Rural |
sachet water |
cement |
cement |
metal/z inc |
4 |
2 |
Male |
37 |
Richest |
|
Kogi_U rban |
Kogi |
Urban |
tube well or borehold |
cement |
cement |
Metal/z inc |
7 |
0 |
Male |
49 |
Richer |
-
3.2. Data Preparation
-
3.3. Feature Extraction
-
3.4. Feature Selection
In this study, the data was prepared for precise classification through appropriate feature engineering processes. The need for feature engineering in data preparation is to gain insight into the raw data and to construct suitable features to meet the requirements for training and testing the learning model. However, the dataset in this work was categorized based on its characteristic features such as household, socioeconomic, sociodemographic, behavioral risk, malaria treatment, and women-related features. In addition, feature engineering activities included feature extraction, vectorization of textual features, encoding, and transformation of numeric/categorical features, selection of features, normalization, and exploratory data analysis, and are presented in Fig. 2.
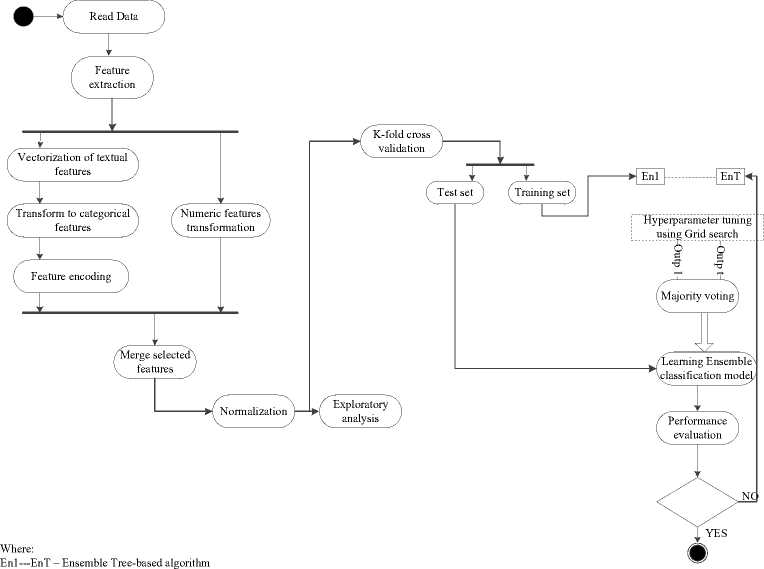
Fig. 2. Activity diagram of the proposed work
The features obtained from MIS and DHS data comprise both textual and numeric features associated with the malaria burden on households. To discretize the text-based features, a vectorization algorithm such as bag-of-words [48] was used to construct corresponding numeric features appropriate for building a learning model. The choice of this algorithm is due to its ability to convert raw data into a numeric format, thus making it suitable for machine learning tasks. Similarly, the discretized texts consisted of short word responses. To measure the similarity between the discretized multi-dimensional features of data, K-means clustering [49] with Euclidean distance was employed to group feature vectors and identify varying levels of malaria burden across households. The selection of the K-means algorithm was influenced by its intrinsic clustering capability, which is notably sensitive to the initialization of cluster centers.
The outcome of this process is shown in Table 3. Following the discretization process, ordinal encoding [50] was applied to convert text-based high-dimensional features into numerical values, as illustrated in Table 4. This transformation produced a set of discrete values with an inherent ranked order, effectively reducing the dimensionality of the features within the vector space.
Feature Selection was performed on the data using Pearson’s correlation matrix [51] which produces a pairwise table of correlation coefficients. Generally, a correlation coefficient above 0.90 is regarded as a very high correlation while the values between 0.70 and 0.89 are often regarded as a high correlation. A correlation between the values of 0.30 and 0.69 is regarded as a moderate correlation, while 0.30 to 0.49 signifies a low correlation, and below 0.29 is without any correlation [51].
In this study, features ranging from 0.30 to 0.89 are considered relevant features without dependency. However, a correlation coefficient ranging from 0.80 to 1.00 is considered a highly dependent feature, and one of such features is discarded to minimize bias in the learning model. In line with the existing studies, a total of twenty-six input features were selected ensuring that the most relevant variables were selected for effective modeling. Our classification task focused on four distinct target classes: Y1 (Lowest Burden), Y2 (Low Burden), Y3 (High Burden), and Y4 (Highest Burden), and these were used to guide the predictive analysis. A comprehensive overview of these selected relevant input features, along with their corresponding descriptions, is provided in Table 5.
Table 3. The excerpt of the discretized features
|
Regio n |
Type of place or origi n |
Sex of head of househol d |
Age of head of househol d |
Number of househol d member s |
Numbe r of childre n 5 and under 5 years |
Source of drinkin g water |
Main floor materi al |
Main wall materi al |
Main roof materi al |
Has mosquit o net for sleeping |
Numbe r of mosquit o net |
Numb er of childr en under mosqu ito net previo us night |
|
X3 |
X4 |
X5 |
X6 |
X8 |
X9 |
X10 |
X11 |
X12 |
X13 |
X14 |
X15 |
X16 |
|
18 |
1 |
1 |
50 |
14 |
3 |
31 |
34 |
33 |
12 |
0 |
0 |
0 |
|
18 |
1 |
1 |
50 |
14 |
3 |
31 |
34 |
33 |
12 |
0 |
0 |
0 |
|
18 |
1 |
1 |
50 |
14 |
3 |
31 |
34 |
33 |
12 |
0 |
0 |
0 |
|
18 |
1 |
1 |
50 |
14 |
3 |
31 |
34 |
33 |
12 |
0 |
0 |
0 |
|
18 |
1 |
1 |
50 |
14 |
3 |
31 |
34 |
33 |
12 |
0 |
0 |
0 |
|
18 |
1 |
1 |
50 |
14 |
3 |
31 |
34 |
33 |
12 |
0 |
0 |
0 |
|
18 |
1 |
1 |
50 |
14 |
3 |
31 |
34 |
33 |
12 |
0 |
0 |
0 |
|
18 |
1 |
1 |
50 |
14 |
3 |
31 |
34 |
33 |
12 |
0 |
0 |
0 |
|
18 |
1 |
1 |
50 |
14 |
3 |
31 |
34 |
33 |
12 |
0 |
0 |
0 |
|
18 |
1 |
1 |
50 |
14 |
3 |
31 |
34 |
33 |
12 |
0 |
0 |
0 |
|
18 |
1 |
1 |
40 |
6 |
3 |
31 |
34 |
33 |
12 |
0 |
0 |
0 |
|
18 |
1 |
1 |
40 |
6 |
3 |
31 |
34 |
33 |
12 |
0 |
0 |
0 |
|
18 |
1 |
1 |
40 |
6 |
3 |
31 |
34 |
33 |
12 |
0 |
0 |
0 |
|
18 |
1 |
1 |
40 |
6 |
3 |
31 |
34 |
33 |
12 |
0 |
0 |
0 |
|
18 |
1 |
1 |
40 |
6 |
3 |
31 |
34 |
33 |
12 |
0 |
0 |
0 |
Table 4. Excerpt of encoded features
|
House hold code |
Type of place of reside nce |
Mai n roof mat erial |
Sex of head of house hold |
Has mosquito net for sleeping |
Curre ntly pregn ant |
Source of drinking water |
Main floor material |
No. of children under 5 slept under mosquito net last night |
Type pf mosquito net slept under last night |
Wall material |
Age of head of household |
|
A01 |
1 |
2 |
2 |
2 |
1 |
2 |
1 |
1 |
2 |
1 |
3 |
|
A02 |
1 |
2 |
2 |
2 |
1 |
2 |
1 |
3 |
2 |
1 |
3 |
|
A30 |
1 |
2 |
2 |
1 |
1 |
2 |
1 |
3 |
2 |
1 |
1 |
|
A31 |
1 |
2 |
2 |
1 |
1 |
2 |
1 |
3 |
2 |
1 |
1 |
|
A33 |
1 |
2 |
2 |
1 |
1 |
2 |
1 |
3 |
3 |
1 |
1 |
|
A07 |
1 |
2 |
2 |
2 |
2 |
2 |
1 |
3 |
3 |
1 |
3 |
|
A58 |
2 |
1 |
1 |
2 |
0 |
2 |
1 |
0 |
0 |
2 |
1 |
|
B526 |
2 |
1 |
1 |
2 |
0 |
2 |
1 |
0 |
0 |
2 |
1 |
|
B9827 |
2 |
1 |
1 |
2 |
0 |
2 |
1 |
0 |
0 |
2 |
1 |
|
C5982 |
2 |
1 |
1 |
2 |
0 |
2 |
1 |
0 |
0 |
2 |
1 |
|
C5989 |
2 |
1 |
2 |
2 |
0 |
2 |
1 |
0 |
0 |
0 |
1 |
Table 5. Selected Relevant Input (valid predictors) features used for learning
|
S/n |
Selected Input Features |
Description |
|
1 |
Wealth index |
H1 |
|
2 |
number of household members |
H2 |
|
3 |
Number of children 5 and under |
H3 |
|
4 |
Main floor material |
H4 |
|
5 |
Wall material |
H5 |
|
6 |
Number of mosquito bed nets |
H6 |
|
7 |
Number of children under mosquito bed net previous night |
H7 |
|
8 |
Type of mosquito bed net(s) slept under last night |
H8 |
|
9 |
Children under 5 slept under mosquito bed net last night (household questionnaire) |
H9 |
|
10 |
Result of the malaria test |
H10 |
|
11 |
Relationship to household head |
H11 |
|
12 |
Ideal number of children (grouped) |
H12 |
|
13 |
Husband/partner worked in last 7 days/12 months |
H13 |
|
14 |
Respondent currently working |
H14 |
|
15 |
Cost of treatment of fever (#) |
H15 |
|
16 |
Household has: electricity |
H16 |
|
17 |
Literacy |
H17 |
|
18 |
Type of cooking fuel |
H18 |
|
19 |
Number of days after fever began sought advice or treatment |
H19 |
|
20 |
Currently pregnant |
H20 |
|
21 |
Duration of pregnancy (months) |
H21 |
|
22 |
Proportion of children under 5 and below over the total no. of household |
H22 |
|
23 |
Proportion of ideal children under 5 and below over the no. of ideal children in the household |
H23 |
|
24 |
Levels of burden for children under 5 who slept under mosquito net |
H24 |
|
25 |
Level of burden associated with proportion of mosquito net per no. of household. |
H25 |
|
26 |
Level of burden associated with proportion of children under mosquito net previous night over ideal children. |
H26 |
To adjust numerical features to a specific range, typically between 0 and 1, for suitability in machine learning classification, normalization was applied for feature scaling. In this study, the Min-Max normalization method [50] was utilized to rescale the numerical values in the dataset, as presented in Table 6.
Table 6. Excerpt of Normalized dataset
|
No. of household members (X8) |
Number of children 5 and under (de jure) (X9) |
Ideal number of children (grouped) (X32) |
Husband worked in last 7 days/12 months (X34) |
Cost of treatment of fever (naira) (X37) |
Number of days after fever began sought advice or treatment (X44) |
Duration of pregnancy (month) (X46) |
Proportion of children under 5 and below over the total no. of households (X9/X8) |
|
0.619047619 |
0.375 |
0.714285714 |
0.125 |
0 |
0 |
0 |
0.214285714 |
|
0.619047619 |
0.375 |
0.714285714 |
0.125 |
0 |
0 |
0 |
0.214285714 |
|
0.619047619 |
0.375 |
0.714285714 |
0.125 |
0.030241935 |
0 |
0 |
0.214285714 |
|
0.619047619 |
0.375 |
0.71428571 |
0.125 |
0.030241935 |
0 |
0 |
0.214285714 |
|
0.619047619 |
0.375 |
0.71428571 |
0.125 |
0 |
0 |
0 |
0.214285714 |
|
0.619047619 |
0.375 |
0.71428571 |
0.125 |
0 |
0 |
0 |
0.214285714 |
|
0.619047619 |
0.375 |
0.428571429 |
0.125 |
0 |
0 |
0.444444444 |
0.214285714 |
|
0.619047619 |
0.375 |
0.285714286 |
0.125 |
0.02016129 |
0.01666667 |
0 |
0.214285714 |
|
0.619047619 |
0.375 |
0.571428571 |
0 |
0.02016129 |
0 |
0 |
0.214285714 |
|
0.619047619 |
0.375 |
0.857142857 |
0.125 |
0.02016129 |
0 |
0 |
0.214285714 |
4. Model Development
A three-tier architectural view of the precise classification system of malaria burden on households is presented in Fig. 3. The diagram depicts a systematic process that transforms household data into a validated ensemble model capable of accurately classifying malaria burden.
In this study, a tree-based boosting ensemble algorithm integrated with a majority voting mechanism is proposed for the accurate classification of malaria burden at the household level. This choice is motivated by the robust predictive performance and enhanced interpretability associated with ensemble learning models, particularly boosting algorithms that iteratively reduce bias and improve model accuracy [52]. These algorithms are particularly well-suited for this classification task due to their ability to model complex relationships, handle heterogeneous data, and achieve high accuracy in multi-class problems.
Following the architecture, relevant data collected from the MIS and DHS repositories is extracted, encoded, normalized and visualized to detect patterns usable for the learning model. The resulting data is divided into training and test sets while k-fold cross-validation is applied to improve generalization and avoid overfitting. The train set was fed into multiple tree-based ensemble algorithms and each model is tuned using hyperparameter optimization (Grid search) to find the best settings. The predictions from all trained classifiers are combined using a majority voting scheme to determine the best model with the best output. The test set is fed into the final ensemble classification model to check its real-world predictive ability. This step ensures the model can generalize to unseen household data. The effectiveness of the system is measured using multiple metrics such as precision, recall, F1-score and AUC (Area Under Curve). The precision measures how many predicted malaria burden cases were correct, recall shows how many actual malaria burden cases were identified correctly, F1-score then balances between precision and recall while AUC gives the overall ability of the model to distinguish between highest, high, low and lowest burden households.
The detailed procedure of the proposed algorithm is outlined in Algorithm 1. The incorporation of majority voting ensures that the final classification reflects the consensus among the base learners, thereby increasing prediction stability and generalizability. To implement the learning model, the process is structured into four key phases: data preparation, data splitting, learning, and evaluation. In this study, the dataset is partitioned into training and testing subsets using the k-fold cross-validation technique. This method is chosen due to its effectiveness in dividing the data into equal-sized folds, enabling each subset to serve as both training and testing data across iterations. This approach enhances the reliability and generalizability of the model’s performance, ultimately contributing to improved accuracy.
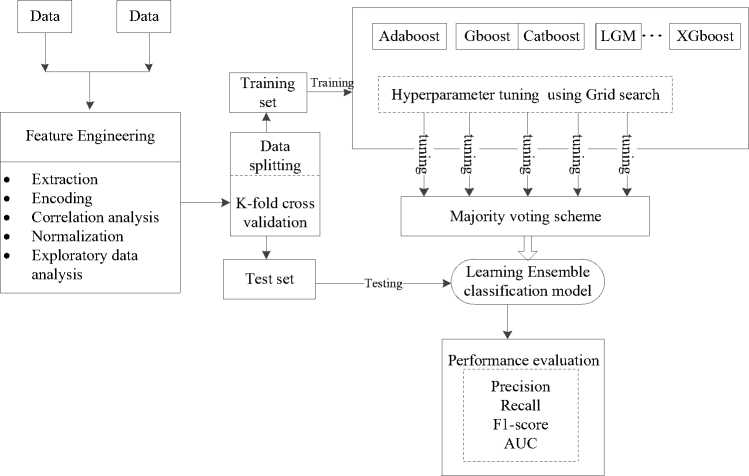
Fig. 3. Architecture of the precise classification system of malaria burden on households
Algorithm 1: Proposed algorithm
-
1. Input: load(malaria_burden.csv);
-
2. return malaria_burden.csv(“socio-economic”, “socio-demographic”,
-
3. Procedure: pre-process(malaria_burden.csv)
-
4. return clean malaria_burden.csv
-
5. Procedure: split_data = k-fold_cross_validation (malaria_burden.csv)
-
6. Training.data, Testing.data = split (malaria_burden.features, labels)
-
7. return training.data, testing.data
-
8. Procedure: tuning = grid_search (hyperparameters)
-
9. Voting=“majority voting”
-
10. outp4 = Ada6oost(training. data, training. label, testing. data)
-
11. outp2 = GB(training. data, training. label, testing. data)
-
12. outp3 = XGBoost(training. data, training. label, testing. data)
-
13. outp4 = Catboost(training. data, training. label, testing. data)
-
14. outp5 = GB (training. data, training. label, testing. data)
-
15. Procedure: ensemble_model (Training.data,training.label, testing.data)
-
16. majority_voting.classifier = concatenate() outp4, outp2, outp3, outp4, outp5
-
17. majority_voting.classifier.fit (Training.data, Training.label)
-
18. Classification= majority_voting.classifier.predict (Testing.data)
-
19. Procedure: evaluate (parameters: precision, recall, F1-score, AUC)
-
4.1. Implementation of Result
In this study, a total of forty-six (46) relevant features related to household malaria burden were successfully extracted and analyzed from the Malaria Indicator Survey (MIS) and Demographic and Health Survey (DHS) repositories for model development. The implementation of the proposed models was carried out using the Python programming language, along with its rich ecosystem of machine learning libraries (such as scikit-learn, XGBoost, LightGBM, and CatBoost). The setup for model development consisted of a system powered by an Intel(R) Core(TM) i5-6300U CPU @ 2.40GHz (up to 2.50GHz), 16.0 GB of RAM, and Windows 11 Pro (64-bit) operating system. The development and testing were conducted within the Jupyter Notebook environment, which offers a user-friendly interface and interactive coding features, making it highly suitable for machine learning experimentation and analysis. These hardware and software configurations provided a robust and efficient platform for implementing the tree-based boosting ensemble learning models proposed in this study.
-
4.2. Analysis of Results
“behavioral”, “women features…”)
The results derived from the analysis of the selected relevant features were saved in a comma-separated values (CSV) format within an Excel worksheet, and subsequently imported into the Python environment for model training and testing. To ensure a more robust and reliable evaluation of model performance, and to make optimal use of the available dataset, a 5-fold cross-validation approach was employed. This method helps to overcome the limitations associated with a single train-test split by systematically partitioning the dataset into five subsets, where each subset serves as the test set once while the remaining subsets are used for training. This process enables a more comprehensive assessment of the model’s generalization capability across different data partitions.
To address the class imbalance observed in the dataset, the Synthetic Minority Over-sampling Technique (SMOTE) was applied specifically to the training set. SMOTE works by generating synthetic examples for the minority classes, thereby balancing the class distribution and improving the model's ability to learn from underrepresented categories. During this process, an empty dictionary structure was initialized to systematically store the resampled training data corresponding to each target class label. This data balancing step significantly contributes to enhancing the performance and fairness of the tree-based ensemble learning models when trained on imbalanced data. A detailed summary of the parameter grids and their respective value ranges used for the tree-based boosting ensemble models is presented in Table 7.
Table 7. Summary of parameter grid for hyper-parameter tuning
|
Parameters |
Best tuning points |
|
Learning rate |
0.01 |
|
Max-depth |
4 |
|
Subsample |
0.8 |
|
Colsample_bytree |
0.8 |
|
n_estimators |
100 |
|
k-fold |
5 |
|
Random sample |
42 |
|
n_estimators |
100 |
|
maximum_tree |
200 |
|
Early stopping |
10 |
After optimizing hyperparameters through a grid search algorithm, the average accuracy result obtained is presented in Table 7 while the majority voting scores derived from this process to determine each model’s predicted class are detailed in Tables 8 and 9, respectively. Nevertheless, Table 8 presents class-wise and average accuracies of the base and ensemble models across the four malaria-burden categories (Y1–Y4). Overall, all tree-based models achieved strong performance, with accuracies exceeding 83% across most classes, confirming their suitability for household-level malaria burden classification. Higher accuracies were consistently observed for Y1 and Y4, indicating that households at low and high burden extremes exhibit more distinguishable patterns. In contrast, Y2 and Y3 recorded relatively lower accuracies, likely due to overlapping household characteristics within intermediate burden levels. Among the base models, XGBoost achieved the highest average accuracy across all targets and demonstrated stable performance across all classes, particularly for Y1 and Y4, followed closely by LightGBM.
Although the results in Table 9 indicate that XGBoost is the strongest single learner, the ensemble approach offers greater robustness and balanced performance, reinforcing its suitability for precise household-level malaria-burden classification and targeted intervention planning.
Table 8. Average accuracy result of the trained base models derived from the heat map
|
Algorithm |
Y1 |
Y2 |
Y3 |
Y4 |
|
Gradient Boosting |
0.95 |
0.86 |
0.85 |
0.93 |
|
CatBoosting |
0.91 |
0.78 |
0.66 |
0.90 |
|
XGB |
0.96 |
0.87 |
0.86 |
0.94 |
|
LightGBM |
0.95 |
0.87 |
0.86 |
0.94 |
|
AdaBoost |
0.95 |
0.85 |
0.84 |
0.93 |
Where Y1 = lowest burden, Y2 = low burden, Y3 = high burden, Y4 = highest burden
Table 9. Majority voting using hard voting for all target classes
|
Models/Target |
Y1 |
Y2 |
Y3 |
Y4 |
|
CatBoost |
0 |
0 |
1 |
0 |
|
AdaBoost |
0 |
0 |
0 |
0 |
|
LightGBM |
0 |
0 |
1 |
0 |
|
XGBoost |
0 |
0 |
1 |
0 |
|
Gradient Boosting |
0 |
0 |
1 |
0 |
|
Vote count |
0 |
0 |
4 |
0 |
|
Ensemble |
0 |
0 |
1 |
0 |
Summary: Individual Model Accuracies
|
Target Y1 |
Target Y2 |
Target Y3 |
Target Y4 |
0.95 |
|||
|
GradientBoosting |
0.95 |
0.86 |
0.85 |
0.93 |
.0 00 |
||
|
0 85 |
|||||||
|
F |
Cat Boosting |
0.91 |
0.78 |
0.66 |
0.90 |
0 80 |
|
|
о a |
XGB |
0.96 |
0.87 |
0.86 |
0.94 |
075 |
|
|
LightGBM |
0.95 |
0.87 |
0.86 |
0.94 |
070 |
||
|
Ada Boost |
0.95 |
0,85 |
084 |
0.93 |
I0-65 |
||
|
Votes for T |
0 |
0 |
4 |
0 |
0.70 |
||
|
Ensemble Prediction |
■ 0 ■ |
( 0 1 |
1 1 1 |
0.60 |
|||
Ensemble: [О, O, 1, O]
Fig. 4. Ensemble learning result summary
In Fig. 4, the performance of the individual tree-based models and the resulting ensemble prediction across four malaria burden targets (Y1–Y4) is presented. Overall, the base learners demonstrated strong predictive performance, with accuracies generally exceeding 0.85 across most targets. XGBoost and LightGBM showed the most consistent performance, achieving accuracies of up to 0.96, while CatBoost exhibited comparatively lower accuracy for Target Y2 (0.78) and Target Y3 (0.66). Despite this variability, the hard majority voting ensemble effectively aggregated the strengths of the individual models. The voting results indicated unanimous predictions for class 0 in Targets Y1, Y2, and Y4, whereas Target Y3 received four out of five votes for class 1. Consequently, the ensemble classified the household malaria burden as [0, 0, 1, 0], identifying Target Y3 as the only dimension associated with elevated malaria burden. The result is attributable to key features within the dataset. However, the overall Accuracy (Exact Match) for all targets is 76.85%, while the overall accuracy (Exact-match for the Ensemble approach) is 77.83%. This outcome highlights the robustness of the ensemble approach, as it mitigates the influence of weaker individual models while reinforcing consistent patterns captured by high-performing learners, thereby enabling more reliable and targeted malaria burden classification.
Furthermore, the ensemble feature-importance results indicate that malaria burden classification is driven predominantly by a small subset of household-level indicators. Feature H20 emerged as the most influential predictor, contributing approximately 26.8% of the overall decision weight of the model, followed closely by H25 (24.5%) and H26 (21.2%). Together, these three features account for more than 70% of the ensemble’s predictive influence, demonstrating that malaria burden severity is largely determined by a few critical risk factors rather than a broad combination of variables.
In Table 10 and Fig. 5, the comparative evaluation of the base learners shows complementary performance characteristics across the algorithms. XGBoost achieved the highest precision and AUC, indicating superior discriminative ability and a strong capacity to minimize false positives. Gradient Boosting demonstrated a balanced trade-off between precision and recall, resulting in a competitive F1-score and robust classification stability. CatBoost and AdaBoost recorded the highest recall values, highlighting their effectiveness in identifying malaria-burdened households, albeit with reduced precision. LightGBM exhibited moderate performance across all metrics with comparatively lower AUC. Overall, the diversity in algorithmic strengths supports their integration into an ensemble framework, where hard majority voting leverages high discrimination, balanced performance, and sensitivity to enhance malaria burden classification.
Table 10. Result of performance parameter based on the base models
|
Algorithms |
Precision |
Recall |
F1-score |
AUC |
|
XGBoost |
0.9473 |
0.8396 |
0.7903 |
0.9501 |
|
Gradient Boosting |
0.7431 |
0.8357 |
0.7861 |
0.9461 |
|
CatBoost |
0.6725 |
0.8816 |
0.7596 |
0.9412 |
|
AdaBoost |
0.6812 |
0.8532 |
0.7549 |
0.9377 |
|
LightGBM |
0.7295 |
0.8169 |
0.7699 |
0.8875 |
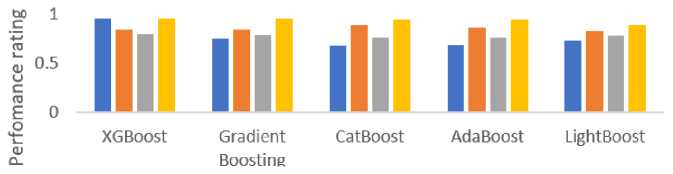
Fig. 5. Result of performance parameter based on the base models
Finally, the evaluation result in Table 11 still proves an impressive performance of the ensemble method. The computed ensemble accuracy for class Y3 is 80%, which indicates a high level of correctness in predicting the low-burden category. However, methods such as stacking and bagging, along with improved parameter tuning and feature engineering, could be further applied to provide deeper insights into malaria-related challenges, support more effective decision-making and policy development.
Table 11. Evaluation result for ensemble learning
|
Precision |
Recall |
F1-score |
|
|
0 |
0.81 |
0.62 |
0.70 |
|
1 |
0.75 |
0.87 |
0.81 |
|
2 |
0.84 |
0.69 |
0.76 |
|
3 |
0.84 |
0.93 |
0.88 |
|
micro avg |
0.8 |
0.8 |
0.8 |
|
macro avg |
0.81 |
0.78 |
0.79 |
|
weighted avg |
0.81 |
0.8 |
0.8 |
|
sample avg |
0.79 |
0.8 |
0.79 |
5. Conclusion
This study developed and evaluated a tree-based ensemble model for the accurate classification of malaria burden among households in Nigeria using data from the 2015 and 2021 Malaria Indicator Surveys (MIS) and the 2018 Demographic and Health Survey (DHS) covering all six geopolitical zones of the selected households in urban and rural Nigeria. The model integrated multiple tree-based classifiers through a majority voting ensemble technique and employed k-fold cross-validation and grid search for performance optimization. The results demonstrated that the proposed model achieved high predictive performance, confirming its effectiveness and robustness in classifying household malaria burden across diverse geographical and demographic settings.
The findings demonstrate the potential of ensemble machine learning techniques to strengthen malaria surveillance by accurately identifying households at high risk of malaria. The proposed model provides a practical decision-support tool that can assist healthcare professionals, policymakers, and government agencies in implementing targeted interventions, optimizing resource allocation, improving malaria control programmes, and supporting evidence-based policy formulation. Consequently, the model has significant potential to contribute to malaria elimination efforts in Nigeria and advance the achievement of Sustainable Development Goal (SDG) 3 on ensuring healthy lives and promoting well-being.
Future research should enhance the model by incorporating additional predictors, including environmental, climatic, geospatial, and socio-economic factors that influence malaria transmission [60]. Comparative studies involving deep learning and hybrid ensemble approaches are also recommended to further improve predictive performance. Additionally, integrating explainable artificial intelligence (XAI) techniques such as SHAP and LIME would improve model interpretability and user confidence. Finally, validating the model with more recent datasets and deploying it as a web-based or mobile decision-support system would facilitate real-time malaria surveillance and informed public health decision-making.
All the Declarations and StatementsAuthor Contributions Statement
Idara James: Conceptualization, Data Curation, Methodology, Model Training, Validation, Visualization, Performance Evaluation, and Writing: Proposed the research concept, designed the overall framework, managed data collection, conducted dataset preprocessing, built and implemented the research model, carried out model training and validation of results, compared performance with existing models, and prepared the initial manuscript draft.
Veronica Osubor: Supervision – Review and Editing: Supervised project implementation, critically reviewed and refined the manuscript, and ensured overall clarity and logical flow.
Udo Ifiok: Writing – Review and Editing: critically reviewed and refined the manuscript, and ensured overall clarity.
All authors have read and agreed to the published version of the manuscript.
Conflict of Interest Statement
The authors state that there were no conflicts of interest.
Funding Declaration
None
Data Availability Statement
This study analyzed publicly available datasets. The datasets can be found here:
MIS dataset:
DHS dataset:
Ethical Declarations
None
Acknowledgments
None
Declaration of Generative AI in Scholarly Writing
None
Abbreviations
The following abbreviations are used in this manuscript:
AUC - Area Under Curve
SSADM - Structured System Analysis Design Methodology
MIS - Malaria Indicator Survey
DHS - Demographic and Health Survey
CPU - Central Processing Unit
RAM - Random Access Memory
XGBoost - Extreme Gradient boost
CSV - Comma Separated Variable
SMOTE - Synthetic Minority Over-sampling Technique
LightGBM - Light Gradient Boosting Machine
CatBoost - Categorical Boost
SDG - Sustainable Development Goals
Appendix
None.