Using machine learning algorithms to predict first-generation college students’ six-year graduation: a case study

Author: Zhixin Kang
Journal: International Journal of Information Technology and Computer Science @ijitcs
Article in issue: 9 Vol. 11, 2019.
Free access
This paper studies the forecasting mechanism of the most widely used machine learning algorithms, namely linear discriminant analysis, logistic regression, k-nearest neighbors, random forests, artificial neural network, naive Bayes, classification and regression trees, support vector machines, adaptive boosting, and stacking ensemble model, in forecasting first-generation college students’ six-year graduation using the first college year’s data. Five standard evaluating metrics are used to evaluate these models. The results show that these machine learning models can significantly predict first-generation college students’ six-year graduation with mean forecasting accuracy rate spanning from 69.58% to 75.17% and median forecasting accuracy rate spanning from 70.37% to 74.52%. Among these machine learning algorithms, stacking ensemble model, logistic regression model, and linear discriminant analysis are the best three ones in terms of mean forecasting accuracy rate. Furthermore, the results from the repeated ten-fold cross-validation process reveal that the variations of the five evaluating metrics exhibit remarkably different patterns across the ten machine learning algorithms.
Machine learning algorithms, first-generation college students, six-year graduation, forecasting evaluation
Short address: https://sciup.org/15016382
IDR: 15016382 | DOI: 10.5815/ijitcs.2019.09.01
Text of the scientific article Using machine learning algorithms to predict first-generation college students’ six-year graduation: a case study
Published Online September 2019 in MECS DOI: 10.5815/ijitcs.2019.09.01
In recent decades, predictive machine learning models have been widely used in modeling and forecasting college students’ academic performance in higher education. It is shown by research that the predictive models such as logistic regression model, linear discriminant analysis, naive Bayes, artificial neural network, k-nearest neighbors, and stacking ensemble models can predict college students’ academic performance. See, for example, [1, 2, 3, 4, 5, 6, 7], among many others. It is well known that using college students’ first college year data can predict their first-year retention. However, there are relatively fewer reports on whether college students’ first college year data could be used to predict their six-year graduation. This case study aims to add more empirical insights into this research topic.
Another focus of this case study is on predicting first-generation students’ six-year graduation. Our reasoning is that these students are shown by research to face greater challenges in their first year study [8, 9] and in the entire path toward graduation in college [10, 11]. We are motivated to study this specific cohort of college students so as to provide some findings that can be used by educators, administrators, and policy makers in higher education to better help these students.
First-generation college students are defined as those whose parents or guardians did not obtain a college degree. According to National Center for Education Statistics (NCES) in the United States, the first-generation college students made up 34% of the total student population in the 2011 - 12 academic year. Research shows that first-generation students’ grade point averages (GPA) are lower than those of their non-first-generation peers [12]. First-generation students more likely come from families with very limited resources [9, 12, 13, 14, 15, 16]. Furthermore, this cohort of students tends to have lower confidence in their academic ability [17, 18] and has less academic preparedness compared to traditional non-first-generation college students [8]. Researchers find that many of the first-generation college students are minorities [9, 12, 13, 14, 15, 16].
The research question in this case study is whether and how well the widely used machine learning models can predict first-generation college students’ six-year graduation using their first college year data. The data were collected from one of the most ethnically diverse four-year universities in the United States, and the campus has remarkably high percentage of first-generation students. We employ the ten most widely used machine learning algorithms, namely linear discriminant analysis (LDA), logistic regression (LR), k-nearest neighbors (kNN), random forests (RF), artificial neural network (NN), naive Bayes (NB), classification and regression trees (CART), support vector machines (SVM), adaptive boosting (AB), and stacking ensemble (SE) model, to compare and evaluate their forecasting performance.
The remainder of this paper is organized as follows. The next section is an overview of the related works. Section 3 outlines the research methodology. Section 4 describes the data and presents the major summary statistics. In Section 5, we report the empirical results and analysis. Section 6 concludes.
-
II. Related Works
Many researchers have studied college students’ academic performance, first-year retention, and graduation using machine learning techniques. The authors [7] employ naive Bayes, artificial neural network, and decision tree to predict student performance at a course level and show that these models can achieve quite high forecasting accuracy. The authors in [1] conduct a case study using five major classification algorithms, i.e. decision trees, rule induction, artificial neural networks, k-nearest neighbors, and naive Bayes, to predict degree completion. They find that students’ information of pre-university and of first- and second-year academic course performance can be used to predict their degree completion. The author in [8] studies first-generation college students’ academic preparedness using a multivariate logistic model. In the study, students’ high school GPA, SAT score, and self-rated overall academic, writing, and mathematical abilities as the measures of college preparedness. He shows that this widely used machine learning model can capture the impact of students’ first-generation status on their college preparedness. The authors in [3] reveal the competing explanations on college students’ failure in fulfilling six-year degree completion using Beginning Postsecondary Students Longitudinal Study (BPS). They use sheaf coefficient, which is based on nested regression models, to capture the mediation of temporal effects on a sequence of academic activities in college students’ degree path. They find that many factors play independent roles in degree fulfillment and no single factor can dominantly contribute to a better chance of degree completion. The authors in [4] compare the performance of logistic regression, decision trees, artificial neural networks, and ensemble models in forecasting college students’ first-year retention. They find that these machine learning models can identify the significant predicting factors for first-year retention and gain at least 70% accuracy rate in correctly forecasting first-year retention. The authors in [5] employ a logistic regression model to study student graduation rate in a Midwest’s highly selective public flagship research university in the U.S. Their research focuses on using first semester’s GPA to predict the graduation rate for a cohort of ethnically underrepresented students. They find the evidence that first semester’s GPA is a significant early predictor of six-year graduation. The author in [6] compares the forecasting performance among the logistic regression, decision trees, and artificial neural network logarithms in forecasting the freshmen retention and degree completion time at a doctoral research university. He finds that the artificial neural network and decision trees logarithms perform better than the logistic regression model does in forecasting degree completion time when a large number of independent variables are included in these models. The authors in [19] provide a comprehensive review of the educational data mining techniques for predicting college students’ performance. They conclude that the meta-analysis method needs more research on predicting students’ performance. To this end, we are motivated to include in this case study the stacking ensemble model, which is one of the metaanalysis methods.
Even though the aforementioned machine learning models have yielded insightful results on college students’ first-year retention and academic performance, there are relatively fewer reports on predicting first-generation college students’ six-year graduation based on students’ first college year data. To add more insights into the research on degree attainment in higher education, in this case study we include the ten aforementioned machine learning models to forecast first-generation college students’ six-year graduation. Furthermore, we compare and evaluate their performance using five standard evaluating metrics.
-
III. Methodology
In this case study, both single independent and stacking ensemble machine learning models are included. Among these models, LDA, LR, kNN, SVM, CART, NN, and NB are single machine learning algorithms. RF is a bagging ensemble model. AdaBoost is a boosting ensemble model. Both bagging and boosting only use a single model. In this sense, we treat LDA, LR, kNN, SVM, CART, NN, NB, RF, and AdaBoost as single independent models. A stacking ensemble model, on the other hand, makes use of several different base models and combines the predictions from these base models to generate a final prediction.
LR captures the relationship of a categorical dependent/target variable to a set of predictor variables. Logistic regression model is arguably the most popular supervised machine learning model in dealing with a categorical dependent variable. NN is a non-linear algorithm that mimics the function of a biological neural network in human beings’ brains. In a NN setup, information nodes or so-called artificial neurons are connected among different layers. The information in the first layer, which contains raw inputs, is processed and passed to the next layer that is called hidden layer. Different weights are used to connect the different nodes and layers in NN, and the learning process is to seek the optimal weights so that it can make the best predictions for a target variable. RF is a bagging ensemble model that can perform either classification or regression in a data learning process. Given a dataset that includes a target variable and a set of predictor variables, a RF learning process seeks a certain number of deep decision trees, each of which trains a bagged sub-dataset with a random selection of related variables and makes a contribution to the final prediction of the target variable based on a decision function. RF is a typical parallel ensemble method in the sense that it combines the base predictions generated in parallel decision trees. SVM is a supervised machine learning algorithm. In SVM, a kernel function is defined to quantify the similarities among the observations in a dataset. The most commonly used kernel is a linear kernel, even though a non-linear kernel such as polynomial and radial basis can find a non-linear hyperplane. kNN technique has been used as a nonparametric machine learning algorithm for long time for either classification or regression. It is the simplest machine learning algorithm. kNN uses a distance measure to sort out the most similar observations into the same class/group in a dataset. CART, which is also called decision trees, is another simple machine learning logarithm that has been used for decades. It trains a dataset to construct a decision tree and predict the target variable using a set of predictor variables. Note that there is distinctive difference between RF and CART. The former could consist of multiple decision trees but the latter is a standalone and single tree-based model. AdaBoost linearly combines basic features or weak learners together to generate a strong and single learner in data learning process. The combination can be based on all the weak learners or on choosing a certain number of the predictions with high accuracies in the learning process. The process of finding the final strong learner uses an iterative procedure that seeks the optimal weights associated with each weak learner. In this sense, AdaBoost is a typical sequential ensemble method. A stacking ensemble model employs several independent predictive machine learning models to obtain the best predictions for a target variable. In the first step of learning, a list of individual independent models are specified, trained, and predictions are made using these so-called base models. In the second step, a metalearning algorithm is run to make predictions on the basis of the step-one predictions. In this case study, we consider LDA, LR, NN, SVM, CART, KNN, and NB as the independent base models for the stacking ensemble model.
Following the literature [20, 21], we use five major metrics, namely ROC (Receiver Operating Characteristic), sensitivity, specificity, Cohen’s Kappa coefficient [20, 21], and accuracy rate to evaluate these models. ROC measures the probability of correctly rejecting a target variable’s false positive outcome in a forecasting process. The higher a ROC value is, the better a predictive model is in its predicting performance. Sensitivity measures the probability of correctly predicting a target variable’s positive outcome (In this study, “Y” for six-year graduation). The higher a sensitivity value is, the better a predictive model is in forecasting performance. Specificity, on the other hand, is the probability of incorrectly predict a target variable’s negative outcome (In this study, “N” for six-year graduation). The lower a specificity value is, the better a predictive model is in forecasting performance. Cohen's Kappa measures the agreement between a machine learning model-based forecasts and randomly guessed forecasts based on the frequency of each category. The higher a Kappa value is, the better a model is in making forecasts. Accuracy rate is the ratio of the number of correct forecasts to the total number of forecasts in a forecasting process. The higher this value is, the better a model is in making forecasts.
For each independent algorithm, we apply a three repeated ten-fold cross-validation in the forecasting process. The resultant minimum, 25% quartile, median, mean, 75% quartile, and maximum for each of the five evaluating metrics are presented. We further visualize and analyze the distributional characteristics of these major statistics.
-
IV. Data
The data were collected from one of the most ethnically diverse four-year universities in the United States. Table 1 presents the list of the variables included in this study.
Table 1. List of the Variables in the Data
|
Dependent Variable |
Six-year Graduation (Y/N) |
|
Independent Variable |
|
|
Demographic |
Age (Grouped) Gender (F/M) Race/Ethnicity (Grouped) Residency (In-state, Out-of-state) Housing (Y/N) County Tier (Tier 1, 2, 3, Out-of-state) Underrepresented Minority (Y/N) Admission Type (Grouped) |
|
First-year Academic Performance |
High School GPA SAT Reading Score SAT Math Score SAT Combined Fall Term GPA (Grouped) Difference in Fall Term Credit Hours Fall Major Decision (Y/N) Spring Term GPA (Grouped) Difference in Spring Term Credit Hours Spring Major Decision (Y/N) |
|
Financial |
FAFSA Application (Y/N) Scholarship & Grant (Y/N) Low Income Family (Y/N) |
Its campus has nearly 60% minority students in a typical academic year. Those freshman students who were enrolled into this university in the fall semesters of 2008, 2009, and 2010 are included in the data. There are totally 3,348 observations. Among them, 1,431 students are identified as the first-generation students. This is about 42.74% of the total freshman population. These students’ first college year data include demographic attributes, first-year academic performance, and financial status.
Table 2. Summary Statistics of the Demographic Variables
|
Gender |
|
|
Male |
675 (47.17%) |
|
Female |
756 (52.83%) |
|
Ethnicity |
|
|
White |
601 (42.00%) |
|
Black or African American |
464 (32.42%) |
|
American Indian or Alaska |
|
|
Native |
196 (13.70%) |
|
Unknown |
71 (4.96%) |
|
Hispanic |
60 (4.19%) |
|
Asian or Pacific Islander |
20 (1.40%) |
|
Two or More Races |
19 (1.33%) |
|
Residency |
|
|
In-state |
1,368(95.60%) |
|
Out-of-state |
63 (4.40%) |
|
Housing |
|
|
Yes |
1,027 (71.77%) |
|
No |
404 (28.23%) |
|
Underrepresented Minority |
|
|
Yes |
739 (51.64%) |
|
No |
692 (48.36%) |
|
Admission Type |
|
|
Undergraduate Full Admission |
1,288 (90.00%) |
|
College Opportunity |
107 (7.48%) |
|
Bridges Program |
36 (2.52%) |
|
County Tier |
|
|
Tier 1 |
715 (49.97%) |
|
Tier 2 |
219 (15.30%) |
|
Tier 3 |
434 (30.33%) |
|
Out-of-state |
63 (4.40%) |
Prior to running the aforementioned ten machine learning algorithms to forecast six-year graduation, a significant data cleansing process is applied to the data. The target variable is six-year graduation, and the predictor variables are in three categories, namely demographics, academic performance, and financial status. The dataset includes both numeric and categorical variables. Table 2 reports the summary statistics of the demographic variables. As is shown, 58% of the first-generation freshman students are nonwhite students, and 51.64% of the students are underrepresented minorities. 95.60% of them are in-state students. 71.77% of them live on the campus in their first college year. 90% of these students were enrolled with a full admission status.
V. Results
0.70 0.75 0.80 0.85 0.90 0.65 0.75 0.850.65 0.70 0.75 0.80 0.3 0.4 0.5 0.674.52%, among the nine competing independent machine learning models. It is followed closely by LDA, SVM, NN, and RF. AdaBoost and KNN turn out to be the worst forecasting models measured by mean accuracy rate. The Kappa values suggest that LDA and LR are the top two models, followed by SVM, NN, CART, NB, RF, and KNN. AdaBoost gains the lowest Kappa value. Figure 2 provides the boxplots of the accuracy rates and Kapps values. It shows that LDA model yields the highest mean Kappa value while AdaBoost turns out to have the lowest mean Kappa value. AdaBoost also suffers the highest variation in this measure. NB, KNN, RF, LDA, and LR exhibit relatively low variations in both accuracy rate and Kappa measures. LR gains slightly higher accuracy rate than LDA does, and LR’s variation in accuracy rate is also slightly smaller than that of LDA.
Using the first-generation college students’ first college year data, as described in Section IV, we at first evaluate the ROC, sensitivity, and specificity for the nine single independent machine models, namely LDA, LR, RF, CART, AdaBoost, KNN, SVM, NN, and NB. Table 3 reports the results. In Table 3, the means of the ROC and sensitivity are in a descending order and the mean of specificity is in an ascending order. Fig. 1 presents the boxplots of these model-evaluating statistics. It shows that LDA gains the highest mean ROC, while CART turns out to have the lowest mean ROC. In terms of specificity, NB has the lowest mean value while CART has the highest mean value. Regarding sensitivity, NB is the best performer while CART is the worst performer measured by the mean value. Using the mean ROC as a measure, the top four model performers are LDA, LR, RF, and NN, followed by SVM and NB. The top two performers measured by the mean sensitivity are NB and RF, followed by LR, SVM, KNN, and NN. The best performer measured by the mean specificity is NB, followed by AdaBoost and RF. And the worst performer measured by mean specificity is CART. The boxplots in Fig. 1 reveals that CART turns out to have the smallest variation in ROC, sensitivity, and specificity, even though its mean ROC and sensitivity are the lowest and mean specificity is the highest. NB and SVM have the highest variations in ROC, KNN and NN exhibit the highest variations in sensitivity.
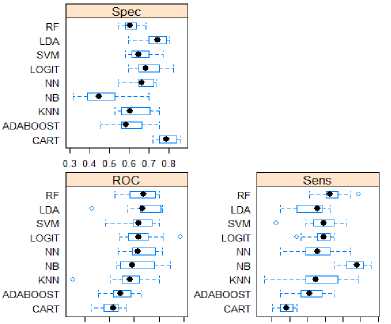
Fig.1. The Boxplots of ROC, Sensitivity, and Specificity
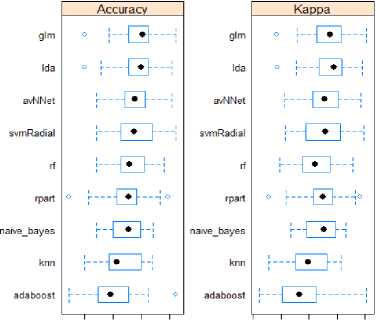
Fig.2. Boxplots of Accuracy Rates and Kappa Values
To investigate the forecasting performance measured by accuracy rate and Cohen’s Kappa coefficient [22], we apply the three repeated ten-fold cross-validation training and forecasting procedure to the nine independent predictive models. The results are presented in Table 4 with mean accuracy rates and mean Kappa values being in a descending order, respectively. Table 4 shows that LR model gains the highest mean accuracy rate, which is
To determine which models among LDA, LR, NN, SVM, CART, KNN, and NB can be included in the stacking ensemble model, we analyze the correlations among the predictions made from these models in a tenfold cross-validation process. Table 5 presents the results.
Table 3. ROC, Sensitivity, and Specificity of the Nine Independent Predictive Models
|
Min. |
1st Qu. |
Median |
Mean |
3rd Qu. |
Max. |
|
|
ROC |
||||||
|
LDA |
0.7146 |
0.8126 |
0.8166 |
0.8157 |
0.8483 |
0.8560 |
|
LR |
0.7705 |
0.7893 |
0.8095 |
0.8153 |
0.8269 |
0.8925 |
|
RF |
0.7604 |
0.7951 |
0.8186 |
0.8139 |
0.8386 |
0.8501 |
|
NN |
0.7668 |
0.7969 |
0.8076 |
0.8128 |
0.8357 |
0.8572 |
|
SVM |
0.7419 |
0.7983 |
0.8095 |
0.8116 |
0.8342 |
0.8504 |
|
NB |
0.7640 |
0.7761 |
0.7969 |
0.8075 |
0.8315 |
0.8731 |
|
KNN |
0.6769 |
0.7782 |
0.7921 |
0.7871 |
0.8095 |
0.8502 |
|
ADABOOST |
0.7283 |
0.7579 |
0.7716 |
0.7730 |
0.7910 |
0.8135 |
|
CART |
0.7128 |
0.7428 |
0.7582 |
0.7543 |
0.7674 |
0.7834 |
|
Sensitivity |
||||||
|
NB |
0.8256 |
0.8663 |
0.8895 |
0.8837 |
0.9041 |
0.9302 |
|
RF |
0.7558 |
0.8052 |
0.8140 |
0.8233 |
0.8372 |
0.8953 |
|
LR |
0.7209 |
0.7791 |
0.7965 |
0.7884 |
0.8140 |
0.8256 |
|
SVM |
0.6628 |
0.7703 |
0.7965 |
0.7860 |
0.8198 |
0.8605 |
|
KNN |
0.6279 |
0.7500 |
0.7733 |
0.7814 |
0.8285 |
0.8953 |
|
NN |
0.6744 |
0.7471 |
0.7791 |
0.7744 |
0.8081 |
0.8721 |
|
LDA |
0.6744 |
0.7297 |
0.7791 |
0.7628 |
0.7907 |
0.8140 |
|
ADABOOST |
0.6744 |
0.7326 |
0.7558 |
0.7570 |
0.7907 |
0.8256 |
|
CART |
0.6512 |
0.6744 |
0.6919 |
0.6884 |
0.7093 |
0.7209 |
|
Specificity |
||||||
|
NB |
0.3158 |
0.3929 |
0.4474 |
0.4730 |
0.5219 |
0.7018 |
|
ADABOOST |
0.4561 |
0.5658 |
0.5826 |
0.6042 |
0.6491 |
0.7544 |
|
RF |
0.5439 |
0.5833 |
0.6053 |
0.6059 |
0.6320 |
0.6842 |
|
KNN |
0.5263 |
0.5658 |
0.6053 |
0.6321 |
0.7056 |
0.7544 |
|
SVM |
0.5789 |
0.6184 |
0.6491 |
0.6584 |
0.6974 |
0.7719 |
|
NN |
0.5439 |
0.6535 |
0.6667 |
0.6707 |
0.7098 |
0.7368 |
|
LR |
0.5965 |
0.6506 |
0.6842 |
0.6936 |
0.7500 |
0.8246 |
|
LDA |
0.5965 |
0.7018 |
0.7456 |
0.7304 |
0.7851 |
0.8070 |
|
CART |
0.7193 |
0.7588 |
0.7895 |
0.7951 |
0.8342 |
0.8596 |
Using 0.75 as a benchmark value of a significant correlation between two models’ predictions, Table 5 shows that LR has high correlations with LDA, SVM, NN, and CART; LDA has high correlations with LR, SVM, and NN; SVM has high correlations with LR, LDA, and NN; NN has high correlation with LR, LDA, SVM, and CART. Therefore, in the stacking ensemble model, we consider the following six sets of the models: (LR, NB, KNN, NN), (LDA, KNN, CART), (KNN, SVM, NB), (LDA, KNN, NB), (NN, KNN, NB), and (NB, LR, NN). We report in Table 6 the forecasting evaluation results obtained from the stacking ensemble model with the six sets of base models. As expected, the mean accuracy rate obtained from using a stacking ensemble model is higher than that from using each of the member base models. In addition, Table 6 shows that the stacking ensemble model based on the base models of (LR, NB, KNN, NN) generated the highest mean accuracy rate and mean Kappa value, followed by the base models of (NB, LR, NN). Most of the mean accuracy rates and the mean Kappa values in Table 6 are larger than those reported in Table 4. This clearly shows that there is indeed some improvement in making forecasts when using a stacking ensemble model. Among these stacking ensemble models based on the six different sets of base models, if either LR or LDA model is included, then the resultant mean accuracy rate and mean Kappa value are higher than those obtained from the models in which none of the two base models is included. This is expected because Table 4 shows that LR and
LDA are the top performers measured by the mean accuracy rate and mean Kappa value. This suggests that the forecasting performance of a stacking ensemble model is directly dependent on that of the independent base models included in the stacking ensemble model.
Table 4. Accuracy Rate and Cohen’s Kappa Coefficients from the Nine Independent Predictive Models
|
Min. |
1st Qu. |
Median |
Mean |
3rd Qu. |
Max. |
|
|
Accuracy Rate |
||||||
|
LR |
0.6503 |
0.7290 |
0.7517 |
0.7452 |
0.7622 |
0.8112 |
|
LDA |
0.6503 |
0.7273 |
0.7491 |
0.7435 |
0.7622 |
0.8042 |
|
SVM |
0.6713 |
0.7133 |
0.7378 |
0.7398 |
0.7675 |
0.8112 |
|
NN |
0.6713 |
0.7203 |
0.7387 |
0.7389 |
0.7565 |
0.8042 |
|
RF |
0.6713 |
0.7133 |
0.7282 |
0.7344 |
0.7539 |
0.7902 |
|
NB |
0.6713 |
0.6993 |
0.7273 |
0.7254 |
0.7483 |
0.7708 |
|
CART |
0.6224 |
0.7080 |
0.7273 |
0.7237 |
0.7400 |
0.7972 |
|
KNN |
0.6503 |
0.6923 |
0.7063 |
0.7151 |
0.7496 |
0.7692 |
|
ADABOOST 0.6224 |
0.6748 |
0.6958 |
0.7037 |
0.7260 |
0.8112 |
|
|
Kappa |
||||||
|
LDA |
0.2876 |
0.4371 |
0.4905 |
0.4722 |
0.5169 |
0.5916 |
|
LR |
0.2834 |
0.4308 |
0.4768 |
0.4703 |
0.5148 |
0.6050 |
|
SVM |
0.3165 |
0.3903 |
0.4587 |
0.4544 |
0.5130 |
0.5954 |
|
NN |
0.3124 |
0.4165 |
0.4552 |
0.4539 |
0.4997 |
0.5867 |
|
CART |
0.2564 |
0.4209 |
0.4498 |
0.4475 |
0.4816 |
0.5832 |
|
NB |
0.3361 |
0.3923 |
0.4522 |
0.4437 |
0.4951 |
0.5328 |
|
RF |
0.2957 |
0.3804 |
0.4222 |
0.4312 |
0.4746 |
0.5572 |
|
KNN |
0.2575 |
0.3534 |
0.3981 |
0.4016 |
0.4646 |
0.5155 |
|
ADABOOST 0.2216 |
0.3064 |
0.3649 |
0.3693 |
0.4254 |
0.6050 |
|
|
Table 5. Correlation Matrix of the Predictions from LDA, LR, NN, SVM, CART, KNN, and NB |
||||||
|
LR LDA |
KNN |
SVM |
NN |
NB CART |
||
|
LR |
1.00 0.88 |
0.61 |
0.81 |
0.89 |
0.66 |
0.79 |
|
LDA |
0.88 1.00 |
0.63 |
0.77 |
0.84 |
0.66 |
0.70 |
|
KNN |
0.61 0.63 |
1.00 |
0.62 |
0.54 |
0.45 |
0.54 |
|
SVM |
0.81 0.77 |
0.62 |
1.00 |
0.83 |
0.56 |
0.64 |
|
NN |
0.89 0.84 |
0.54 |
0.83 |
1.00 |
0.64 |
0.75 |
|
NB |
0.66 0.66 |
0.45 |
0.56 |
0.64 |
1.00 |
0.75 |
|
CART |
0.79 0.70 |
0.54 |
0.64 |
0.75 |
0.75 |
1.00 |
|
Table 6. Accuracy Rate and Kappa Value from the Stacking Ensemble Model |
||||||
|
Set of Models for Stacking Ensemble |
Accuracy Rate |
Kappa Value |
||||
|
(LR, NB, KNN, NN) |
0.7482 |
0.4718 |
||||
|
(NB, LR, NN) |
0.7451 |
0.4657 |
||||
|
(LDA, KNN, CART) |
0.7426 |
0.4638 |
||||
|
(LDA, KNN, NB) |
0.7416 |
0.4596 |
||||
|
(NN, KNN, NB) |
0.7376 |
0.4518 |
||||
|
(KNN, SVM, NB) |
0.7372 |
0.4475 |
||||
-
VI. Conclusions
This research conducts a comparative case study on the performance of ten most widely used machine learning algorithms in forecasting first-generation college students’ six-year graduation.
The results show that these machine learning models can predict first-generation college students’ six-year graduation using college students’ first college year data. The mean forecasting accuracy rate of these models spans from 69.58% to 75.17% and the median forecasting accuracy rate is from 70.37% to 74.52%.
Among the nine independent machine learning models, the best performer measured by mean accuracy rate is logistic regression model, closely followed by linear discriminant analysis. The best forecasting model measured by mean Receiver Operating Characteristic is linear discriminant analysis, followed by logistic regression model. The best model measured by mean sensitivity is naive Bayes, followed by the random forests. The best performer measured by mean specificity is also naive Bayes, followed by the adaptive boosting algorithm. The best forecasting performer measured by Kappa is linear discriminant analysis, followed by logistic regression model.
The stacking ensemble model, which is based on a set of independent base models, is shown to outperform any one of the independent base algorithms in terms of mean accuracy rate. The results show that the stacking ensemble model can achieve a mean accuracy rate of 74.82% when logistic regression model serves as one of the base models. If a linear discriminant model is included in a set of base models for the stacking ensemble model, then the best mean accuracy rate is 74.26%. However, if none of the logistic regression and linear discriminant model is included in a set of base models, then the resultant mean accuracy rate from a stacking ensemble model turns out to be lower than that of a top independent model such as logistic regression model or linear discriminant model. This suggests that in order to improve forecasting performance using a stacking ensemble model, the best independent forecasting model (s) must be included in a set of base models.
The contribution of this study is two folds. To researchers, this study may provide more insights into the forecasting mechanism of the most widely used machine learning algorithms in educational data mining. To administrators, educators, and policy makers in higher education, the finding that college students’ first-year data can predict their six-year graduation may help them make more efficient and effective efforts in serving this special cohort of first-generation students in their early degree path.
References Using machine learning algorithms to predict first-generation college students’ six-year graduation: a case study
- R. Asif, A. Merceron and M. K. Pathan, "Predicting Student Academic Performance at Degree Level: A Case Study," International Journal of Intelligent Systems and Applications, vol. 7, no. 1, pp. 49-61, 2015.
- B. M. Monjurul Alom and M. Courtney, "Educational Data Mining: A Case Study Perspectives from Primary to University Education in Australia," International Journal of Information Technology and Computer Science (IJITCS), vol. 10, no. 2, pp. 1-9, 2018.
- M. Bogard, T. Helbig, G. Huff and C. James, "A comparison of empirical models for predicting student retention," Western Kentucky University, Bowling Green, 2011.
- P. Attewell, S. Heil and L. Reisel, "Competing explanations of undergraduate noncompletion," American Educational Research Journal, vol. 48, no. 3, pp. 536-559, 2011.
- S. Gershenfeld, D. Hood and M. Zhan, "The Role of First-Semester GPA in Predicting Graduation Rates of Underrepresented Students," Journal of College Student Retention: Research, Theory & Practice, vol. 0, no. 0, pp. 1-20, 2015.
- S. Herzog, "Estimating student retention and degree completion time: Decision trees and neural networks vis-vis regression," New Directions for Institutional Research, vol. 131, pp. 17-33, 2006.
- A. Mueen, B. Zafar and U. Manzoor, "Modeling and Predicting Students' Academic Performance Using Data Mining Techniques," International Journal of Modern Education and Computer Science (IJMECS), vol. 8, no. 11, pp. 36-42, 2016.
- A. C. Atherton, "Academic preparedness of first-generation college students: Different perspectives," Journal of College Student Development, vol. 55, no. 8, pp. 824-829, 2014.
- K. V. T. Bui, "First-generation students at a four-year university: Background characteristics, reasons for pursuing higher education, and first-year experience," College Student Journal, vol. 36, pp. 3-11, 2002.
- J. Engle and V. Tinto, "Moving beyond access: College success for low-income, firstgeneration students," The Pell Institute for the Study of Opportunity in Higher Education, Washington, DC, 2008.
- J. Aspelmeier, M. Love, L. Mcgill, A. Elliott and T. Pierce, "Self-Esteem, Locus of Control, College Adjustment, and GPA Among First- and Continuing-Generation Students: A Moderator Model of Generational Status," Research in Higher Education, vol. 53, pp. 755-781, 2012.
- J. J. Lee, L. J. Sax, A. K. Kim and L. S. Hagedorn, "Understanding students’ parental education beyond firstgeneration status," Community College Review, vol. 32, no. 1, pp. 1-20, 2004.
- S. Choy, "Students whose parents did not go to college: Postsecondary access, persistence, and attainment," 2001. [Online]. Available: https://nces.ed.gov/pubs2001/2001072_Essay.pdf. [Accessed 29 01 2019].
- G. P. McCarron and K. K. Inkelas, "The gap between educational aspirations and attainment for first-generation college students and the role of parental involvement," Journal of College Student Development, vol. 47, pp. 534-549, 2006.
- P. T. Terenzini, L. Springer, P. M. Yaeger, E. T. Pascarella and A. Nora, "First-generation college students: Characteristics, experiences, and cognitive development," Research in Higher Education, vol. 37, no. 1, pp. 1-22, 1996.
- E. Warburton, R. Bugarin, A. Nunez and C. Carroll, "Bridging the gap: Academic preparation and postsecondary success of first-generation students," 2001. [Online]. Available: https://nces.ed.gov/pubs2001/2001153.pdf. [Accessed 29 01 2019].
- K. Cushman, "Facing the Culture Shock of College," Educational Leadership, vol. 64, no. 7, pp. 44-47, 2007.
- S. Robinson, "Underprepared students," 1996. [Online]. Available: https://files.eric.ed.gov/fulltext/ED433876.pdf. [Accessed 17 12 2018].
- A. Shahiri, W. Husain and N. Rashid, "A Review on Predicting Student's Performance Using Data Mining Techniques," Procedia Computer Science, vol. 72, pp. 414-422, 2015.
- J. Cohen, "A coefficient of agreement for nominal Scales," Education and Psychological Measurement, vol. 20, no. 1, pp. 37-46, 1960.
- J. R. Landis and G. G. Koch, "The measurement of observer agreement for categorical data," Biometrics, vol. 33, no. 1, pp. 159-174, 1977.
