
Work and well-being: An empirical analysis using the regional database
Journal: Economic and Social Changes: Facts, Trends, Forecast @volnc-esc-en
Section: Social and economic development
Article in issue: 3 т.19, 2026.
Free access
Drawing on the concept of work-related well-being, this article tests a methodological toolkit designed to comprehensively assess an individual's standing in the world of work. The authors' approach to measuring work-related well-being relies on data from the Vologda Region labor potential quality monitoring survey. The uniqueness of the proposed study is due to the capabilities of its information base, which helps to construct a three-tier system of work-related well-being indicators. Alongside objective, factual indicators, this system incorporates two sets of subjective assessments that capture different dimensions of subjective well-being. The main findings of the study are as follows: 1) across most key dimensions, the level of work-related well-being is fairly high, largely because subjective indicators tend to outpace the factual ones; 2) assessments of work-related well-being in virtually all of its dimensions are directly correlated with a family's level of material well-being; 3) the most acute problem areas in the profile of work-related well-being are found in its non-monetary aspects, primarily, professional development; 4) the crucial factors that positively influence the level of well-being are the level of professional education – provided it matches the requirements of the workplace – and the stability of employment; 5) the level of work-related well-being is only weakly correlated with age but is closely associated with the qualitative characteristics of the worker's labor potential. The practical significance of the study lies in its potential to produce well-grounded management decisions at both the corporate and the regional level, aimed at creating higher-quality and more decent employment that helps improve a person's standing in the world of work.
Short address: https://sciup.org/147254769
IDS: 147254769 | UDC: 331.29, 331.104, 316.444.5 | DOI: 10.15838/esc.2026.3.105.10
Text of the scientific article Work and well-being: An empirical analysis using the regional database
The world of work can be approached from various perspectives, reflecting the interests of different parties to social and labor relations. The state focuses on balanced macroeconomic proportions and the ability of labor potential to meet the workforce needs of the national economy, given the changing structure of labor demand. Employers seek to increase returns on personnel, minimize opportunistic behavior, and optimize the corresponding cost components. For workers, in turn, the world of work is a vital source of satisfaction for a wide range of material and non-material needs. Thus, the interests of economic agents diverge and sometimes conflict, yet they may also have areas of overlap. The scale and role of these overlapping areas are growing in today’s conditions due to an objective trend toward the increasing role of human beings, their skills, preferences, and motivations in ensuring successful economic development. This highlights the relevance of a research perspective that examines the world of work from the standpoint of the working population. In our view, this perspective is most fully captured by the concept of work-related well-being.
This paper aims to empirically analyze the regional profile of work-related well-being, looking at the relationship between its objective and subjective dimensions, identifying its vulnerable areas, and examining the links between monetary and non-monetary aspects of well-being and both worker and job characteristics. The study continues a series of research projects on various aspects of human well-being (Shabunova et al., 2026).
The growing interest of economists in wellbeing in the world of work is driven by at least two factors. First, there is mounting empirical evidence supporting the hypothesis that a high quality of working life acts as a factor in raising labor productivity and strengthening the competitiveness of both firms and the economy as a whole
(Korogodin, 2021; Harter et al., 2002; Donald et al., 2005; Kauhanen, N tti, 2015). Second, objective global trends of rising material prosperity and the increasing diversity of working conditions and forms of employment mean that, as basic needs become satisfied, the range of employment contract aspects that matter to workers extends far beyond monetary compensation for their labor.
Recognizing the importance of ensuring favorable employment conditions for workers across a broad range of monetary and non-monetary aspects has given rise to international projects aimed at improving job quality and upholding workers’ rights and guarantees. The best-known of these is the International Labour Organization (ILO) initiative to promote decent work indicators, which sets standards in the social and labor sphere that employers and the state are expected to help uphold1. It is worth noting that the approach developed within the ILO framework involves tracking macroeconomic indicators that characterize the infrastructure and key features of the labor market as a whole – that is, the context in which social and labor relations are formed. Alongside this, however, the European Union and the Organisation for Economic Co-operation and Development have launched large-scale projects to assess job quality through employee surveys, making it possible to track labor market situations at the individual level and by socio-demographic group2. Notably, a common feature of these studies is their focus on describing the objective parameters of jobs without reference to the specific characteristics, needs, and preferences of the workers who hold them.
As an alternative to the objectivist approach taken by international organizations, a perspective that assesses a person’s position in the world of work through the lens of subjective well-being has gained ground within sociology and social psychology. This approach prioritizes individuals’ own assessments of their situation at work and their satisfaction with various aspects of their job and with their work as a whole (Diener et al., 2010; Bakker, Oerlemans, 2011; Paralta et al., 2023). The reliance on subjective evaluations characteristic of this strand of research sparks methodological debates.
Critics of this approach rightly point to the limited reliability of subjective assessments, which are influenced by personality traits and situational circumstances. Ignoring the objective side of employment is fraught with distortions, since workers’ levels of satisfaction can vary considerably depending on factors entirely unrelated to work or not directly dependent on the employer. In this context, set point theory is often invoked: according to this theory, each individual has a genetically predetermined baseline level of satisfaction with life and its domains (including work). This baseline can shift under the influence of external circumstances, but it acts as a kind of “center of gravity” to which a person returns once a new situation becomes familiar (Cummins et al., 2014).
While acknowledging the validity of these arguments, it must be said, however, that despite the undeniable importance of objective job characteristics, the subjective dimension of wellbeing cannot be dismissed.
First, satisfaction as such is an intrinsic value and a crucial component of well-being, which is not only beneficial for the individual but can also generate economic returns through increased initiative, a more responsible attitude toward one’s duties, reduced opportunistic behavior, and so forth. Research shows that quantitative measures of human feelings, emotions, and states possess considerable predictive power (Kaiser, Oswald, 2022) and correlate with actual behavior. For example, low job satisfaction raises the likelihood of subsequent quits (De Neve, Ward, 2023).
Second, the degree of alignment between a worker’s personal and professional characteristics, needs, and preferences and the objective conditions in which they are placed makes its own positive or, conversely, negative contribution to well-being. We believe that taking this alignment into account when designing a research methodology helps to capture the actual level of well-being more fully than considering only the objective parameters of jobs and the labor market situation.
Methodology and information base
In this study, the quantitative assessment of work-related well-being relies on the index method, which is widely used in the socio-economic sciences to aggregate indicators that capture different facets of the object under study into a composite measurement construct.
The authors’ approach to measuring work-related well-being is implemented using a unique database from the monitoring of the quality of labor potential of the population of the Vologda Region (Leonidova et al., 2018). The regional nature of the empirical base, on the one hand, limits the generalizability of the findings to other territories and to the country as a whole; on the other hand, it makes it possible to capture local specificities.
The monitoring has been conducted by the Vologda Research Center of the Russian Academy of Sciences since 1997: annually through 2009 inclusive, and once every two years since 2011. The data collection method is a questionnaire survey of the working-age population. The sample is constructed using area-based stratification with proportional allocation of observation units. The sampling type is quota sampling by gender and age. The random sampling error does not exceed 3–4% with a confidence interval of 4–5%. The surveys are carried out in the major cities of Vologda and Cherepovets and in eight municipal okrugs of the region (Babayevsky, Velikoustyugsky, Vozhegodsky, Gryazovetsky, Kirillovsky, Nikolsky, Tarnogsky, and Sheksninsky). The proposed methodological toolkit was tested on data from the 2024 wave. Accordingly, with due regard to current legislation, the object of the study was the region’s population aged 16 to 57 for women and 16 to 62 for men. The total sample size was 1,500 people. For the final analysis, respondents who were employed at the time of the survey were selected: those working only at their main job (59% of the total number of respondents), those with both a main and an additional job (10.6%), those combining their main job with casual earnings (6.3%), and those without a main job but engaged in casual earnings (4.1%). Thus, the analyzed sample of the employed population in 2024 amounted to 1,201 people (80% of the original sample of 1,500).
Our approach to measuring work-related wellbeing involves comparing factual indicators that capture the objective side of an individual’s position in the world of work with corresponding subjective assessments across the available range of monetary and non-monetary aspects, reflecting workers’ individual perception of the objective situation through the lens of their interests, needs, and preferences. In selecting indicators, we drew on previous empirical studies on the quality of working life, job quality, and subjective well-being of workers, while also taking into account the capabilities of the database, seeking to capture the key dimensions of work activity and to reflect the multifaceted nature of the phenomenon under study (Soboleva, Chernykh, 2025).
To date, the research community has not developed a standard set of aspects and corresponding indicators, yet a more or less clear consensus on the key employment parameters that shape the well-being of the working population has nonetheless emerged. Alongside earnings, which capture the material side of well-being, they typically include such non-material aspects as working conditions; opportunities for selffulfillment, professional development, and career growth; employment stability (job security); opportunities for voice and dialogue with the employer; and work-life balance. Some of these aspects characterize the labor process itself, others its institutional framework, and still others its interaction with other life circumstances; together, however, they form a comprehensive picture of work-related well-being.
In this study, given the specific features of the database, eight components of work-related wellbeing were identified: professional match; selffulfillment; professional development; career; employment security; protection and articulation of worker interests; working conditions; and income from employment ( Tab. 1 ). The proposed framework captures both the intrinsic content-related characteristics of work activity and its external conditions and outcomes, which together shape the employee’s holistic perception of their situation. Components such as professional match, self-fulfillment, professional development, career,
Table 1. Components and indicators for assessing work-related well-being
|
Component |
Indicators |
||
|
Factual |
Assessment |
||
|
Opinion |
Satisfaction |
||
|
Professional match |
Alignment of job with education received |
Alignment of qualifications (training) with the job performed |
Satisfaction with the match between qualifications, knowledge, and skills and the job performed |
|
Self-fulfillment |
– Alignment with abilities, – alignment with vocation, – having to do less interesting work |
Assessment of prospects for self-fulfillment in the profession |
– Satisfaction with job content, – satisfaction with opportunities for creativity at work |
|
Professional development |
Engagement in additional education and advanced training (at the main workplace; in an external organization; independently) |
Assessment of prospects for upgrading qualifications |
Satisfaction with opportunities for training and professional development |
|
Career |
Change in job position |
Assessment of career prospects |
Satisfaction with career advancement opportunities |
|
Employment security |
– Type of contract, – form of employment, – having to take unpaid leave, – having to switch to reduced working hours |
– Threat of job loss, – employer’s payment of insurance contributions |
– Satisfaction with the stability of one’s position in the organization, – satisfaction with the organization’s stability |
|
Protection and articulation of worker interests |
– Trade union membership, – violations of labor rights |
Possibility of dialogue with the employer to defend labor rights |
– Satisfaction with the work of a trade union or other worker organization, – satisfaction with relations with the organization’s management, – satisfaction with compliance with labor legislation in the organization |
|
Working conditions |
– Strain on physical capacity and health, – strain on mental well-being |
Possibility of dialogue with the employer to improve working conditions |
– Satisfaction with working conditions overall, – satisfaction with occupational safety, – satisfaction with technical equipment |
|
Income from employment |
– Amount of earnings, – regular wage delays, – having to accept a reduction in earnings |
Assessment of prospects for decent pay |
– Satisfaction with earnings, – satisfaction with the material incentive system |
|
Source: own compilation. |
|||
and working conditions directly characterize the labor process. The components of well-being that reflect its institutional framework and instrumental utility are income from employment, employment security, and protection and articulation of worker interests. The list of questions used to assess the eight components of work-related well-being is detailed in the Appendix.
The uniqueness of the proposed assessment toolkit stems from the capabilities of the database, which makes it possible to construct a three-tier system of work-related well-being indicators. Alongside objective factual indicators, it includes two series of subjective assessments that capture different facets of subjective well-being: the respondent’s assessment of various job parameters and satisfaction with the corresponding aspect of work. This arrangement overcomes the limitations inherent in approaches that rely exclusively on one of these groups of indicators and yields a more relevant and multidimensional picture of work-related well-being. The first block – factual indicators – captures the objective parameters of the employment situation. The second block – subjective indicators – reflects subjective perception, i.e., how work is refracted in the respondent’s consciousness. Distinguishing several components (assessments and satisfaction) within the subjective block helps to increase the reliability of the results, as it smooths out the influence of situational and personal factors that may distort respondents’ answers.
To test the internal consistency (reliability) of the composite index and its component sub-indices (in order to show that the items included in each index are indeed consistent with one another), Cronbach’s alpha was calculated. The composite index of work-related well-being demonstrates high reliability/consistency (α = 0.866 based on 44 individual variables; α = 0.857 based on 8 component sub-indices). The sub-indices of Selffulfillment (6 variables; α = 0.616), Professional development (5 variables; α = 0.687), Employment security (8 variables; α = 0.635), Protection and articulation of worker interests (6 variables; α = 0.601), and Income from employment (6 variables; α = 0.600) show acceptable reliability. The subindices of Professional match (3 variables; α = 0.417), Career (3 variables; α = 0.475), and Working conditions (6 variables; α = 0.389) have low but, for small scales, acceptable internal consistency.
To ensure clarity of exposition and avoid terminological confusion, we explain the meaning of the calculated indices as follows:
-
1) composite work-related well-being index (CI well ) – a summary measure reflecting the overall level of work-related well-being;
-
2) component sub-indices – measures reflecting the level of well-being for each of the eight identified aspects; each component sub-index is assessed using three types of indicators (factual indicators, assessment, satisfaction);
-
3) indicator-type sub-indices – measures reflecting the overall level of well-being broken down by measurement approach:
-
– factual sub-index (SI fact ) – aggregates objective (factual) indicators across all eight wellbeing components,
-
– satisfaction sub-index (SI sat ) – includes satisfaction indicators across all eight well-being components,
-
– assessment sub-index (SI as ) — includes cognitive assessments across all eight well-being components.
This system of indices makes it possible to identify both problem areas in the world of work and the specifics of how they are perceived. A substantial excess of the satisfaction sub-index over the factual sub-index may signal adaptive rationalization of expectations and aspirations in objectively unfavorable conditions (Sen, 1992; Burchardt, 2005).
The composite work-related well-being index is calculated as the arithmetic mean of the values of the component sub-indices, each of which, in turn, is calculated as the arithmetic mean of the normalized values of its constituent indicators (all variables used are standardized to a range from 0 to 1; see the Appendix for details). The range of all calculated indices lies between 0 and 1, where 0 corresponds to the lowest possible level of wellbeing and 1 to the highest possible level.
The calculated indices are interpreted using both mean values and an equal-interval scale divided into four qualitative levels with a step of 0.25: low level (0–0.249), below-average level (0.25–0.499), above-average level (0.5–0.749), and high level (0.75–1). This gradation ensures the clarity of analysis, enables comparative analysis, and helps identify target groups for the development of corrective measures.
Among the limitations that must be taken into account when interpreting the results – and that point toward directions for future research – is the decision not to weight the well-being components when constructing the composite index. While this choice may be considered debatable, it rests on the theoretical premise that all eight aspects are equally important and is consistent with the practice of many well-known index-based studies 3 , as it avoids the subjectivity involved in assigning weighting coefficients. At the same time, assigning equal weights to all eight components may fail to capture the actual variation in their importance for different groups of workers. In the future, weights derived from factor analysis or expert assessments could be incorporated.
Another important limitation is the static nature of the measurement. The calculated indices capture the situation at the time of the survey and do not reflect trends in the level and structure of work- related well-being. The monitoring nature of the database, however, makes it possible to investigate regional trends in the profile of work-related wellbeing in future research.
The following hypotheses were formulated and substantiated for empirical testing in the study.
-
1. In recent years, the intensifying labor shortage has strengthened the competitive position of workers in the labor market, which has found expression in wage growth. At the same time, against the backdrop of accelerating price growth, nominal employment incomes have been rising faster than real incomes, which may have contributed to an overly positive assessment of changes (Soboleva, Sobolev, 2025). It can therefore be hypothesized that, under current conditions, work-related wellbeing is at a high, or at least above-average, level, largely driven by an excess of subjective well-being indicators over factual ones.
-
2. A distinctive feature of the Russian economy, whose roots trace back to the Soviet planned system, is the relatively low level of wages combined with a commitment to full employment and strong institutional guarantees of job security (Sobolev, Soboleva, 2022). It can therefore be hypothesized that the most salient vulnerability in the overall profile of work-related well-being is its monetary aspect – related to the inadequacy of wages to meet basic needs at a socially acceptable level – while its core strength is employment security.
-
3. Education has traditionally been viewed as the gateway to good jobs that offer prospects for stable professional and career growth. At the same time, there is a discernible trend in today’s conditions toward a preference for flexible nonstandard employment that provides time sovereignty and relatively high earnings, including among young, educated, and quite competitive workers (Baimurzina et al., 2024; Strebkov, Shevchuk, 2022). Nonetheless, we hypothesize that, at present, in the absence of an effective infrastructure for protecting rights and guarantees that extends to
-
4. A substantial body of literature is devoted to age discrimination against workers (Klepikova, Kolosnitsyna, 2017; Kozina, Zangieva, 2018; Ashwin et al., 2021). At the same time, data from the Comprehensive Living Conditions Survey of the population show the highest satisfaction with various aspects of work among older age groups. In recent years, against the backdrop of labor shortages, experienced workers, including those of older ages, have become more sought after in many sectors of the economy. Given these circumstances, it can be hypothesized that the level of work-related well-being is weakly correlated with age but is closely linked to the qualitative characteristics of a worker’s labor potential.
new non-standard forms of employment, a more vulnerable profile of work-related well-being may be found not only among workers with relatively low educational attainment but also among those employed under non-standard arrangements, as well as those working in the primary sector of the economy.
Results and discussion
The first hypothesis – that work-related wellbeing would be at a high level, largely driven by the contribution of subjective assessments – was largely confirmed. The calculations showed that the values of all sub-indices by indicator type fall into the above-average range, while the composite index stands at 0.644, i.e., roughly in the middle of the third interval (above average). At the same time, the highest values are observed for the satisfaction indicators. Interestingly, the values of the factual sub-index and the assessment sub-index are very close, at 0.623 and 0.624 respectively (Fig. 1). Meanwhile, the satisfaction sub-index amounts to 0.707, which is very close to the upper boundary of the above-average interval, confirming the expected “surge” in satisfaction against the backdrop of accelerating upward earnings dynamics.
The study revealed an important relationship: individual assessments of work-related well-being across virtually all components are directly linked to the level of household material well-being; that is, “well-off” workers with higher composite index scores earn higher wages ( Fig. 2a, 2b ). Moreover, among respondents for whom “buying most goods presents no difficulty,” the composite work-related well-being index reaches 0.694, and the satisfaction sub-index enters the high-level zone (0.750); whereas for workers who experience difficulty even purchasing food, the corresponding values are significantly lower (composite index 0.564, satisfaction sub-index 0.602). Given that the material opportunities of households are framed
Figure 1. Sub-indices of work-related well-being by indicator type
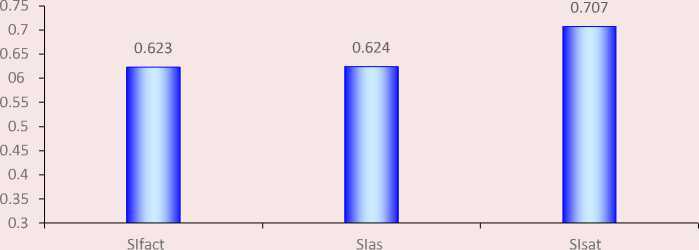
Note: SI fact – factual sub-index; SI as – assessment sub-index; SI sat – satisfaction sub-index.
Source: data from the monitoring of the quality of labor potential of Vologda Region population, 2024; own calculations.
by employment incomes, which account for over 60% of total income (Leonidova et al., 2026), the upward wage dynamics observed in recent years may have been accompanied by a “spillover effect,” positively influencing all aspects of the subjective side of worker well-being.
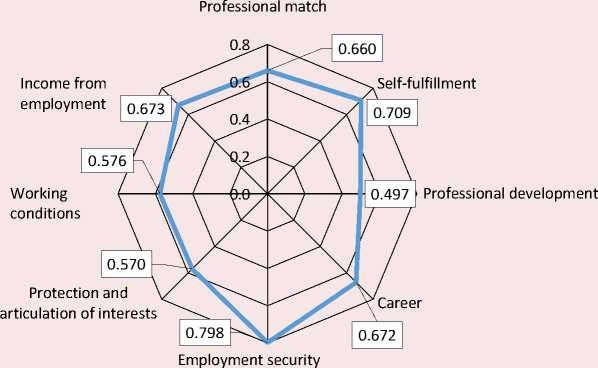
The second hypothesis, concerning the expected vulnerabilities and strengths of the work-related well-being profile, was partially confirmed. Consistent with our assumptions, the employment security component registered the highest point on the well-being profile (0.798). Notably, this is the only aspect falling into the most favorable fourth interval (high level; Fig. 3). This is fully in line with the specific features of the Russian labor model, which prioritizes employment stability and security (Sobolev, 2015). In our survey, the overwhelming majority of respondents are permanently employed (88%) and work full-time (75%), i.e., their employment is firmly protected by law.
At the same time, contrary to expectations, the monetary aspect of well-being did not emerge as a vulnerable area. The sub-index value for the “income from employment” component stands at 0.673, which is even slightly higher than the composite index (the arithmetic mean of all
Figure 2a. Wage levels by composite work-related well-being index levels, rubles

Low level of well-being (0 - 0.249)
Level of well-being below average (0.250 - 0.499
Level of well-being above average (0.500 - 0.749)
High level of well-being (0.750 - 1)
Note. The non-parametric Kruskal – Wallis test was used to assess statistical differences between mean wage levels across composite work-related well-being index levels. The distribution of wages differs significantly (p < 0.05).
Source: data from the monitoring of the quality of labor potential of Vologda Region population, 2024; own calculations.
Figure 2b. Values of the composite work-related well-being index by wage quartiles, rubles
0.800
0.700
0.600
0.500
0.400
0.300
0.200
0.100
0.000
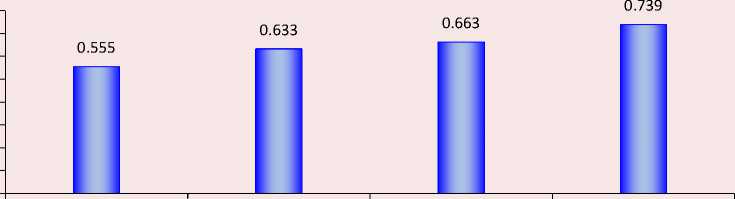
under 30,000 rubles 30,001-40,000 rubles 40,001-50,750 rubles 50,751 rubles and higher
Note. The non-parametric Kruskal – Wallis test was used to assess statistical differences between composite work-related well-being index values across wage quartiles. The distribution of index values differs significantly (p < 0.05).
Source: data from the monitoring of the quality of labor potential of Vologda Region population, 2024; own calculations.
aspects), placing this component in the aboveaverage well-being zone. This result may reflect the aforementioned effect of upward earnings dynamics and the consequent improvement in household monetary well-being. However, for many categories of workers, some income growth has not solved the problem of wages being insufficient to meet basic needs at a socially acceptable level. For instance, a survey conducted by the research center of the Superjob 4 portal in February 2026 showed that 26% of Russians consider the salaries of teachers and preschool educators insufficient, and 16% feel the same about doctors, paramedics, and nurses. Our research indicates that 65% of young teachers in schools of the Vologda Region are dissatisfied with their salary level (Belekhova, Leonidova, 2023).
Nevertheless, at present, the most acute problem areas in the work-related well-being profile lie in its non-monetary aspects. The lowest value (0.497) is observed for the professional development aspect.
Notably, this is the only component sub-index falling into the below-average well-being zone. This alarming result reflects the existing problems in enterprises and organizations regarding limited opportunities for worker upskilling. Every third respondent (30%) noted that there is no professional development system at their enterprise (Popov et al., 2026). At a time when transformative processes in the economy require workers to constantly adapt to dynamically changing job requirements and to update and expand their skills and competencies, the identified deficit in the professional development component is fraught with serious negative consequences for both workers’ well-being and the regional economy.
Another problem area is “protection and articulation of worker interests” (0.570), which appears to stem from the weak exercise of trade union functions within work collectives and possible violations of labor rights. The latter is
Figure 3. Component sub-indices of work-related well-being, 2024
Source: data from the monitoring of the quality of labor potential of Vologda Region population, 2024; own calculations.
corroborated by the fact that 32% of respondents had difficulty giving a definite answer as to whether the enterprise where they are employed pays insurance contributions. The underdevelopment of the infrastructure that ensures the representation of worker interests is reflected in the low level of trade union involvement. According to the survey, only 13% of respondents are trade union members.
The third hypothesis, concerning the factors shaping the level of work-related well-being, was largely confirmed. The most important factors positively affecting well-being are educational attainment and employment stability. However, the study revealed a number of nuances and exceptions, above all with respect to the education factor.
Practically all component sub-index values for holders of higher professional education are higher than those for respondents with lower levels of education 5 . Across all educational categories, the employment security component sub-index shows the highest values and falls into the fourth interval (high level of well-being). Among workers with higher education it reaches 0.832, among those with secondary vocational education it stands at 0.771, and among those with incomplete secondary and initial vocational education it equals 0.802. At the same time, it is important to note that the link between higher job satisfaction and higher education is not absolute. A more important factor is the match between the profile of the professional education received and the requirements of the job. When such a match is present, the probability of high satisfaction rises; when it is absent, it declines. This finding aligns with the conclusions of a number of other studies.
By form of employment, groups of workers are clearly distinguished in terms of well-being assessments. The first group comprises workers employed on a permanent contract in accordance with the requirements of the Labor Code of the Russian Federation. The second group includes those with temporary, seasonal, or platform employment, as well as those scraping by with casual earnings and those working on a rotational basis. Calculations show that members of the first group exhibit higher assessments of work-related well-being than the majority of those employed under non-standard arrangements ( Tab. 2 ). This is also confirmed by research findings based on Rosstat’s Comprehensive Living Conditions Survey data (Chernykh, 2023; Soboleva et al., 2025).
Only one category of workers with non-standard employment stands out from the overall picture: those working on a rotational basis. Rotational workers show not only the highest level of monetary well-being – which is quite predictable – but also lead in such components characterizing the level and development prospects of human potential as self-fulfillment, professional development, and career. Among the rotational worker respondents, long-haul truck drivers made up a large share (57%). At the same time, research by the Institute of Socio-Political Research of the Federal Center of Theoretical and Applied Sociology of the Russian Academy of Sciences, conducted jointly with the National Automobile Union, has revealed a paradox: despite a high level of satisfaction, more than half of long-haul truck drivers changed their place of work over the past three years 6 . Their high assessments may be linked to the benefits and compensation for hazardous working conditions stipulated for this socio-professional group in the
Table 2. Component sub-indices of work-related well-being by form of employment
|
Sub-index |
Permanent/ regular employment |
Temporary employment |
Seasonal employment |
Casual/episodic employment |
Rotational employment |
Platform employment |
|
Professional match* |
0.681 |
0.420 |
0.482 |
0.342 |
0.581 |
0.417 |
|
Self-fulfillment* |
0.720 |
0.603 |
0.622 |
0.431 |
0.786 |
0.458 |
|
Professional development |
0.503 |
0.466 |
0.352 |
0.347 |
0.659 |
0.208 |
|
Career* |
0.683 |
0.546 |
0.624 |
0.458 |
0.795 |
0.450 |
|
Employment security* |
0.815 |
0.636 |
0.632 |
0.411 |
0.804 |
0.531 |
|
Protection and articulation of interests* |
0.581 |
0.452 |
0.493 |
0.385 |
0.529 |
0.525 |
|
Working conditions |
0.577 |
0.554 |
0.600 |
0.498 |
0.529 |
0.507 |
|
Income from employment |
0.680 |
0.620 |
0.593 |
0.500 |
0.866 |
0.424 |
|
Composite work-related well-being index* |
0.655 |
0.537 |
0.550 |
0.422 |
0.694 |
0.440 |
|
Note. The non-parametric Kruskal – Wallis test was used to assess statistical differences between mean index values across forms of employment. An asterisk (*) marks indices where the differences are statistically significant (p < 0.05). Source: data from the monitoring of the quality of labor potential of Vologda Region population, 2024; own calculations. |
||||||
Labor Code of the Russian Federation and other legislative acts (entitlement to additional paid leave, the right to early retirement, etc.). In light of this, the high value of the employment security component (0.804) becomes understandable. Moreover, the high level of monetary well-being (the income from employment component for this category of workers is 0.866) is associated, as noted, with a spillover effect, which may positively influence the entire pattern of the well-being profile. Analysts at hh.ru, a Russian online recruitment platform, found that the median offered salary in rotational vacancies across Russia reached 154.5 thousand rubles in Q1 2025, which is twice the average level of offers in the labor market (74 thousand rubles) 7 .
At the same time, the level of well-being among workers in the remaining forms of precarious employment – temporary, seasonal, platform, and episodic – is relatively low, particularly in the group of workers with “casual earnings”. For the professional match aspect, the sub-index is only 0.342. Low scores are also recorded among platform workers, for whom professional development is likewise the most problematic component. The problem areas identified among respondents in precarious employment point to the heightened vulnerability of these categories, highlighting the need for targeted support measures.
Alongside workers in precarious forms of employment, those employed in the primary sector of the economy also find themselves in a zone of vulnerability ( Tab. 3 ). This situation can probably be explained by the specific nature of agricultural labor (seasonal character of employment, territorial remoteness of workplaces, limited opportunities for professional growth and collective representation of interests, etc.).
For most components of work-related wellbeing, the secondary sector (industry) takes the lead. Pronounced areas of vulnerability for workers employed here are working conditions (0.543), professional development (0.526), and protection and articulation of interests (0.567). This result is quite expected. Industry, especially extractive industry, accounts for a significant share of employment under unfavorable conditions8. As for professional development and the defense of interests, these aspects show a considerable decline across all categories of workers, which, as noted, is a very alarming symptom fraught with multifaceted negative consequences.
When comparing the well-being indicators of those employed in industry and in the tertiary sector, it should be borne in mind that, compared with material production, the latter is considerably less homogeneous and is characterized by a greater diversity of working conditions and forms of employment. Within this sector, the lowest values of both factual and assessment component sub-indices are recorded among trade workers (their composite well-being index equals 0.595) and workers in the “hotels and restaurants” economic activity (0.629). This result is generally to be expected, given that the average wage in trade, despite its substantial growth driven by the intensifying personnel shortage, remains roughly one-third lower than the national average for Russia.
The fourth hypothesis, which links well-being to the quality of a worker’s labor potential, received unequivocal confirmation 9 .
The study showed that the age profile of work-related well-being is generally flat ( Tab. 4 ). Across most aspects, the youngest age group appears somewhat less well-off, which can be explained both by an inflated level of aspirations and by the fact that among workers aged 18–24 there is a high share of those who have not wished or have not yet had time to obtain sufficient professional education – that is, it is not age as such but rather the characteristics of labor potential. This conclusion is broadly consistent with the findings of a number of other studies (Paul, Phua, 2011; Kartashevich et al., 2015; Kucherenko, 2024; Chernykh, 2023).
At the same time, according to the calculations performed, a high level of worker well-being corresponds to a higher assessment of the qualitative characteristics of his/her labor potential (Leonidova et al., 2018). This relationship is traced across both the factual and the assessment-based well-being subindices ( Tab. 5 ). The findings suggest a link between the quality of labor potential and the level of worker well-being: higher qualitative characteristics are associated with a higher level of well-being.
The association between well-being and the quality of labor potential is confirmed not only by
Table 3. Component sub-indices of work-related well-being by sector of the economy
|
Sub-index |
Agriculture (primary sector) |
Industry (secondary sector) |
Service sector (tertiary sector) |
|
Professional match |
0.613 |
0.677 |
0.664 |
|
Self-fulfillment* |
0.651 |
0.747 |
0.707 |
|
Professional development |
0.462 |
0.526 |
0.492 |
|
Career* |
0.671 |
0.713 |
0.661 |
|
Employment security |
0.768 |
0.795 |
0.799 |
|
Protection and articulation of interests |
0.544 |
0.567 |
0.567 |
|
Working conditions* |
0.597 |
0.543 |
0.579 |
|
Income from employment* |
0.692 |
0.717 |
0.653 |
|
Composite work-related well-being index |
0.625 |
0.661 |
0.640 |
|
Note. The non-parametric Kruskal – Wallis test was used to assess statistical differences between mean index values across sectors of the economy. An asterisk (*) marks indices where the differences are statistically significant (p < 0.05). Source: data from the monitoring of the quality of labor potential of Vologda Region population, 2024; own calculations. |
|||
8 It should be noted that 40% of manufacturing enterprises in Russia have jobs with harmful working conditions. Share of employees working under harmful and (or) hazardous conditions in organizations of the Russian Federation, by type of economic activity (as of the end of 2024), tables. Available at: (accessed: 23.02.2026).
9 HeadHunter: The average salary of salespeople increased by 15%. Available at: personnel/ (accessed: 12.02.2026).
Table 4. Component sub-indices of work-related well-being by workers’ age
|
Component sub-index |
Age |
|||
|
18–24 years |
25–29 years |
30–49 years |
50 years and older |
|
|
Professional match |
0.583 |
0.695 |
0.663 |
0.659 |
|
Self-fulfillment |
0.644 |
0.725 |
0.719 |
0.693 |
|
Professional development* |
0.498 |
0.559 |
0.502 |
0.456 |
|
Career |
0.680 |
0.712 |
0.675 |
0.647 |
|
Employment security |
0.760 |
0.814 |
0.803 |
0.788 |
|
Protection and articulation of interests |
0.511 |
0.592 |
0.573 |
0.572 |
|
Working conditions |
0.570 |
0.580 |
0.571 |
0.588 |
|
Income from employment |
0.670 |
0.685 |
0.678 |
0.655 |
|
Composite work-related well-being index |
0.614 |
0.670 |
0.648 |
0.632 |
Note. The non-parametric Kruskal – Wallis test was used to assess statistical differences between mean index values across age groups.
An asterisk (*) marks indices where the differences are statistically significant (p < 0.05).
Source: data from the monitoring of the quality of labor potential of Vologda Region population, 2024; own calculations.
Table 5. Values of the labor potential quality index by level of work-related well-being sub-indices
|
Sub-index |
Level of well-being sub-indices |
|||
|
Low |
Below average |
Above average |
High |
|
|
Factual sub-index (SI fact ) |
0.570 |
0.652 |
0.682 |
0.708 |
|
Assessment sub-index (SI as ) |
0.641 |
0.645 |
0.687 |
0.703 |
|
Satisfaction sub-index (SI sat ) |
0.617 |
0.652 |
0.662 |
0.705 |
|
Composite work-related well-being index (CI well ) |
0.572 |
0.639 |
0.672 |
0.722 |
Source: data from the monitoring of the quality of labor potential of Vologda Region population, 2024; own calculations.
Table 6. Strength of the pairwise association between the independent variables – the work-related well-being index and the labor potential quality index
|
Indicator |
CI well |
I LPQ |
||
|
Kendall’s tau-b |
CI well |
Correlation coefficient |
1.000 |
0.317** |
|
Sig. (two-tailed) |
0.000 |
|||
|
Spearman’s rho |
CIwell |
Correlation coefficient |
1.000 |
0.456** |
|
Sig. (two-tailed) |
0.000 |
|||
** Correlation is significant at the 0.01 level (two-tailed).
the cross-tabulations but also by correlation coefficients ( Tab. 6 ). Between the work-related wellbeing index (CI well ) and the labor potential quality index (I LPQ ) there is a statistically significant positive relationship: moderate according to Kendall’s tau-b (α = 0.317, p < 0.01) and substantial according to Spearman’s rho (α = 0.456, p < 0.01).
The identified relationship is bidirectional and shows that, on the one hand, a higher quality of labor potential (skills, competencies, health status, etc.) corresponds to a higher level of work-related well-being; on the other hand, more well-off workers, as a rule, possess higher labor potential characteristics. However, we emphasize that correlation does not equal causation: it cannot be claimed that one directly causes the other. Both mutual influence (growth in labor potential quality enhances work-related well-being, while higher well-being fosters the development of labor potential) and the influence of a third variable (e.g., corporate culture) are possible. The exact mechanism linking worker well-being and labor potential requires further research.
Conclusion
The empirical analysis of the regional profile of work-related well-being has shown that using this concept as a methodological framework enables a holistic diagnosis of both the strengths and the vulnerabilities of the employed population’s situation at the micro level and its links to worker and job characteristics.
A number of hypotheses were advanced and tested in the study, yielding the following results.
-
1. Across most key aspects, the level of work-related well-being is fairly high, which is largely driven by a high satisfaction component. The satisfaction sub-indices are significantly higher than the assessment sub-index and the factual indicators.
-
2. Assessments of work-related well-being across virtually all its aspects are directly dependent on the level of household material well-being. For low-income workers, wage inadequacy acts as a constraining factor across all aspects of the work-related well-being profile, including non-monetary ones. At the same time, contrary to the initial hypothesis, the monetary aspect of well-being (income from employment) does not currently feature among the most vulnerable areas of the wellbeing profile. This may be attributable to the upward wage dynamics observed in recent years.
-
3. Both the most favorable and the most acute problem areas of the work-related well-being profile lie in its non-monetary aspects. A high level of wellbeing in such aspects as employment security and self-fulfillment contrasts with low indices for professional development and the protection and articulation of worker interests. This points to the persistence of an employment model that prioritizes stability maintenance while lacking opportunities for growth and social dialogue.
-
4. The most important factors positively influencing the level of well-being are the level of
-
5. A positive correlation was found between the level of well-being and the quality of labor potential, which underscores not only the social but also the economic rationale for investing in the strengthening of work-related well-being. Improvements in worker well-being are associated with growth in their human capital and, consequently, with higher labor productivity.
professional education – provided it matches the requirements of the job – and employment stability. Practically all component well-being sub-indices are higher among respondents with higher education than among workers with lower levels of education. At the same time, higher education graduates not working in their field of study lose a substantial share of the monetary and non-monetary benefits associated with education. Workers employed under non-standard arrangements and in the primary sector of the economy find themselves in a zone of disadvantage. This may create pockets of tension and calls for targeted policy interventions.
The limitations of the toolkit applied in this study include its static nature, the use of an equalweighting scheme in index construction, and its regional character, all of which, however, point to directions for further inquiry. Future research could involve comparative analysis drawing on nationwide databases (such as the Comprehensive Living Conditions Survey and the Russia Longitudinal Monitoring Survey) and a deeper investigation of the causal relationships between well-being and other available socio-economic indicators.
Thus, the developed toolkit opens up opportunities for monitoring, cross-regional comparisons, and the formulation of evidence-based managerial decisions at both the corporate and regional levels, aimed at promoting higher-quality and decent employment that contributes to improving the individual’s position in the world of work.
