
Approach to the formation and analysis of a complex model based on weakly formalized heterogeneous data
Journal: Computer Optics @computer-optics
Section: Обработка изображений, распознавание образов
Article in issue: 2 т.50, 2026.
Free access
In the current study, a general approach to the formation of a storage model and development of tools for representation of multidimensional heterogeneous data that would allow real-time operation with these data, is proposed. This approach is based on the previously formulated requirements for models of representing multidimensional heterogeneous data. A functional diagram for combining heterogeneous multidimensional data and adding them to an existing data model has been created. The advantages of data analysis using such model compared to working with disparate data are discussed. Development of the tool for integrating heterogeneous data in the context of solving the problem of combining aerial photography data obtained from unmanned aerial vehicles is shown. The fundamental possibility of combining aerial photography data from different spectrums, as well as using derived data such as object detection results as an additional layer of heterogeneous data within the general model, is demonstrated.
Similar articles in the section Special auxiliary subdivision for computing
Short address: https://sciup.org/140314846
IDS: 140314846 | DOI: 10.18287/COJ1668
Text of the scientific article Approach to the formation and analysis of a complex model based on weakly formalized heterogeneous data
Heterogeneous data (collected from sources of different nature) are rarely characterized by high indicators of completeness and accuracy. This makes it difficult to process and further analyze them.
Based on these premises, processing large arrays of heterogeneous (including multispectral) data, for example data obtained from sensors of different types, resolution, accuracy and frequency of measurements, requires the development of complex and intelligent solutions [1, 2]. Traditional approaches to data processing do not take into account the close relationships between these types of data, while data fusion approaches [3, 4], when combining data, are most often aimed at building models for solving specific problems, concentrating only on the data that is required in the current task statement, while the rest of the data remains unused, and when the task changes, a partial or complete rebuilding of the data model may be required.
Fast and correct selection of the appropriate algorithm for visualizing heterogeneous data is of great importance. A tool that can provide the flexibility to select aggregation and visualization mechanisms can become a key part of intelligent systems that work with multidimensional arrays of heterogeneous data. Reliability, accuracy and speed of these systems remain crucial, especially in critical areas such as autonomous vehicles, security systems, medical technologies, modeling and forecasting natural and social events [5]. Currently, methods for synchronizing heterogeneous data are often too laborintensive and cannot be used in tools aimed at interactive user work with data in real time. The advantages of integrating heterogeneous data are quite obvious, as the joint analysis of these data allows both increase the reliability of the results and help to make a decision in cases where the analysis of each data source separately is unable to provide a solution [6]. These factors make the development of tools and algorithms for aggregation, processing, and visualization of multidimensional heterogeneous data in real time (including weakly formalized data), for specific cases, a relevant and important task.
Previously [7], as one of the first stages in creating a tool for working with multidimensional arrays of heterogeneous data, requirements for representing models and algorithms for pre-processing (including acquiring and integrating) weakly formalized heterogeneous data were developed. Additionally, an algorithm for combining visual data from aerial photography and geographic coordinates was proposed. Furthermore, a software tool that demonstrates the potential and applicability of the proposed approach for tasks related to acquiring, integrating, processing, and visualizing weakly formalized multispectral data from aerial photography images of various spectra was created.
The existing known solutions devoted to the tasks considered in [7] are most often closed and proprietary, or partially closed, as part of commercial systems. It is difficult to directly compare the proposed approach with such solutions, since private solutions are focused on solving one specific task (for example, combining aerial photography data, object recognition).
Within the framework of this study, a general approach to the formation of a storage model and development of tools for the representation of multidimensional heterogeneous data is proposed. These tools would allow the data to be processed in real time within a single, interactive data model, with potential for application in solving problems from various practical areas, where a universal model for storing, processing and analyzing multidimensional heterogeneous data is required. This approach is based on previously formulated requirements for models of representing multidimensional heterogeneous data.
1. Formation of a model for multidimensional heterogeneous data
The main idea behind the formation of a model for multidimensional heterogeneous data, as formulated in [7], is to meet three key requirements for data integration algorithms: integrity, uniformity, and consistency. In other words, a model of multidimensional heterogeneous data as a tool for working with them should allow users to combine, store, and analyze data from different sources in a single, holistic, and consistent structure.
Classical methods of data collecting, processing and storage are often limited to approaches that include preliminary adaptation and normalization of data, such as ranking nominal categorical data for their subsequent use in quantitative analysis as ordinary [8]. This can lead to the loss or distortion of significant information about the objects under study at the stage of data preparation. Therefore, in computer vision, there are many methods and algorithms for data preprocessing to compensate for the distortions introduced during information extraction from data and analysis of this information [9, 10]. In contrast, the multidimensional data storage model assumes a more dynamic and scalable architecture capable of storing and using heterogeneous data of any nature in further analysis.
In general, the problem of forming a model for multidimensional heterogeneous data can be represented as follows: there are data sources D i about the object of study, with a total number of n . It is permissible to assume that each data source stores multidimensional homogeneous data within itself (that is, the nature of data in the source is the same, for example, images are two-dimensional arrays of pixels; a point cloud obtained from depth sensors is an array of coordinates of points in space). The dimensionality of each data source is denoted as dim . The data in the source can be both numerical and categorical.
A problem of forming a model for multidimensional heterogeneous data is relatively easy to solve when the dimensions of data sources are dim <4 and the number of data sources is n <3. However, when trying to combine heterogeneous data with a higher dimension and/or from a larger number of sources, the problem of further effective analysis and visualization inevitably arises. Even when combining two data sources of dimension 2 into a single data model, its visualization becomes a non-trivial task. Therefore, when combining images obtained in different wavelength ranges, the most common options for data presentation are separate layers or combining data into a single image with the inevitable loss of a large amount of information. In case one of the sources cannot be unambiguously represented in numerical form, an attempt to visualize it may lead to false interpretations and, as a consequence, incorrect conclusions based on data analysis results.
In modern conditions, when new problems are formed more rapidly, existing solutions tend to become obsolete much faster, which leads to less efficient data processing. This requires more universal data models that can be more flexible and adaptive to specific problems without rebuilding their structure, that is, it is proposed to use a broader and more universal approach to the formation of a model of multidimensional heterogeneous data, potentially capable of being part of the solution of a number of narrowly focused problems related to the data involved in the model. At the same time, the creation of an independent product solving these problems may be in demand as a competing approach with development potential and a wider application than simply creating three-dimensional maps based on aerial photography data or detecting objects in images.
In connection with the above, a concept of a multidimensional heterogeneous data model and a general approach to its formation is proposed. This approach involves minimal intervention in the structure of initial data and prioritizes the addition of new information and data to the model rather than transformation and simplification of the initial data. The key idea of the proposed approach is to combine data without highlighting the significant data and without discarding the uninformative data within the framework of solving a specific problem. This idea can potentially lead to the creation of more information-rich data models.
The key condition for the possibility of creating such a model is the presence (or fundamental possibility of formulation) of rules (algorithms) for synchronizing R i,k of each data source with at least one other source. From here on, the synchronization rule will be understood as a direct or indirect connection between two data sources, for example, a set of times and locations of temperature and carbon dioxide measurements by sensors, a set of geographic coordinates, times and shooting angles for aerial photography images in different spectra, and so on. These rules may be based on ratios of measurement scales, a direct correspondence between values of data sources, or some interpretation that allows comparing data of two sources D i and D j . Obviously, if there is ambiguity in the interpretation of the relationship between quantities, more than one such rule corresponding to two sources D i and D j can be formulated (Fig. 1).
Technically, if there are several variants of rules for synchronizing any two data sources in a multidimensional heterogeneous data model, it is not possible to visualize such a model in a single way. The possibilities for using certain visualization metaphors increase depending on the chosen interpretation of the relationship between data sources [11]. At a minimum, the set of all possible variants of model visualization V ’ increases relative to the visualization options V of a uniquely interpretable model of heterogeneous data G multiple times depending on the number of alternative rules for synchronizing any two data sources D i and D j in the model:
V’=V×(k1×k2×…×ki×…×kN), where ki is the number of synchronization rules for two data sources, N is the number of all possible combinations of two data sources connected by at least one synchronization rule.
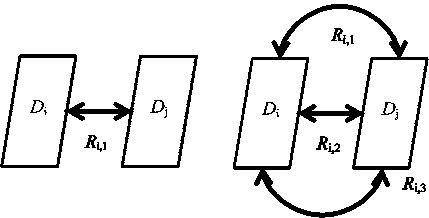
a) b)
Fig. 1. Examples of synchronization rules for two data sources, a) one rule that unambiguously interprets the connection between data sources, b) 3 different synchronization rules that can connect two data sources
At a minimum, a model of multidimensional heterogeneous data G should include a set of n data sources D i of dimensions dim i , sets of rules for synchronizing R i,k these data sources D i with each other, with a total number l of at least n – 1. As a result, in the simplest case, where l = n – 1, the rules for synchronizing R i,k can represent data sources as a linearly ordered set or another structure (Fig. 2). In this interpretation, it is possible to establish an unambiguous connection between any two data sources directly through one of the synchronization rules or by combining them. This is also true for the case when it is possible to derive rules R i,k that unambiguously connect each data source D i with sources D i -1 and D i+1 ; D 1 with D 2 and D n ; D n with D n-1 and D 1 , then the data sources can be represented as a biconnected graph (Fig. 3).
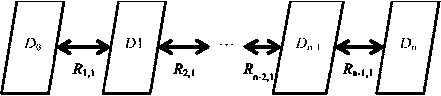
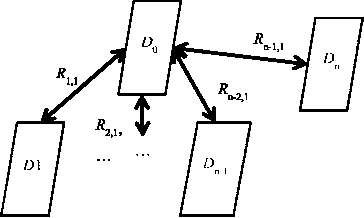
Fig. 2. Visual representation of different variants of data source synchronization rules with unambiguous interpretation
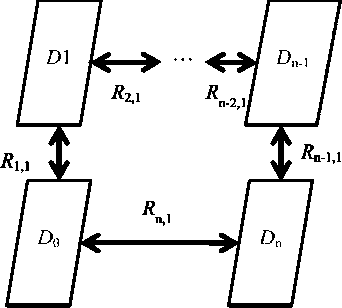
Fig. 3. Visual representation of a variant of data source synchronization rules in the form of biconnected graph
As the number of source synchronization rules increases, graph connectivity will grow up to a fully connected graph. We can create a rule or connection algorithm for any two data sources while the number of interpretations of the heterogeneous data model and its visualization options remains constant if consistency between the rules is maintained (Fig. 4).
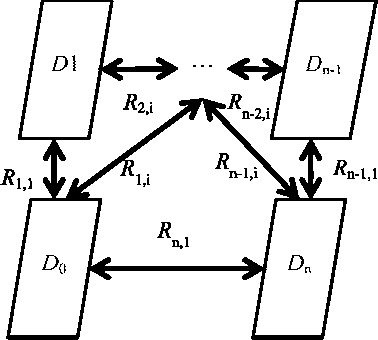
Fig. 4. Visual representation of a variant of data source synchronization rules in the form of a graph with higher level of connectivity
In case of a multidimensional heterogeneous data model that has several variants of synchronization rules for two arbitrary data sources (that is, including rules similar to the example shown in Fig. 1 b ), it will support as many interpretations of the original heterogeneous data as there are different combinations of data synchronization rules described within it.
Therefore, the general approach to the formation a model of multidimensional heterogeneous data G should include methods and algorithms for describing each source of multidimensional data D i , methods and algorithms for generating synchronization rules R i,k , as well as corresponding methods and algorithms for visual representation and analysis of the model as a whole and individual data in this model V ’.
2. Rules and algorithms for synchronizing multidimensional heterogeneous data
Usually, the time scale acts as a common unifying element for data synchronization, and most data unification models are based on the measurement time of quantities. However, binding to the time scale is not the only way to unify data. Some data may not be connected by the measurement time or may have gaps and errors in recording the measurement time. Other data may have connections not only by the time scale, and still other data may not be linked to the time scale at all.
Any quantity can be used as a point or scale for synchronizing data sources as long as we have a way to formulate a rule for comparing that quantity within one data source D i with the same or another quantity within another data source D j .
Any synchronization rule or algorithm can be represented as a complex entity, which includes various algorithms for working with source data layer in the heterogeneous data model.
According to the order of application, these algorithms can be divided into the following categories:
-
1. Preprocessing algorithms
-
1.1. Standardization of formats;
-
1.2. Data cleaning (noise removal, error correction).
-
-
2. Data integration algorithms
-
2.1. Algorithms for combining data from different sources (according to a selected value or measurement scale);
-
2.2. Creation of a single view of the data or a group of all possible views of the data.
-
Based on the created data representations, it is possible to perform numerical data analysis and develop rules for visualizing and interpreting the model of multidimensional heterogeneous data as a whole or its components. Each novel representation is a new data source D n+1 , and data integration algorithms that produce this source can be interpreted as a synchronization rule R n+1,k for that data source D n+1 . It becomes possible to extract new information from the data source D n+1 , since the integration of data can lead to an increase in their connectivity and expansion of the ability to detect and interpret connections, including through the use of various visual models for representing multidimensional heterogeneous data.
Data analysis and interpretation . Once the various data sources have been combined, a number of methods and algorithms can be applied to analyze and interpret the results, such as:
-
• Computer vision and neural network analysis methods for object detection and classification;
-
• Data analysis algorithms to identify hidden patterns and correlations between different layers of data.
Visualization of results . The results of the analysis can be presented in a format that is easy to understand. This can be a visualization that includes:
• Combined visual models of data layers;
• Visual representation of statistics on the information contained in the source data;
• Interactive elements that allow users to interact with data and drill down into specific aspects.
3. A tool for integrating heterogeneous data in the task of combining aerial photography records
Therefore, this approach to combining heterogeneous data from various sources provides us with a more complete and multifaceted picture of the objects under study.
Previously [7], a tool for pooling aerial photography data was developed as an example of a technique for combining heterogeneous data. The method demonstrated rules and algorithms for combining heterogeneous data based on spatial feature. The images were pooled and visualized based on the obtained information about the structural similarity of the images (using key points of the image). A spatial model of geographic coordinates from the original images was also added to the final model.
As a result, the obtained spatial model had a visual representation. It also made it possible to find, based on this representation, the geographic coordinates of any object presented in the original photographs.
Within the framework of the proposed model of multidimensional heterogeneous data, the previously created tool works with only two sources of heterogeneous data D 1 and D 2 , aerial photography data from unmanned aerial vehicles and the coordinates of the unmanned aerial vehicle at the time of shooting. The rule for synchronizing R 1,1 of these data was an algorithm that makes an assumption about the possibility of matching coordinates with the center of corresponding images. This algorithm implies achieving sufficient accuracy of data merging when there are several sufficiently distant from each other shooting points. Aerial photography images, although they represent a three-dimensional scene, can be reduced to two-dimensional arrays of homogeneously normalized data representing colors of pixels in the image. At a large distance from the unmanned aerial vehicle, aerial photographs can be combined using a recurrent algorithm, which assumes that two adjacent images are taken approximately on the same plane with an intersection of at least 50% of the shooting area. Possible perspective distortions in the images are compensated by selecting key points and perspective transformations of images in accordance with the coordinates of these points.
When adding new data to the model, it can be processed in a similar way, if it is possible to compare data by the time it was received and/or geographic location at the time this data was recorded. Therefore, it is quite easy to build a more complex model based on images from the same unmanned aerial vehicle taken in different ranges: optical images can be supplemented by synchronized images in the thermal imaging range (near-infrared range) or by images representing information from depth sensors (distance to objects) in the form of additional layers.
Briefly, the algorithm for adding images of other spectra can be described as follows:
1. Matching by image recording time. Each file contains a creation timestamp, which is generally unique for each file. The same applies to heterogeneous data files obtained from unmanned aerial vehicles (these can be separate images with time and space marks, as well as data combined into a single archive, such as rosbag2 [12]). Interpolation can be used to estimate values between the timestamps, if they do not match exactly (which often happens). In case the time difference between images is small, the estimation of “intermediate” values can be done using simple linear interpolation. In the event where the time difference is large enough or when the data dependency on time is complex, more advanced interpolation methods can be used, such as spline interpolation or time series models (e.g., ARIMA [13]).
2. Search for a match based on the shooting angle of the images and, if necessary, apply a perspective transformation to the new images. In the case of co-directional shooting angles of two closely installed cameras, this transformation can be neglected.
3. Search for a match based on image size (scale) and the difference in perspective distortion between the cameras used.
4. Apply the same perspective transformations to the images in new range as to the images in optical range already added to the model, adjusting for differences in shooting time, angle, and camera characteristics.
4. Approaches to detection and classification of objects in aerial photography images
The process of adding data to an existing model can be visually represented by the functional diagram shown in Fig. 5.
As a result, the aerial photography data model can be expanded by as many data sources D 3 , D 4 , … D n as there are different shooting spectra that can be technically performed. In this case, each new data source adds new information that can participate in further data processing and analysis.
Currently, the superiority of neural network detection and classification of objects over other methods for automating the process of object detection and determining its class is obvious [14]. In turn, for the problems of detection and classification of objects in images, especially in the presence of various noise and distortions, convolutional neural network models are the most promising [15]. They are divided into one-stage and two-stage detectors. Two-stage detectors, the most famous representative model of which is the R-CNN model [16], provide high detection accuracy, but have a low speed of image analysis. This calls into question their use in a tool that involves interactive work with data in real time. Modifications of the Faster R-CNN and Mask R-CNN [17] models were developed to solve the problem of low speed, but their performance is still far from those values that can be considered suitable for solving the problem. Other networks such as LeNet5 [18] show low accuracy in detecting and classifying objects in aerial images, which also does not meet the expectations of an algorithm for detecting objects in aerial images.
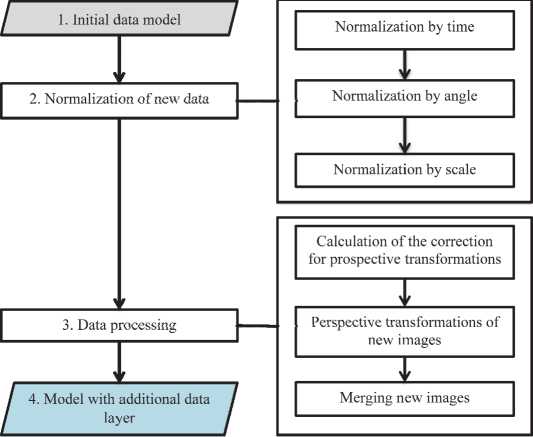
Fig. 5. Visual representation of the functional diagram for adding new data layers to the heterogeneous aerial photography data model
The conducted analysis of various one-stage detectors among models of convolutional neural networks allowed us to conclude that the most suitable for detecting and classifying objects in images are the YOLO class models [19]. One-stage detectors of the YOLO class show high speed of image analysis, while having a high potential for increasing the accuracy of detection and classification of objects when using datasets suitable for training. More modern versions of YOLO have a number of optimizations, so the one of modern versions, YOLOv11 [20], was taken as the basis for detection and classification tool. For each version of YOLO, there are modifications with different numbers of convolutional layers and different computational complexity. Obviously, for real-time or near-real-time work, only those modifications that have a simplified architecture and, consequently, a higher operating speed should be considered. Modifications such as YOLOv11m, YOLOv11l and YOLOv11x were not considered, since processing even one image of 640 × 640 pixels without involving the graphics processor in calculations takes more than 200 ms, and for aerial photography images this value increases several times. More compact modifications such as YOLOv11n and YOLOv11s are more promising in terms of speed.
As a result of the analysis, a modification of the YOLOv11n neural network was selected for implementation in the tool for processing and presenting heterogeneous aerial photography data.
5. Software implementation of algorithms for combining images and matching geographic coordinates with points of the combined image
The previously developed software system implementing the algorithm for combining images, as well as the algorithm for matching geographic coordinates with points of the combined image [7], was supplemented by new functionality that demonstrates the proposed approach to creating and filling the model with data, and the approach itself may not be limited to combining visual data, but has potential for application in other practical areas. The development process used the Python programming language, the openCV computer vision library [21], and the panda3D graphics library [22]. New functionality implemented in the user interface includes switching between layers of 2D aerial data, 3D rendering and automatic object detection. The new functionality was implemented in accordance with the general functional scheme for embedding new data layers into the heterogeneous data model. The existing model includes data in the form of aerial photography images obtained in the optical range (data source D 1 ), their geographic coordinates (data source D 2 ), and serial numbers of images (data source D 3 ). It also contains information on how to combine these images and coordinates by using identified key points on each image (corresponding rules for combining sources R 1 – R 3 ).
Connecting an additional data channel requires adding a new data layer, D 4 , to the model and rules for its normalization based on time ( R 4,1 ), angle and scale ( R 4,2 ) for comparison with existing data within the model ( D 1 – D 3 ) (block 2 of the functional diagram in Fig. 5). It was decided to use bilinear interpolation of images based on time and spatial marks as rules for normalization by time, angle and scale within the software implementation.
After normalization of the new data layer, the same rules that were developed for the first layers (perspective transformation and keypoint merging for images in the optical range, rules for merging sources R 1 – R 3 ) become applicable to them.
Loading multiple image sequences in different ranges and combining them in parallel as layers, each representing a separate range, can be used an unlimited number of times, as long as the images in the new ranges can be matched with the data in the original model. As a result, the model contains both the original images from several shooting ranges, and the rules for their normalization and combination. The final result of combination is also included, and all this information can be used for further analysis.
Figure 6 shows an example of how the display layers of combined images from the optical channel of the shooting and images obtained using the depth sensor can be switched between.
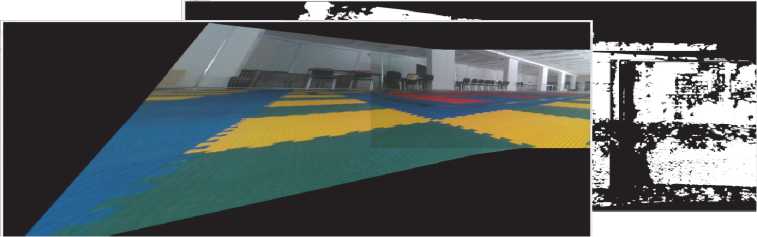
Fig. 6. Switching layers of data obtained in different ranges: an optical range images are on the left side; images obtained using depth sensors are on the right side
Also, a visualization mode for point and two-dimensional data in the form of three-dimensional objects has been added to the software implementation of building a model of multidimensional heterogeneous data. This allows interactive observation and management of aerial photography images matching results. In some cases, this approach is more preferable than working with a large image combined based on the results of perspective transformations. This is because combining flat images tends to accumulate errors and inaccuracies associated with numerical operations. The accuracy of detecting special points of images, and perspective distortions of the cameras used to perform the shooting is also affected. In addition, this type of model representation can be useful in terms of optimizing the rendering of results and ease of navigation.
Fig. 7 shows the operation of function for representing a combined sequence of images in the form of threedimensional planes.
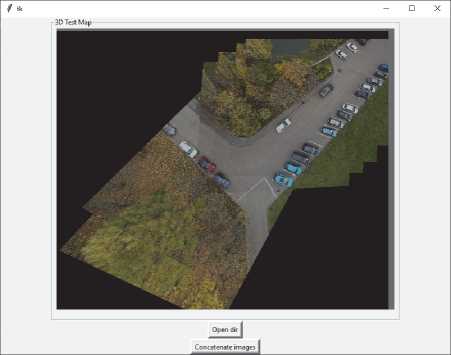
Fig. 7. Three-dimensional representation of a combined sequence of aerial photographs
As an additional tool for analyzing data contained in the model, a classifier based on the YOLOv11n convolutional neural network was trained on the VisDrone dataset [23] with Ultralytics framework [20] based on PyTorch [24]. This dataset contains a wide variety of labeled images of many objects found in aerial photographs. In particular, the dataset allows training the neural network to effectively detect and classify images of cars. This was chosen as an example for integration into aerial photograph processing and analysis tool. The number of epochs equal to 30 was chosen as the training parameter. An example of object detection and classification in a single image using the trained YOLOv11n neural network is shown in Figure 8. An example of object detection and classification on a combined image is shown in Fig. 9.
The metrics of the YOLOv11n model used on the test dataset of 548 images are presented in Tab. 1. The metrics Precision, Recall, mAP50 and mAP50 – 95 were calculated for the parameters of the neural network IoU=0,6 and conf_thres = 0,1. Three different detection options were considered: object detection in individual optical images (RGB), object detection in depth sensor images (DS), and object detection in a fused image where all involved parties are used to detect objects (combined RBG and DS images).
As can be seen from the examples of object detection and classification in aerial photography images, as well as from the metrics presented in tab. 1, the results are accurate enough for automated labeling of images combined within the framework of constructing a multidimensional heterogeneous data model in the case of confidence threshold equals 0,1.
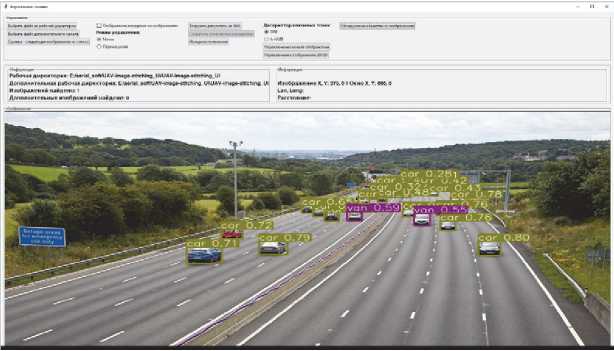
Fig. 8. The result of the trained YOLOv11n classifier on a single image
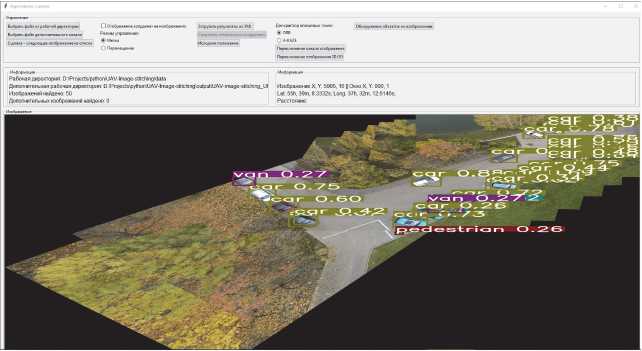
Fig. 9. The result of the trained YOLOv11n classifier on the combined image
Tab. 1. Metrics of the YOLOv11n model on the test dataset
|
Dataset |
Precision |
Recall |
mAP50 |
mAP50-95 |
|
RGB |
0,415 |
0,273 |
0,278 |
0,164 |
|
DS |
0,031 |
0,026 |
0,018 |
0,006 |
|
Combined RBG and IR images |
0,4 |
0,308 |
0,299 |
0,171 |
The results in table 1 also show that the neural network trained on optical images performs poorly in detecting objects in depth images. The detection metrics on the merged images are slightly higher than on individual images, as this approach provides more information about objects that are partially in the frames.
However, there are ways to improve overall quality of neural network model with augmented training dataset and increasing the number of training epochs. These results can be included as an additional data layer in this model, enriching it with new information suitable for further analysis and visualization. This confirms the correctness of the formulated approach to the formation of a multidimensional heterogeneous data model.
Conclusion
In the course of the work, a general approach to creating a storage model and developing tools for representing multidimensional heterogeneous data has been proposed. This approach is based on previously formulated requirements for models of representing multidimensional heterogeneous data. The advantages of data analysis using such model in comparison with working with disparate data have also been considered.
The development of a tool for integrating heterogeneous data is shown in the context of solving the problem of combining aerial photography data obtained using unmanned aerial vehicles, based on the proposed approach.
In particular, an algorithm for supplementing aerial photography data with data obtained in other shooting ranges (thermal imaging cameras and depth sensors) is proposed. The algorithm has been successfully implemented in a tool for combining optical aerial photography data.
An alternative mode for visualizing combined aerial photographs in the format of a sequence of planes in threedimensional space has been applied. This method provides advantages in terms of efficiency of using resources for rendering images and navigation within the space of these images.
The software tool was tested. Performed tests demonstrate the fundamental applicability of the approach to the formation of multidimensional heterogeneous data models and algorithms for combining, analyzing and visualizing data implemented within the framework of the current work.
The proposed approach to the formation of a heterogeneous data model allows for efficient organization of work with different information sources, ensuring high accuracy, relevance, and integrity of data. This is crucial in areas such as ecology, medicine, geodesy and others, where integration and synergy of data are required for deep analysis. In the future, it is planned to expand the computational experiment, including on the basis of flight experiments with several unmanned autonomous aerial vehicles, with subsequent inclusion of ground-based unmanned vehicles in the group.
Acknowledgements
The work was funded by Russian Science Foundation under project # 23-19-00342
.
