
Development and Integration of a Classification Model for Student Programming Anxiety Levels
Journal: International Journal of Intelligent Systems and Applications @ijisa
Article in issue: 4 vol.18, 2026.
Free access
Reducing student anxiety is a critical factor in enhancing academic performance, with timely identification of mental health concerns serving as a key component of effective educational support strategies. This study presents the development and integration of a classification model designed to detect students’ current programming anxiety levels based on academic, demographic, and behavioral attributes. The model was trained and evaluated using student data collected from enrolled in computing-related programs, and its performance was benchmarked against Support Vector Machine, Logistic Regression, Random Forest, J48 Decision Tree, and Naive Bayes classifiers. The Support Vector Machine achieved excellent performance, with an F-measure of 95.97%, an accuracy of 97.11%, precision of 94.20%, recall of 97.86%, and a Cohen’s kappa of 0.937, indicating strong agreement between predicted and actual classifications. Error-based metrics further supported the model’s reliability, with a Mean Absolute Error (MAE) of 0.0289, Root Mean Squared Error (RMSE) of 0.1641, Relative Absolute Error (RAE) of 0.04%, and Root Relative Squared Error (RRSE) of 34.40%. To enhance practical utility, the model was integrated into a web-based student information system that generates real-time classifications and visualizations, supporting educators in recognizing students who may require additional support. While the model provides valuable insights for identifying students exhibiting current programming anxiety, future work incorporating longitudinal data is needed to enable true predictive capabilities for early intervention.
Short address: https://sciup.org/15020644
IDS: 15020644 | DOI: 10.5815/ijisa.2026.04.04
Text of the scientific article Development and Integration of a Classification Model for Student Programming Anxiety Levels
The demand for programming skills has grown significantly across academic disciplines and industries as it is now seen as a fundamental skill in many fields beyond computer education [1, 2]. In response, higher education institutions in Philippines have increasingly integrated and improved programming subjects into diverse curricular offerings like Bachelor of Science in Information Technology (BSIT), Computer Science (BSCS), Information System (BSIS), Entertainment and Multimedia Computing (BSEMC), Library and Information Science (BSLIS) [3, 4], recognizing programming as an essential 21st-century competency. As digital transformation reshapes various sectors, the ability to develop and understand software has become a valued skill not only among aspiring computer programmers but also across business, healthcare, education, and the arts. Consequently, the number of students enrolled in computer-related courses has risen steadily in recent years [5]. However, alongside this rise in demand, there has been growing recognition of anxiety as a significant barrier to student success [6].
In computing education, students often experience anxiety during programming tasks, which can negatively impact their learning outcomes, self-efficacy, and persistence in computing-related courses [7]. This anxiety, referred to as programming anxiety, is characterized by emotional distress, fear of failure, and cognitive overload when confronted with coding tasks [8, 9]. Programming anxiety is distinct from general academic anxiety, test anxiety, or computer anxiety, as it specifically concerns challenges in writing, understanding, and debugging code.
The recently developed and validated Programming Anxiety Scale (PASc) [10] provides a domain-specific tool that measures this form of anxiety. The PASc captures two key dimensions of programming anxiety: (1) Classmates Anxiety, which reflects distress arising from social comparison and fear of negative evaluation by peers (e.g., concern about being ridiculed for not writing correct code), and (2) Self-Confidence, which reflects doubts about one’s own programming skills and fear of failure in coding tasks (e.g., difficulty with algorithms or debugging). These factors together provide a nuanced view of the emotional and cognitive challenges unique to programming tasks.
Although PASc offers a standardized and psychometrically sound way to measure programming anxiety, traditional administration relies on manual or survey-based collection, which can be time-consuming, susceptible to self-report bias, and difficult to integrate for large-scale or continuous monitoring. Manual screening provides valuable baseline data, but it requires repeated administration to track students over time and depends on active student participation.
In contrast, this study explores how machine learning classification models can complement these methods by automatically categorizing students’ programming anxiety levels using existing demographic, academic, and behavioral data. This approach offers a scalable and efficient way to support timely identification of students who may need help — without replacing surveys like the PASc but enhancing institutional capacity to monitor programming anxiety at scale.
Given these challenges and opportunities, this study applied the Cross Industry Standard for Machine Learning (CRISP-ML) methodology to guide the development and evaluation of a classification model for detecting students’ current programming anxiety levels. It implemented five classification algorithms: J48 Decision Tree, Random Forest, Support Vector Machine, Logistic Regression, and Naive Bayes. The performance of each model was evaluated using a comprehensive set of validation metrics, including F-measure, accuracy, precision, recall, and Cohen’s kappa, along with error-based measures such as Mean Absolute Error (MAE), Root Mean Squared Error (RMSE), Relative Absolute Error (RAE), and Root Relative Squared Error (RRSE). The best-performing model was then integrated into a developed web-based student information system for computer studies, enabling automated classification and monitoring of students’ programming anxiety levels within the system.
The major contribution of this study lies in demonstrating how machine learning classification models can be effectively applied to detect programming anxiety — a domain-specific form of anxiety distinct from general academic or computer anxiety — using real-world student demographic, academic, and behavioral data. Specifically, this study:
-
• Apply machine learning to classify programming anxiety levels without relying solely on direct self-reported surveys, offering a novel approach that complements traditional screening tools.
-
• Integrates machine learning outputs with the established Programming Anxiety Scale (PASc), enhancing the
scalability and timeliness of anxiety detection in educational contexts.
• Conducts a rigorous comparative evaluation of five classification algorithms (J48 Decision Tree, Random Forest, Support Vector Machine, Logistic Regression, and Naive Bayes) in this specific domain.
• Implements the best-performing model within a web-based student information system, enabling automated, real-time classification and monitoring of programming anxiety to support timely educational interventions.
• Provides a methodological framework for future research that bridges affective computing, educational data mining, and computing education, offering guidance for detecting domain-specific emotional and cognitive challenges using machine learning.
2. Literature Review2.1. Classification Model for Anxiety-related Using Machine Learning Algorithms
This paper is structured as follows: Section 2 presents related work on programming anxiety and machine learning applications in education. Section 3 outlines the methodology, including data understanding, preprocessing, feature selection, and model development. Section 4 reports the results and comparative performance of the classification models. Section 5 presents the conclusion, highlighting key findings and implications, while Section 6 outlines practical recommendations and directions for future research.
Many researchers have worked on using supervised machine learning algorithms for anxiety-related in various contexts for the collection and subsequent classification of data from various data sources.
Kumar et al. [11] investigated the performance of eight different machine learning algorithms using the Depression Anxiety and Stress Scale datasets (both the 42-item and 21-item versions). Utilizing the Waikato Environment for Knowledge Analysis (WEKA) software, they classified the disorders into five severity levels: normal, mild, moderate, severe, and extremely severe. Their analysis indicated that the radial basis function network yielded the best results for predicting depression, while the RFT algorithm achieved perfect accuracy in predicting anxiety within the 21 -item dataset. Their study demonstrated the feasibility of using machine learning for fine-grained classification of psychological disorders.
Sau and Bhakta [12] extended this line of inquiry by collecting comprehensive data from 470 seafarers, including socio-demographic variables, occupational roles, and health indicators. Using sixteen features such as age, academic qualifications, monthly income, body mass index, marital status, and chronic health conditions, they applied multiple classification algorithms. Among these, the CatBoost algorithm achieved the highest performance, with an accuracy of 82.6 percent and a precision of 84.1 percent. Their study underscores the importance of using a diverse set of contextual features in anxiety prediction, which has implications for modeling anxiety in educational contexts.
In a subsequent study, the same authors [13] applied additional machine learning models to data from 630 elderly individuals, 520 of whom were receiving special care. By applying model optimization techniques such as sequential random optimization and random subspace methods, they found that the RFT algorithm again performed most effectively, with an accuracy of 91 percent and precision of 89 percent. Although the target population differs, their study demonstrates methodological rigor and emphasizes model tuning strategies relevant to the present study.
Priya et al. [14] examined the classification of anxiety, depression, and stress using data collected through the DASS-21 questionnaire. Their participant pool consisted of 348 individuals across a wide range of ages and employment statuses. The study evaluated five machine learning algorithms and addressed class imbalance by selecting the best model based on the F1 score. The RFT algorithm demonstrated superior performance. Their study provides a useful example of how to address class imbalance in psychological datasets, a concern that is also pertinent to academic data where fewer students may report high levels of anxiety.
Elhai et al. [15] conducted a study during the early months of the COVID-19 pandemic, collecting survey responses from 908 adults in Eastern China. The data included responses to several psychological assessments, including the Generalized Anxiety Disorder-7 (GAD-7) questionnaire, the DASS-21, and the Ruminative Responses Scale. Using six machine learning algorithms, including Lasso Regression, Ridge Regression, Elastic Net, SVM , Extreme Gradient Boosting (EGB), and RFT, the authors identified key predictors of anxiety, such as stress, rumination, age, perceived threat of death, and media exposure. The Lasso and Elastic Net models performed best. Their study illustrates the value of incorporating context-specific predictors in anxiety modeling, which is directly relevant to understanding factors contributing to programming anxiety.
Albagmi et al. [16] developed machine learning models to classify anxiety levels based on survey data collected during the COVID-19 pandemic in Saudi Arabia. The survey included items from the GAD-7 questionnaire and questions aimed at identifying influential factors. The WEKA software was used to apply support vector machine and J48 decision tree classifiers. Feature selection was conducted using the Correlation Attribute Evaluation method, which identified the ten most predictive features out of twenty. The SVM model achieved perfect classification performance. Their study highlights the importance of careful feature selection and algorithm tuning for effective anxiety prediction.
Farooq et al. [17] explored the classification of anxiety using a relatively small dataset comprising responses from 108 individuals. The study employed fourteen machine learning algorithms, including NB, LR, RF, Gradient Boosting, and SVM, using the PyCaret library in Python. Despite limitations in sample size and dataset complexity, the NB model achieved high accuracy, ranging from 0.90 to 1.00 on testing data. Their study emphasized the need to evaluate multiple performance metrics, including recall and Cohen’s kappa, rather than relying solely on accuracy. Their comprehensive evaluation approach is consistent with the current study’s emphasis on using diverse metrics to assess model performance.
-
2.2. Classification Model of Anxiety in Educational Context
-
2.3. Classification Model for Mental Health Related Issues in Philippine Educational Context
Mutalib [18] adapted the Cross-Industry Standard Process for Data Mining (CRISP-DM) methodology to classify students into different categories of mental health problems, including stress, depression, and anxiety, using machine learning algorithms. The adapted process included problems and data understanding, modeling, and model evaluation. The authors collected data from 629 respondents at a higher education institution in Terengganu using two instruments: the DASS-21 and the World Health Organization Quality of Life survey (40 items). Data preprocessing was conducted to map the target variables, namely stress, depression, and anxiety, into multiple severity levels such as normal, mild, moderate, severe, and extremely severe. Using the Statistical Package for the Social Sciences Modeler, the authors applied five machine learning algorithms: DT, Neural Network (NN), SVM, NB, and LR. These algorithms were subjected to multiple experimental iterations in the modeling phase. Lack of social support, financial difficulty, and learning environment were identified as the most prominent factors affecting mental health outcomes. The DT model achieved the highest accuracy for predicting stress, while the SVM model performed best for depression. For anxiety classification, LR and NN models produced fair results with accuracy ranging between 68 and 88 percent. Their study demonstrates how a structured data mining methodology can be effectively applied to predict mental health conditions, which relates to the current study’s goal of predicting programming-specific anxiety among students using a similar methodological framework.
Nemesure et al. [19], conducted a study to predict Generalized Anxiety Disorder and Major Depressive Disorder among undergraduate students using data mining techniques. The authors utilized 59 biomedical and demographic features derived from a general health survey and employed six classification algorithms: EGB, RFT, SVM, K-nearest Neighbors (KNN), and a NN. A five-fold cross-validation method was implemented to train the models. Additionally, Shapley additive explanations were used to interpret and visualize the influence of individual features on predictions. The models were evaluated using the Area Under the Receiver Operating Characteristic Curve metric. The results showed that for Generalized Anxiety Disorder, the model achieved an area under the curve of 0.73 with a sensitivity of 0.66 and specificity of 0.70. For Major Depressive Disorder, the area under the curve was 0.67, with a sensitivity of 0.55 and specificity of 0.70. Their study concluded that ensemble models were able to predict diagnoses of anxiety and depression above chance levels with moderate effectiveness. This aligns with the present study’s objective to use classification models for identifying students experiencing elevated anxiety, though with a more specific focus on anxiety related to programming contexts.
Qasrawi et al. [20] applied machine learning techniques to predict the risk factors associated with depression and anxiety among school-aged children. Their study identified school violence and bullying, home violence, academic performance, and family income as the most influential predictors. After securing ethical approval, the authors collected data using the Health Behaviors Schoolchildren Questionnaire from students in grades five through nine, aged between 10 and 15 years, studying in public and refugee schools across the West Bank. The results showed that SVM and RFT models were the most effective for predicting both depression and anxiety. For depression classification, the SVM model achieved an accuracy of 92.5 percent, while the RFT model reached 76.4 percent. For anxiety, SVM achieved 92.4 percent accuracy, and RFT achieved 78.6 percent. Their study underscores the ability of classification algorithms to effectively detect anxiety symptoms in educational populations, which supports the methodology of the current research in using machine learning models to predict specific types of anxiety, including those encountered in academic disciplines such as computer programming.
Vergaray et al. [21] conducted a systematic review of 29 peer-reviewed articles published between 2019 and 2023 across seven academic databases, including ScienceDirect, IEEE Xplore, the Association for Computing Machinery Digital Library, Scopus, Springer Link, InderScience, and Wiley. The authors adopted the Preferred Reporting Items for Systematic Reviews and Meta-Analyses methodology to analyze the methodologies, features, algorithms, and tools used in applying machine learning to the prediction of anxiety and stress among college students. Their study found that most researchers employed a customized methodological approach, while others used the Cross-Industry Standard Process for Data Mining. Fifteen features were frequently used across the studies, with age and gender emerging as the most significant predictors. SVM and LR were identified as the most effective classification algorithms, while Python was the predominant programming language for model development. Accuracy and precision were the most frequently used metrics for model evaluation. Their study offers a broad overview of techniques that are relevant for understanding how specific attributes influence anxiety prediction in educational settings, thereby informing the feature selection and model design used in the current study focused on programming anxiety.
Geronimo et al. [22] investigated perceived academic stress among students in higher education institutions during the COVID-19 pandemic, with a focus on identifying predominant stressors. The study utilized the Perceived Academic Stress scale and found that examination difficulty, excessive academic workload, unrealistic expectations from
Filippino teachers, and limited time were the primary factors contributing to elevated stress levels. The authors applied several machine-learning algorithms, including SVM, DT, and NB, to classify students based on their stress levels. Among these models, SVM yielded the highest classification accuracy at 95 percent. The findings indicated that a significant portion of students were experiencing high to very high levels of stress, particularly in the context of remote learning environments. Their work contributes to understanding how academic-related stress can be effectively predicted using machine learning techniques, which is directly relevant to the current study’s objective of predicting a more specific academic stressor: programming-related anxiety.
Mendoza et al. [23] examined the mental health and well-being of Filipino students and teachers during the COVID-19 pandemic. Their study revealed that more than 22 percent of students and 13 percent of teachers met the clinical criteria for depression, while 13.91 percent of students and 15.92 percent of teachers were identified as experiencing anxiety. The authors employed a combination of traditional statistical methods and machine learning approaches to analyze the data. Their analysis identified stress, anxiety, and fear of COVID-19 as the most significant contributors to mental health difficulties, while family support emerged as the strongest predictor of psychological wellbeing. By emphasizing the role of socio-contextual factors such as familial support in building resilience, the study highlights how non-academic variables can significantly influence mental health outcomes. This insight is relevant to the present study, as it suggests that individual and environmental factors beyond academic performance may influence programming anxiety among students.
2.4. Bridging the Gap in Classification Modeling of Programming Anxiety Using Supervised Machine Learning
3. Methodology3.1. Cross Industry Standard Process for Machine Learning (CRISP-ML)
Recent research has underscored the efficacy of supervised machine learning techniques in classification of general anxiety and various other mental health conditions across diverse settings. A broad range of classification algorithms, such as DT, LR, SVM, and Ensemble Methods, have been utilized in conjunction with feature selection strategies to enhance predictive accuracy and model performance. These models are commonly evaluated through robust validation techniques, including cross-validation and percentage-split testing, to ensure reliability and generalizability of the results. Despite the growing application of machine learning in mental health prediction, there remains a notable absence of studies specifically addressing programming anxiety through these methodologies. This gap is particularly significant given the foundational role of programming in computing education. Within the Philippine educational landscape, where the use of machine learning in academic analytics is becoming increasingly prominent, the predictive modeling of programming anxiety represents a critical and underexplored research direction. This study aimed to address this gap by developing and evaluating supervised machine learning models designed at classifying programming anxiety levels, thereby contributing to the expanding body of literature at the intersection of educational data science and student mental health.
This study used developmental research to analyze and describe the process of building [24, 25] a classification model with machine learning techniques, following the adapted Cross Industry Standard for Machine Learning (CRISP-ML) methodology, and evaluating the final product. The process was anchored in the supervised machine learning approach, as the target class was used to train, validate, and evaluate the five classification algorithms.
The CRISP-ML framework, a foundational subset of the extended CRISP-ML(Q) methodology, offers a structured approach for developing predictive models aimed at forecasting potential outcomes [26]. In the present study, a modified version of the methodology was employed, excluding the “(Q)” phase, which focuses on quality assurance, monitoring, and maintenance. These activities are typically part of a longer-term, post-deployment process and were therefore deemed beyond the scope of this investigation. The principal phases implemented in this study were as follows:
-
A. Data Understanding
A dataset consisting of 1,732 instances was provided by the Computer Studies Department of a public-type local university in the Philippines, covering the first semester of the 2023–2024 academic year. The data were gathered by the department over an estimated period of 4 to 6 weeks, accounting for survey distribution across classes, collection of responses, and follow-ups for non-respondents. The dataset was based on responses collected through a survey instrument administered by the department, which combined two components:
-
• A validated Programming Anxiety Scale (PAS) adapted from existing literature to assess students’ selfreported programming anxiety levels.
-
• A structured questionnaire designed to capture data on academic performance, demographic profile, learning style preferences, and socioeconomic background.
While the original PAS generated scores ranging from 11 to 55, the actual numerical scores were not provided for security and privacy reasons. Instead, the Computer Studies Department aggregated these scores internally and released only the corresponding categories:
-
• Low programming anxiety (scores 11–33): 606 instances
-
• High programming anxiety (scores 34–55): 1,126 instances
This categorical Programming Anxiety Score (PAS) served as the target variable for model development. The dataset included 19 raw attributes, as summarized in Table 1. These covered variables such as gender, age, working student status, parent education level, family monthly income, number of siblings, course, current year level, previous semester GPA, Computer Programming 1 and 2 final grade remarks, senior high school track/strand, ICT equipment ownership, primary source of internet connection, preferred VARK learning style, average study hours per week, average sleep hours per night, and relationship status.
Data exploration was performed to understand variable distributions, identify outliers, detect missing values, and analyze relationships among attributes. This deep understanding of the dataset informed subsequent stages of feature engineering, selection, and predictive model development. The size and variety of the data contributed to the robustness and potential generalizability of the resulting machine learning models.
Table 1. Raw attributes and value format provided by the computer studies department
|
Attribute |
Description |
Value Format |
|
Gender |
Indicates the student’s gender. |
(Male/Female) |
|
Age |
The student’s age in years. |
Numerical |
|
WorkingStudent |
Indicates whether the student is employed while studying. |
(Yes/No) |
|
ParentHasHigherEducLevel |
Indicates if the student’s parent has attained higher education (college level or above). |
(Yes/No) |
|
Has18kOrAboveFamilyMonthlyIncomeAverage |
Indicates if the student’s family has an average monthly income of 18,000 pesos or above. |
(Yes/No) |
|
NumberOfSiblings |
The total number of the student’s siblings. |
Numerical |
|
Course |
The program or degree the student is enrolled in. |
(BSIT, BSIS, BSCS, BSEMC) |
|
CurrentYearLevel |
The student’s current year level in college. |
Numerical |
|
PrevSemGPA |
The remark corresponds to the student’s Grade Point Average (GPA) from the previous semester. |
(Above Average Average, Below Average) |
|
ComProg1Grade |
The remark corresponds to the student’s final grade in Computer Programming 2. |
(Above Average Average, Below Average) |
|
ComProg2Grade |
Student’s final grade remark in computer programming 2 |
(Above Average Average, Below Average) |
|
IsSHICTorSTEM |
Indicates if the student’s senior high school track was ICT or STEM. |
(Yes/No) |
|
HasMultipleICTEquip |
Indicates whether the student owns multiple ICT-related devices (e.g., laptop, desktop, tablet). |
(Yes/No) |
|
IsMobileDataPrimary |
Indicates if mobile data is the student’s primary source of internet connection. |
(Yes/No) |
|
IsMultiModal |
Indicates if the student’s preferred VARK learning style is multimodal. |
(Yes/No) |
|
Has10OrAboveStudyHoursAverage |
Indicates if the student studies for 10 hours or more on average per week. |
(Yes/No) |
|
Has6HrsOrAboveSleepAverage |
Indicates if the student sleeps for 6 hours or more on average per night. |
(Yes/No) |
|
HasRomanticRel |
Indicates if the student is currently in a romantic relationship. |
(Yes/No) |
|
PAS2LEVEL |
The student’s programming anxiety level based on their Programming Anxiety Score. |
(High/Low) |
-
B. Data Preparation and Feature Selection
The initial step in the analysis involved loading the dataset file into a pandas Data Frame. After confirming the dataset had no missing value, categorical features were identified and encoded using one-hot encoding to prepare the data for analysis.
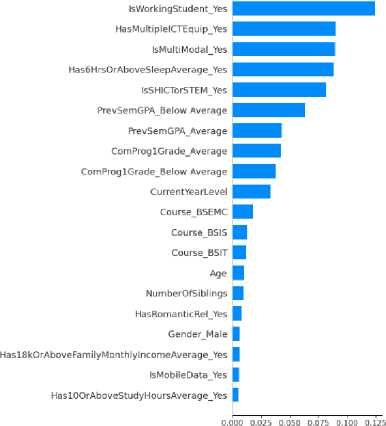
To identify the significant attributes for classifying student programming anxiety level, a comprehensive feature importance analysis was conducted using two complementary techniques: traditional correlation analysis and SHAP (SHapley Additive exPlanations). This process aimed to understand both the linear relationships between features and the target variable, as well as the contribution of each feature to the predictions of a trained machine learning model. The insights gained from these analyses guided the selection of significant features for subsequent modeling efforts, focusing on attributes that demonstrated a notable impact on the PAS2LEVEL outcome.
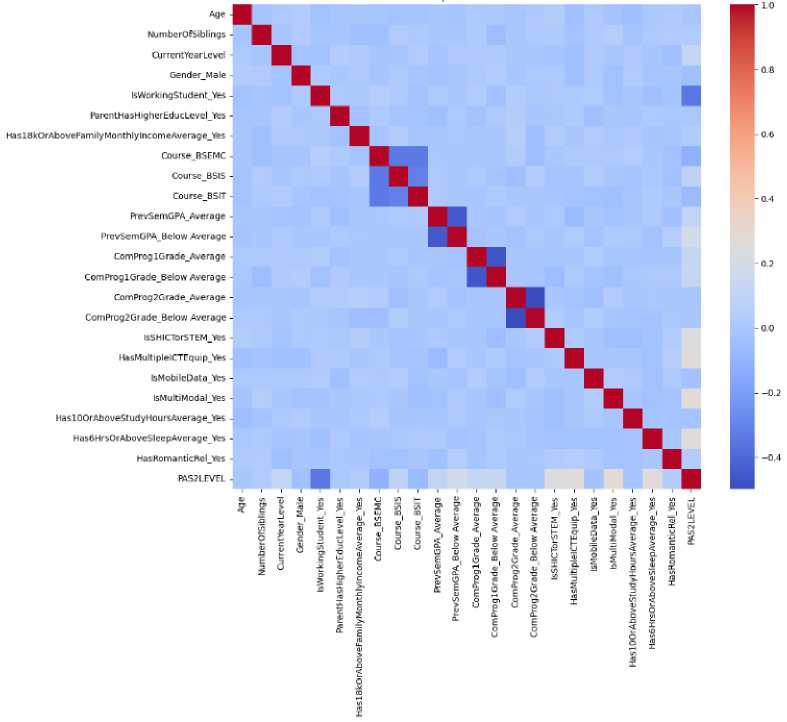
Fig.1. Correlation heat map of all features
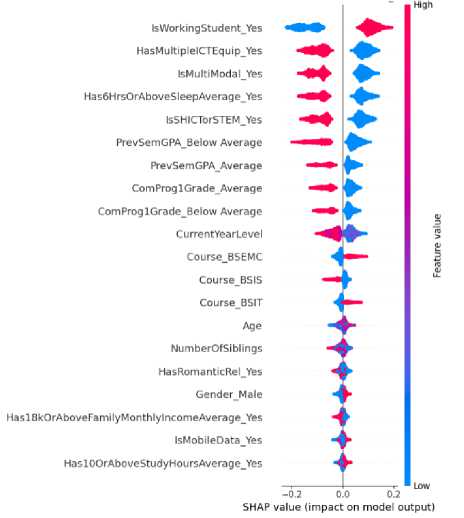
Fig.2. SHAP beeswarm plot for programming anxiety level classification
As shown in Figure 1, the correlation heatmap visually represents the linear relationships between all pairs of features in the dataset, including the target variable “PAS2LEVEL” (where 1 represents high, and 0 represents low). The color intensity and direction indicate the strength and type (positive or negative) of the correlation coefficient, ranging from -1 (perfect negative correlation) to 1 (perfect positive correlation), with 0 indicating no linear correlation. The diagonal line shows a perfect positive correlation of 1, as each feature is perfectly correlated with itself. By examining the correlations of other features with “PAS2LEVEL”, we can identify which features have the strongest linear associations with the likelihood of a student having a high PAS2LEVEL. The heatmap also helps in identifying potential multicollinearity among features by showing strong correlations between independent variables.
As shown in Figure 2, the SHAP beeswarm plot illustrates the distribution of SHAP values for each feature across all instances, providing insight into how each feature impacts the model’s prediction of “PAS2LEVEL”. Each dot represents a single instance from the dataset, with its position on the x-axis indicating the SHAP value (the impact on the prediction). The color of the dot represents the feature value (e.g., red for high values, blue for low values). Features are ordered vertically by their overall importance, with the most impactful features at the top. This plot allows us to see not only which features are important but also how the different values of a feature influence the prediction – for example, whether high values of a feature consistently lead to positive or negative SHAP values towards predicting “PAS2LEVEL”.
mean(|SHAP value|) (average impact on model output magnitude}
Fig.3. Average absolute SHAP values for programming anxiety level classification
As shown in Figure 3, the SHAP bar plot provides an aggregated view of feature importance by showing the average absolute SHAP value for each feature. This plot ranks features in descending order of their mean absolute SHAP values, making it easy to identify the features that have the largest average impact on the magnitude of the model's output for “PAS2LEVEL”. Features at the top of this plot are considered the most important drivers of the prediction. While the beeswarm plot shows the distribution and direction of impact for individual instances, the bar plot offers a concise summary of the overall feature importance across the entire dataset for predicting “PAS2LEVEL”.
Based on the insights from both the correlation heatmap and the SHAP analysis (specifically looking at the mean absolute SHAP values for “PAS2LEVEL” predictions), the significant attributes we identified are those that showed notable linear relationships (correlation) and strong influence on the model's predictions (SHAP).
These significant attributes are:
-
• IsWorkingStudent: Showed a strong correlation and high SHAP importance.
-
• PrevSemGPA: Different GPA levels were strongly correlated and highly important in SHAP.
-
• ComProg1Grade: Various ComProg1Grade levels also exhibited notable correlation and SHAP importance.
-
• IsSHICTorSTEM: This background type was indicated as important by both methods.
-
• HasMultipleICTEquip: Having multiple ICT equipment showed relevance in both analyses.
-
• IsMultiModal (PreferredLearnStyle): Multimodal learning style also appeared as a significant factor.
-
• Has6HrsOrAboveSleepAverage (AvgSleepHours): Sufficient sleep was identified as influential in both.
-
• CurrentYearLevel: Showed some correlation and SHAP importance.
These attributes are considered significant because they were consistently highlighted as important drivers of the PAS2LEVEL outcome by two different feature importance methodologies.
-
C. Model Engineering
In this phase, an experimental procedure was conducted to evaluate the performance of five commonly used classification algorithms: Logistic Regression, Naive Bayes, Support Vector Machine, Random Forest, and Decision Tree. These algorithms were implemented and tested using Google Colab, a cloud-based interactive development environment that enabled writing and executing Python code. This environment provided access to computational resources and integrated seamlessly with widely used data science libraries. The machine learning models were developed using Python, leveraging libraries such as scikit-learn, pandas, and NumPy. This computational framework facilitated rapid experimentation and iterative model development. Within this environment, data loading, algorithm configuration, and prediction simulations were efficiently performed. This methodological approach was designed to evaluate the capability of these models in classifying students’ programming anxiety level based on the selected features.
-
D. Model Evaluation
The performance of the trained models was rigorously assessed using Stratified 10-Fold Cross-Validation. This robust technique involved splitting the dataset into 10 distinct folds, where each fold served as a validation set exactly once, while the remaining nine folds were used for training. The “Stratified” aspect ensured that the proportion of the target variable (PAS2LEVEL) was maintained within each fold, addressing potential class imbalance and providing a more reliable evaluation. Within each training fold, the SMOTE (Synthetic Minority Over-sampling Technique) method was applied to the data to address class imbalances before training the model [27].
Within each fold, the trained model’s performance was evaluated using a comprehensive set of metrics [28]:
-
• Accuracy: The overall proportion of correctly classified instances.
-
• F1-score: The harmonic average of Precision and Recall, providing a balanced measure of the model’s
accuracy, particularly useful in the presence of class imbalance.
-
• Precision: The ability of the model to correctly identify positive instances (True Positives) out of all instances predicted as positive.
-
• Recall: The ability of the model to find all the actual positive instances (True Positives) out of all actual positive instances.
-
• Cohen’s Kappa: A metric that measures the agreement between the model’s predictions and the actual labels, accounting for the possibility of chance agreement.
Furthermore, an error analysis was conducted using the following metrics computed for each fold:
-
• Mean Absolute Error (MAE): The average magnitude of the errors in a set of predictions, without considering their direction.
-
• Root Mean Squared Error (RMSE): The square root of the average of the squared errors, giving a higher weight to larger errors.
-
• Relative Absolute Error (RAE): The total absolute error normalized by the total absolute error of a simple predictor that always predicts the average.
-
• Root Relative Squared Error (RRSE): The total squared error normalized by the total squared error of a simple predictor that always predicts the average.
By averaging these metrics across all 10 folds, we obtained a more stable and reliable estimate of each model’s performance and its generalization ability on unseen data.
E. Model Deployment
4. Results and Discussion4.1. Comparative Performance of Student Programming Anxiety Level Classifiers
After the evaluation of various machine learning algorithms, the best-performing model was selected based on its ability to predict students’ programming anxiety levels. The trained model was then serialized and saved in a pickle file format (pkl), facilitating its storage and future retrieval.
For deployment, the prediction model was integrated into a web-service platform using Django and Django Representational State Transfer Application Programming Interface (REST) Framework. The deployment process involved configuring the server environment on a web hosting platform that supports Python, ensuring compatibility with the necessary libraries and dependencies. The model’s inference functionality was encapsulated within a Django application, and a RESTful Application Programming Interface (API) was developed using Django REST Framework to allow seamless communication between the model and the front-end interface. This API enables the efficient handling of requests for predictions based on user input.
The web hosting environment was then optimized to handle multiple requests simultaneously, providing quick and reliable real-time predictions of students’ programming anxiety levels. The system was designed with performance in mind, ensuring low latency and high availability. Security protocols, including data encryption, were implemented to safeguard sensitive student information during transmission. Additionally, the system was designed for ease of maintenance, allowing for model updates and retraining to be carried out as needed. By embedding the prediction model into the Django REST API, the system provides educators with timely insights into students’ anxiety levels, facilitating early intervention and personalized support for students experiencing programming-related anxiety.
The following sections present the findings of the study, including the evaluation results of five classification algorithms, the performance of the best model for classifying students’ programming anxiety levels, and its integration into a web-based system.
The findings from Table 3 revealed that the Support Vector Machine (SVM) demonstrated the best overall performance among the evaluated models. SVM achieved an F-measure of 95.97%, an accuracy of 97.11%, a precision of 94.20%, a recall of 97.86%, and a Cohen’s kappa of 0.937, indicating strong agreement between predicted and actual classifications. Logistic Regression followed closely, with an accuracy of 96.48%, an F-measure of 95.21%, a precision of 91.32%, a recall of 99.51%, and a Cohen’s kappa of 0.924. In contrast, Random Forest, J48 Decision Tree, and Naive Bayes produced comparatively lower classification performance, with accuracy rates of 90.99%, 87.87%, and 86.14%, respectively.
Table 2. Performance results of classification algorithms using various metrics
|
Algorithm |
F-measure (%) |
Accuracy (%) |
Precision (%) |
Recall (%) |
Cohen’s Kappa |
|
Support Vector Machine |
95.97 |
97.11 |
94.20 |
97.86 |
0.937 |
|
Logistic Regression |
95.21 |
96.48 |
91.32 |
99.51 |
0.924 |
|
Random Forest |
86.82 |
90.99 |
88.37 |
85.83 |
0.800 |
|
J48 Decision Tree |
82.90 |
87.87 |
81.60 |
84.48 |
0.735 |
|
Naive Bayes |
81.28 |
86.14 |
77.29 |
86.16 |
0.703 |
Further analysis of the error metrics, as shown in Table 3, reinforces the performance trends observed among the models. Support Vector Machine demonstrated the most consistent and accurate classifications, with the lowest error rates: MAE of 0.0289, RMSE of 0.1641, RAE of 0.04%, and RRSE of 34.40%. These results indicated minimal deviation and variance, confirming the model’s robustness in reducing prediction errors. LR followed closely, also exhibiting low error values and reliable performance. In contrast, RF, DT, and NB showed higher RMSE and RRSE values, suggesting greater variability and less stability in their predictive outcomes.
Table 3. Error analysis results of classification algorithms
|
Algorithm |
MAE |
RMSE |
RAE |
RRSE |
|
Support Vector Machine |
0.0289 |
0.1641 |
0.04% |
34.40% |
|
Logistic Regression |
0.0352 |
0.184 |
0.04% |
38.59% |
|
Random Forest |
0.0901 |
0.2985 |
0.11% |
62.58% |
|
J48 Decision Tree |
0.1213 |
0.3474 |
0.15% |
72.84% |
|
Naive Bayes |
0.1386 |
0.3707 |
0.18% |
77.73% |
While the model demonstrates strong overall performance, it is important to consider the real-world implications of misclassifications, particularly False Positives and False Negatives.
-
• False Positives (FP): Occur when the model predicts a student has high programming anxiety (Positive class) when they actually have low programming anxiety (Negative class).
Consequence: Identifying a student as "at-risk" when they are not. This could lead to unnecessary interventions, potentially causing the student undue stress, labeling, or diverting limited resources away from students who truly need support.
-
• False Negatives (FN): Occur when the model predicts a student has low programming anxiety (Negative class) when they actually have high programming anxiety (Positive class).
-
4.2. Best Model for Student Programming Anxiety Classification
Consequence: Failing to identify a student who is actually struggling with high programming anxiety. This means a student who could benefit from support might not receive it, potentially leading to continued difficulties, decreased performance, or even dropping out of the course or program.
In the context of supporting students, False Negatives are often considered more critical than False Positives. Missing an at-risk student (FN) can have more severe negative impacts on that individual’s academic journey than providing unnecessary support to a student who doesn’t strictly need it (FP). Therefore, minimizing False Negatives is often a key priority in models used for identifying individuals who need help.
To mitigate these risks, we recommend deploying the classification model in tandem with ongoing screening practices, such as regular administration of the PASc tool, academic performance monitoring, or instructor referrals. Additionally, integrating the model into an LMS can allow for automatic detection of behavioral indicators (e.g., assignment non-submission, reduced participation), which can trigger manual review even if the model initially predicted low anxiety. This hybrid approach ensures that the system remains sensitive to misclassifications while maximizing the benefits of automated detection, thereby supporting more equitable and responsive academic interventions.
The SVM algorithm, identified as the best-performing model, is further evaluated through the confusion matrix heatmap. This visualization highlights the frequency of correct and incorrect classifications, offering insights into the model’s accuracy, discriminatory power, and potential misclassifications. Such analysis is vital for assessing the model’s practical utility in accurately identifying students at risk of high programming anxiety and supporting timely interventions.
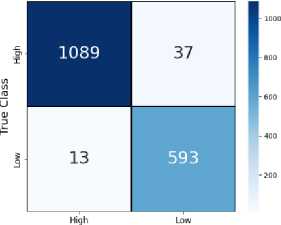
Predicted Class
Fig.4. Confusion matrix heatmap of best classification model
Figure 4 illustrates the confusion matrix of the SVM model, summarizing its classification performance across all folds. The model correctly identified 1,089 students with low programming anxiety (true negatives) and 593 students with high programming anxiety (true positives). It misclassified 37 students with low anxiety as high anxiety (false positives) and 13 students with high anxiety as low anxiety (false negatives). These results indicate that the SVM model achieved strong discriminatory power, with a notably low rate of misclassification, particularly in detecting students at risk of high programming anxiety.
To ensure that the SVM model’s predictions are equitable across key demographic groups, we conducted a fairness assessment by analyzing performance metrics for age and gender subgroups. The SVM model achieved consistently high accuracy across both age and gender subgroups. The results of the 10-fold cross-validation fairness assessment are summarized in Table 4.
Table 4. Fairness assessment results of the support vector machine by age and gender subgroups
|
Subgroup |
Average Accuracy (%) |
FP Rate (%) |
FN Rate (%) |
|
Age 18–24 |
97.13 |
3.31 |
2.05 |
|
Age 25–34 |
97.03 |
3.02 |
2.92 |
|
Female |
96.95 |
3.55 |
2.12 |
|
Male |
97.21 |
3.03 |
2.21 |
The minimal differences observed in error rates and accuracy between subgroups indicate that the SVM model does not favor or disadvantage any particular demographic. This suggests that the model can be deployed without introducing substantial bias related to age or gender.
-
4.3. Integration of Best Classification Model to a Web-based System
The development of the web-based student information system followed the Spiral Model, resulting in a modular suite of interoperable services. A key innovation is the integration of a classification-powered microservice within the Student Management module, enabling real-time prediction of students’ programming anxiety levels. To assess the system’s quality, 20 experts evaluated it using the ISO/IEC 25010 Software Product Quality Model [29]. The panel, composed of administrators, IT professionals, faculty members, and mental health practitioners, gave consistently high ratings across all eight quality attributes. Analysis of variance (ANOVA) results (p = 0.942) confirmed no significant differences in evaluations, indicating consensus on the system’s effectiveness.
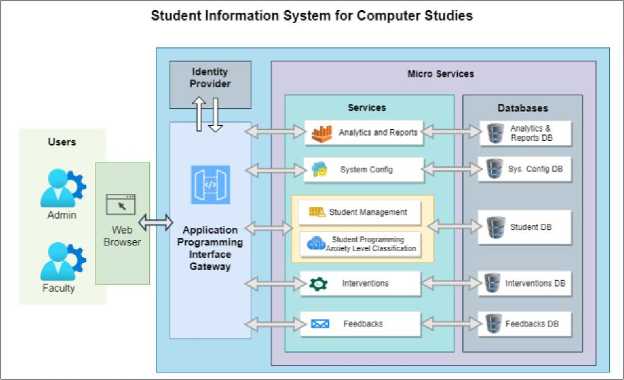
Fig.5. High level microservices architecture of student information system for computer studies
Figure 5 depicts the architectural design of the Student Information System for Computer Studies, built using a microservices architecture. This approach divides the system into modular services, each handling distinct functionalities like Student Management, Interventions, and Analytics. Users interact via a web browser, with requests routed through an API Gateway, which also validates security tokens issued by an integrated Identity Provider. A key feature is the service within the Student Management module, which uses a classification model to automatically detect current programming anxiety level of a student. Each microservice has its own database, ensuring data isolation, easier maintenance, and scalable deployment across institutional infrastructures .
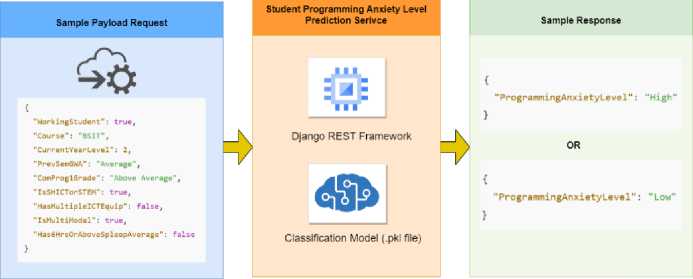
Fig.6. End-to-end flow of student programming anxiety level prediction via web service
Figure 6 presents the integration workflow of a Student Programming Anxiety Level Prediction Service, demonstrating a complete cycle from data input to model inference and response generation. The process begins with the submission of a sample JavaScript Object Notation (JSON) payload containing student-related attributes such as working status, course, academic performance indicators, and behavioral traits. This structured input is processed through a Django REST Framework-based web service, which interfaces with a pre-trained classification model serialized as a .pkl file. The model is loaded using joblib python library, and the input data is converted into a structured data frame then makes a prediction regarding the student’s programming anxiety level, generating an output that classifies the level as either High or Low. This output is returned in JSON format, providing the predicted programming anxiety level. This architecture illustrates the practical application of machine learning models within a web-based academic support system, enabling early detection of students at risk of elevated anxiety in programming contexts and enhancing decision-making processes for timely intervention and academic support.
Figure 7 presents the graphical user interface (GUI) of the developed web-based student information system following the integration of the classification model. The interface demonstrates the system’s ability to generate real-time classification of students’ programming anxiety levels during data entry and record management. When a user inputs new student information or updates existing records, the interface sends a request to the Student Programming Anxiety Level Classification Service via API, including a payload containing structured, relevant student attributes. The service processes the input and returns a predicted anxiety level, classified as either High or Low, which is displayed on the user interface and simultaneously stored in the system’s database. The stored classified data are then used by the dashboard module to generate analytical insights on student anxiety trends, allowing academic staff and administrators to monitor patterns, identify potential concerns, and implement timely, proactive interventions. By combining predictive functionality with visual analytics, the system enhances decision-making and supports the promotion of student well-being and academic success.
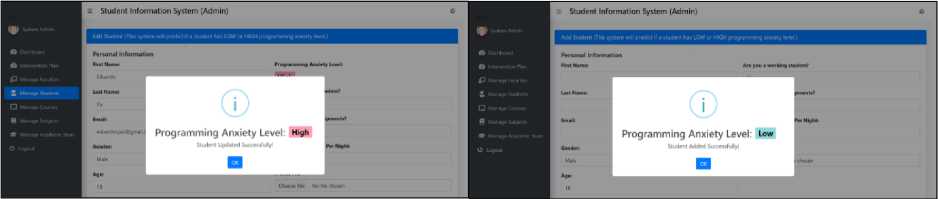
Fig.7. Prediction of programming anxiety level (Low/High) by the web-based system
5. Conclusions
This study demonstrated the potential of machine learning to support educational institutions in addressing programming anxiety, a documented barrier to student success in computing disciplines. By classifying students’ programming anxiety levels based on academic, demographic, and behavioral attributes, the developed Support Vector Machine model provided actionable insights that can help inform timely and targeted interventions. Integrating this model into a web-based student information system offers a practical and scalable tool for educators to proactively identify students who may benefit from support. Beyond its technical results, the study highlights how data-driven approaches can bridge the gap between educational data and responsive teaching practices, finally contributing to more supportive learning environments. The work also underscores the importance of further research on extending these models toward predictive capabilities and broader applicability across diverse educational settings.
6. Recommendations
Based on the findings of this study, several key recommendations are proposed to enhance the effectiveness, scalability, and long-term impact of the developed classification model. First, increasing the size and diversity of the dataset is essential for improving the model’s generalizability and enabling a more comprehensive analysis of the multifaceted factors contributing to programming anxiety. Future studies should prioritize the collection and use of longitudinal data to enable the development of models that can move beyond classifying current anxiety levels toward predicting future programming anxiety risks. This would support genuine early intervention by identifying students who may develop programming anxiety over time. In addition, exploring advanced methodologies such as Automated Machine Learning (AutoML) is recommended to automate model selection and optimization, potentially uncovering complex patterns and enhancing predictive accuracy. The integration of the quality assurance phase outlined in the Cross-Industry Standard Process for Machine Learning (CRISP-ML) framework is also strongly advised to ensure reliability, reproducibility, and robustness across different educational contexts. To strengthen the global relevance of this study and foster international collaboration, future research initiatives are encouraged to include authors or partners from institutions in other countries. Finally, implementing the model across educational institutions and embedding it into existing Learning Management Systems (LMS) would facilitate real-time detection of students currently at risk, enabling timely pedagogical interventions and personalized support. Such integration would promote data-driven decision-making to enhance student engagement, retention, and academic performance in programming courses.
All the Declarations and StatementsAuthor Contributions Statement
Eduardo R. Yu II – Conceptualization, Methodology, Software, Formal Analysis, Investigation, Resources, Project Administration, Writing – Original Draft, Writing – Review and Editing, Visualization, Supervision, and Funding Acquisition: Formulated the primary research objectives, designed the methodological framework, developed the software architecture, and conducted the formal investigation. Furthermore, managed project administration, performed data visualization, provided detailed-level supervision, and curated the original manuscript and subsequent revisions.
Elmerito D. Pineda – Conceptualization, Methodology, Writing – Review and Editing, and Supervision: Contributed to the initial conceptualization and methodological design of the study. Provided critical revisions to the manuscript and assisted in the oversight of the research process.
Isagani M. Tano –– Conceptualization, Validation, Formal Analysis, Writing – Review and Editing, and Visualization: Participated in the conceptual development and validation phases of the research. Contributed to the formal analysis of results, visualization of data, and the iterative review of the manuscript.
Ace C. Lagman – Conceptualization, Validation, and Writing – Review and Editing: Engaged in the conceptualization of the research problem and the validation of findings. Provided editorial contributions during the manuscript review and editing stage.
Jayson M. Victoriano – Conceptualization, Software, Validation, Data Curation, and Writing – Review and Editing: Contributed to the conceptual framework and software implementation. Engaged in data curation, validation protocols, critical review, and editing of the final manuscript.
Jaime P. Pulumbarit – Conceptualization, Validation, Formal Analysis, Writing – Review and Editing, Visualization, and Project Management: Contributed to the foundational conceptualization and validation of the research findings. Provided high-level formal data analysis, visualization, and ensured the scholarly integrity of the manuscript through rigorous review and editing, while overseeing project management milestones.
Jonilo C. Mababa – Conceptualization, Methodology, Software, Validation, Formal Analysis, Writing – Review and Editing, Visualization, and Project Management: Actively engaged in the formulation of the research methodology and software implementation. Additionally, contributed to the validation and formal analysis of experimental data, provided editorial oversight during the manuscript revision phase, and assisted in the coordination of project activities.
All authors have read and agreed to the published version of the manuscript.
Conflict of Interest Statement
The authors declare no conflicts of interest.
Funding Declaration
This study received no grant support. All expenses were covered by the authors.
Data Availability Statement
The data supporting the results of this study are available from the corresponding author upon reasonable request and subject to institutional approval and compliance with the Philippine Data Privacy Act of 2012.
Ethical Declarations
The researchers obtained local approvals to ensure ethical and institutional compliance. Data collection followed the Philippine Data Privacy Act of 2012, with strict measures to protect participant privacy.
Acknowledgments
We sincerely thank all who contributed to the success of this study. We acknowledge the support of participating institutions and individuals in data collection, and the encouragement of our peers, colleagues, and families. Their time, effort, and motivation were invaluable throughout this research.
Declaration of Generative AI in Scholarly Writing
The authors utilized generative AI technologies solely to enhance the language and readability of the manuscript; all substantive content was reviewed and edited under strict human oversight, and the authors remain solely accountable for the integrity of the work.
Abbreviations
None
Appendix
None
