Misconceptions of Primary School Students about Light Phenomena

Author: Alla Belousova, Yulya A. Tushnova, Natalia S. Maslyaeva, Nelly N. Khachaturyan, Elena A. Suroedova
Journal: International Journal of Cognitive Research in Science, Engineering and Education @ijcrsee
Section: Articles
Article in issue: 1 vol.14, 2026.
Free access
Primary school students are often confused when they need to explain light phenomena, and there are several factors that influence this. The purpose of the research was to determine primary school student’s achievement, differences between subpopulations and the level of presence of wrong beliefs (misconceptions) about light phenomena. The sample was composed of 306 students ages 7 to 10 of three primary schools in Sombor, Serbia. The data collection was carried out using knowledge test (Krombach’s alpha coefficient α = .73) developed on previous results on basic light misconceptions such as those about light sources, rectilinear propagation of light, transparency of materials and shadows. Results have demonstrated no significant difference in success among students from different schools, while, statistically significant difference was observed when comparing the results obtained from different age groups. This research elucidated that misconceptions about light phenomena were almost identical and deeply rooted among all primary school students regardless of their age. The obtained results point out to the need for more frequent checking of student knowledge with much more sensitive and valid tests, compiling an inventory of their misconceptions and, accordingly, creating innovative teaching models, which would enable successful overcoming of misconceptions.
Primary science education, concept development, misconceptions, light phenomena
Short address: https://sciup.org/170212427
IDR: 170212427 | UDC: 373.3.093.2:535; 373.3.091.3::53 | DOI: 10.23947/2334-8496-2026-14-1-023-036
Text of the scientific article Misconceptions of Primary School Students about Light Phenomena
The contents of sciences are difficult to learn for a significant number of students. The most common explanations for these difficulties are that scientific terms are abstract, some of them are completely unknown to students, contain a large number of variables, and that terms used in everyday life have a different meaning when used in science ( Smolleck and Hershberger, 2011 ). Moreover, there is a gap between the requirements of scientific disciplines and the cognitive abilities of students ( Milanović Nahod, S., Šaranović Božanović, N., and Šišović, D., 2003 ). When it comes to light, primary school students have a large number of wrong beliefs, not only about its nature, but also about the shadow formation, its size, position and shape, reflection and refraction, rectilinear propagation, etc. ( Phoojaruenchanachai, S., Sumriddetchkajorn, S., and Chanhorm, S., 2009 ; Uzun, S., Nedim Alev, N., and Karal, I.S., 2013 ; Lestari, L.D., Prabowo, P, and Widodo, W., 2018 ; Ravanis 2018 ). Mental ideas about light, regardless of whether the ideas are scientifically correct or not, are the product of both individual development and influence of the environment in which the child grows up ( Castro and Rodriguez, 2014 ). Therefore, these ideas represent the basis for upgrading, i.e. reconstruction of knowledge. In this regard, one of the science teachers’ tasks is to overcome established misconceptions, and the first step towards this achievement is to discover the most common, typical and deeply rooted inaccurate beliefs of students about natural phenomena, including light.
From an early age, children perceive beings and objects from their immediate environment, and as they grow up, they develop the ability to organize stimuli, created by perception, classifying them into different classes or sequences. As the conncept represents a symbolic substitute for an important common

© 2026 by the authors. This article is an open access article distributed under the terms and conditions of the Creative Commons Attribution (CC BY) license .
characteristic of all individual cases, the development of concepts follows the development of the classification system, as well as the children’s ability to apply that system to their own environment. Glynn and Duit (1995) viewed conceptions as learners’ mental models of an object or an event. Concepts that arise from everyday children’s experience Vygotsky named spontaneous, and their adoption is conditioned by the development of speech and language. On the other hand, during the adoption of the system of scientific knowledge in the teaching process, scientific concepts are formed and developed. The essential difference between spontaneous and scientific concepts is the lack, or existence of a system ( Vygotsky, 1986 ). In relation to this claim, later researchers expressed two different viewpoints, that divide them in those who believe that children’s previous knowledge is organized into a system named knowledge - as - theory ( Carey, 1999 ; Chi, 2005 ; Ioannides and Vosniadou, 2002 ; Wellman and Gelman 1992 ), and those who consider that naive knowledge consists of hundreds and thousands of mutually independent fragments, the system named knowledge - as - element ( Clark 2006 ; diSessa, A., Gillespie, N., and Esterly, J., 2004 ; Harrison, A. G., Grayson, D. J., and Treagust, D. F., 1999 ; Linn 2005 ). According to the first point of view, children enter the educational process with unique and ordered systems of naive ideas similar to theories, where changing one such idea requires changing the whole system of hierarchically superior mental models, categories or premises ( Özdemir and Clark, 2007 ). According to the second point of view, naive knowledge consists of many mutually independent parts that represent simple generalizations of events and practical actions ( diSessa, 2006 ) and enable the explanation and prediction of events in the immediate environment in a naive way. However, these events are not explained within a wider theoretical system. The lack of organization and fragmentation implies that naive knowledge is confused, but does not necessarily contradict scientific facts ( diSessa, 1993 ).
The development of concepts in teaching has a central place in the research of Herbert Klausmeier, who states that concepts are the basic drivers of a child’s intellectual development and that they are a key factor in the development of cognitive structures and thinking. He points out that teaching must be individualized and aligned with the students’ developmental level so that they are motivated and willing to learn the concept. Knowing the name of a concept and distinguishing between defining and irrelevant attributes (properties) is essential for mastering a concept. This further facilitates classification of operations, formulating a ground rule for a group, and learning a strategy for extracting (non)examples ( Klausmeier, 1985 ).
All concepts, i.e., everything that exists, can be classified into three primary ontological categories (branches of ontological tree): mental states, entities, and processes. Each of these categories is defined by a certain set of attributes specific only to that category ( Chi, 2008 ). Ontological attributes represent properties that concepts can potentially possess and thus define the meaning of a given concept. Difficulties in learning concepts in class arise when students intuitively assign a concept to the wrong ontological category in relation to the one the scientific concept belongs to ( Chi, M., T., H. Slotta, D., and Leeuw, N., 1994 ). For example, the misconception that “the cold from the ice flows into the water and therefore the water becomes colder” indicates the assumption that the ice possesses some “cold substance”, such as a multitude of small cold molecules that pour into the water and settle. This means that the notions of cold or heat are perceived as belonging to the category of entities rather than processes. Change is possible only if students accept that heat or cold do not have content, color or volume, which are definitive attributes of an entity, but occur over time and thus “move up the process category”. Whether students understand heat as an entity or not, most recognize that heat transfer is a process because they have experienced the obvious movement of “heat” from one place/object to another, for example, from a warm cup to cold hands. Misconceptions in the higher branches of the ontological trees of heterogeneous concepts, such as those that a platypus is a bird because it lays eggs, or that a whale is a fish because it lives in water and has fins, are easier to overcome because they do not have to “move from one category to another”, but everything takes place within the primary category – entity ( Chi, 2013, 60-64 ).
If the spontaneous view of scientific concepts has not disappeared, i.e., it has not been discovered and corrected, it can coexist with what “the teacher said”, used as needed (privately or publicly - answering, testing) thus creating further confusion (Bruce and Kopnicek, 1990). One of the ways of correcting children’s misconceptions is teaching aimed at conceptual change. The term conceptual change is used for learning in which students’ spontaneous conceptual structures are fundamentally restructured to enable understanding of scientific concepts. The reconstruction of existing knowledge in teaching occurs by creating situations in which the student is dissatisfied with existing (spontaneous) concepts. Some researchers indicate that conceptual change is a gradual and evolutionary, not a sudden and revolutionary process (Taylor and Kovalski, 2004). This means that the change must be implemented through different activities, over a longer period of time, and with a continuous check of adoption through the new learning situations and context.
Light is a natural phenomenon that, in addition to wave properties, also has particle properties, which is a general property of matter ( Vučić and Ivanović, 1989, 504 ). In the classroom teaching, light, as a complex scientific concept, is taught approximately as a special type of wave visible to the human eye ( Radojević, 2016, 37 ). The focus in classroom teaching is based on the idea of the necessity of light for the life of humans and other living beings ( Uzun et al. 2013 ), and accordingly, light is described as a form of Sun (stars) energy or energy derived from some other artificial sources ( Sokanović, Lj., Lukić., G., and G. Subakov Simić, G.. 2021, 38 ; Kandić, A., Subakov Simić., G., Vasić., Ž., Petrović., I. and Matejić, I., 2021, 63 ). The contents about light are vertically connected through the first four grades of primary school and gradually become more complex, therefore, it is very important to monitor the development of those concepts, as well as, the presence of wrong beliefs at this age of students.
It has been established that many preschoolers, primary and secondary school students, and even university students interpret light phenomena in a way that is contrary to scientific laws and theories ( Bendall, S., Goldberg, F., and Galili. I., 1993 ; Blizak 2009 ; Uzun et al. 2013 ; Ntalakoura and Ravanis 2014 ; Miščević, G., Blagdanić, S., and Bošnjak Stepanović, M., 2021 ). Through interaction with the environment, children gain experience about natural phenomena, explain them in their own way, and at the same time, oppose accepting new information that is not in accordance with their established patterns of thinking. All these contribute to the formation of children’s misconceptions i.e. false beliefs ( Harlen, 2010 ; DeVellis, 2003 ). Younger school-age students are often confused when they need to connect the scientific concepts they learn in school with events in their everyday experiences. The analysis of students’ misconceptions about light phenomena and optical instruments revealed that daily experiences of students, the language (speech) that is used in and outside the school, teachers who, like students, have wrong beliefs, as well as inadequate textbooks, are the main factors that influence the formation of wrong beliefs ( Widiyatmoko and Shimizu 2018 ). Among all the mentioned factors that influence children’s wrong beliefs, the teachers’ (mis)understanding of correct scientific facts and concepts is certainly the key. This is also confirmed by qualitative study that investigated the conceptual representations of 132 preservice Quebec elementary teachers regarding light phenomena. The conceptual difficulties identified in that study were: (1) a black-colored body absorbs all light rays; (2) light travels rectilinearly and stops when it hits a white paper; (3) a mirror reflects light; it does not absorb it; (4) the glass surface of a mirror reflect light; (5) specular reflection and diffuse reflection are confused; and (6) the shadow varies during the day because the Sun moves around the Earth ( Métioui, 2023 ).
Research conducted with primary school students (8-9 and 11-12 years) indicated the existence of a series of misconceptions by which light is rarely correctly defined as a separate entity ( Castro and Rodriguez, 2014 ; Grigorovitch, 2015 ). Namely, during the interview, the children spoke about the nature of light as something “airy” that fills the entire space and is found all around us, while, on the other hand, they claimed that light is the same as a lamp, a torch, a candle, the Sun, the Moon and the stars. Similarly, students’ belief that light is only found in illuminated areas, such as a light source and an illuminated surface, failed to recognize that light is a form of energy that travels from the source, through the medium (air), to the illuminated place ( Allen, 2010 ). Also, many children do not understand that sunlight is reflected from the surface of the Moon, but instead recognize it as a source of light ( Allen, 2010 ; Uzun et al. 2013 ). One of the most embedded misconceptions about light is about the nature of vision, where the “path” of light rays is very rarely correctly depicted iconically (arrows) from the light source to the object, and then from the object to our eye. Even if a correct graphical representation is present, the explanation of the light propagation method is usually missing ( Allen, 2010 ; Uzun et al. 2013 ; Ravanis, 2018 ).
Bearing in mind the previous findings, researchers and practitioners have implemented various teaching strategies and models (POE: Predict - Observe - Explain; Inquiry; Learning through play), trying to improve the quality and level of students’ knowledge about light phenomena. The results showed that mentioned teaching approaches encouraged students’ thinking activities during the acquisition of content such as the nature of light, the propagation of light, the transparency of materials, the reflection and refraction of light, which contributed to the decrease in numbers of misconceptions about light phenomena (Varela and Costa 2015; Lindstrand, A. E., Hansson, L., Olsson, R., and Ljung-Djärf, A., 2016; Lestari et al. 2018). These studies, however, revealed that complex topics are often addressed in a monodisciplinary manner despite their comprehensive nature. In contrast, a recent study presented a STEAM training proposal for future teachers, and its originality lies in the interdisciplinary approach that supports the numerous relationships and connections between the physical, chemical, biological, psychological and artistic aspects of teaching and learning about the nature of light and color. It was found that the incorporation of art and visual expression through the design and construction of an artistic-scientific object or product had a motivational effect on the learning of light phenomena, which is linked to the sensory aspects of the constructed objects (Serón Torrecilla, F. J., de Echave Sanz, A., Rodríguez Casals, C., Terrado Sieso, E. M., Pozuelo Muñoz, J., and Cascarosa Salil-las, E., 2024).
Materials and Methods
The research results on the light concepts comprehension showed that numerous preconceptions and misconceptions were present in varying degrees at all ages. Since there is an insufficient amount of research in this field, particularly among students of younger school age, this research was conducted as a contribution to the teacher practice aiming for early detection and overcoming of misconceptions about light phenomena that are complex and abstract for children. Identifying misconceptions and conducting deeper analysis can contribute to understanding how children spontaneously form mental images and how their concepts develop. Additionally, this process can highlight the need to adjust teaching methods, materials, textbooks, and curricula in order to better support their development and understanding. The importance of identifying misconceptions of elementary school students (ages 7 to 10) related to the concept of light, lies in the fact that it helps teachers to recognize and address incorrect understandings that students may have about how light works. If students are unaware of these misconceptions, they may encounter difficulties when learning more advanced scientific topics in higher grades. By identifying and clarifying these misunderstandings, teachers can provide clearer explanations and implement teaching strategies that support students in developing more accurate mental models of light. This process is vital, as it enables students to grasp fundamental physical concepts related to light and related phenomena. The aim of this research was to determine the level of misconceptions about light among primary school students, as well as to identify the most common ones.
The focus of this study was on determination and analysis of misconceptions about light among elementary school students in the lower grades. Based on a thorough review of relevant literature and previous research in science education, the authors developed and administered a test aimed at identification of specific students’ misunderstandings regarding fundamental concepts and principles of light. The test was carefully designed to address key aspects of students’ understanding of light and was implemented in three elementary schools.
The research was conducted in accordance with appropriate ethical principles, with all respondents being informed about the research and voluntarily accepting participation with parental consent. A total of 306 students from the 1st to the 4th grade of three primary schools in Sombor and the surrounding area participated in the research: Avram Mrazović (AM), Ivan Goran Kovačić (IGK) and Ivo Lola Ribar (ILR).
The quality and level of the students’ achievements were assessed by a knowledge test on basic concepts about light: light sources, rectilinear propagation of light, transparency of materials and shadows. An overview of concepts, test requirements and cognitive levels of individual tasks is shown in Table 1.
|
Table 1. Overview of concepts and requirements of the tasks in the light knowledge test |
||
|
Number |
Concept |
Request |
|
1. |
Light Source |
Recognize and circle light sources; following illustrations were provided: a table lamp, a mirror, the Sun, an owl, a window, a flashlight, the eyes, a candle, the Moon and a neon light. |
|
2. |
Material Transparency |
Recognize and circle the objects that have been made from opaque materials; following illustrations were provided: a brick wall, seawater, a glass cup, wood logs, a pencil, lenses in eyeglasses, a wooden door, window glass panes, a magnifying glass, a can, transparent document sleeve and a cup of coffee. |
|
3. |
Material Transparency |
Recognize and write which objects are made of transparent, partially transparent and opaque materials; following illustrations were provided: a curtain, trousers, a magnifying glass, a transparent plastic ruler, a metal spoon, sunglasses, a book, a glass of water and a helmet visor. |
|
4. |
Natural and Artificial light Sources |
Natural light sources should be circled with a green crayon, and artificial light sources with a red one; following source’s illustrations were provided: the Sun, TV, a traffic light, the Moon, a fire flame, a candle flame, the stars, a chandelier, a table lamp and a lighter flame. |
|
5. |
Shadow Position |
In the first part of the task, it is necessary to choose a drawing that correctly shows the position of the shadow formed behind the glass illuminated by a flashlight. In the second part of the task, it is necessary to determine the place of the flashlight and mark it with a cross, in order to create the depicted glass shadow. |
|
6. |
Shadow Size |
The illustration shows a flashlight, a cardboard rectangle and a wall. In the first part of it, the flashlight is further from the cardboard, while in the second is closer to it. It is necessary to draw the size of the shadow on the wall in both cases. |
|
7. |
Rectilinear propagation of light |
The five illustrations show light sources: the Sun, a street lamp, a table lamp, a candle and a flashlight. It is necessary to draw lines that show the way light propagates from the source through the air. |
|
8. |
Size and Shape of Shadow |
The three illustrations show the position of the Sun at different times of the day – at 7 am, noon and 5 pm. It is necessary to draw the shadow of the tree in those periods of the day. |
|
9. |
Shape and Position of Shadow |
Four illustrations show the light sources (a table lamp, a light bulb, a flashlight, and the Sun) illuminating objects of the following shapes: rectangle, arrow, circle, and square. It is necessary to draw the shadows of the mentioned objects. |
|
10. |
Size, Shape and Position of Shadow |
The illustration shows a girl next to a tree whose shadow is clearly visible. It is necessary to draw the shadow of the girl, with the Sun on the right side of the drawing. |
The scale for test evaluation, along with the categorization of the students’ achievements, is shown in Table 2. The maximum test score was 50 points, and the students assessment time was one school period (45 minutes).
Table 2. Test Score Scale
|
Points |
Success Percentage (%) and Achievement Categories |
|
0 - 10 |
0 - 20 (1) |
|
10.25 - 20 |
20.5 - 40 (2) |
|
20.25 - 30 |
40.5 - 60 (3) |
|
30.25 - 40 |
60.5 - 80 (4) |
|
40.25 - 50 |
80.5 - 100 (5) |
Krombach’s alpha coefficient (α = .73) is considered a good indicator of internal consistency of the scale (DeVellis, 2003), especially when it comes to the knowledge tests for lower grades of primary school. Based on the recommendation of Segedinac et al. (2011), the validity of the test was assessed by an expert team with relevant qualifications, including two physics teachers, a school pedagogue and two university professors specializing in physics education. The expert team confirmed the validity of the test, noting that students from first to fourth grade were able to easily understand the items, and all tasks were clearly and precisely formulated.
Results
Data collected through the knowledge test were processed utilizing descriptive statistical tools, used for the entire sample as well as subpopulations (grade and school). To determine whether there are any significant differences in number of points achieved on the test between the subpopulations, one-factor analysis of variance (ANOVA) was performed. Additionally, the students’ achievements on individual tasks were analyzed according to the answer categorization (correct, incomplete, and incorrect/ no answer) and grades (I, II, III, IV).
Students’ achievements on the knowledge test including the entire sample and according to the subpopulations
The distribution of students’ achievements by category on the knowledge test for the entire sample is shown in Figure 1 and it was determined that it does not meet the criterion of normality.
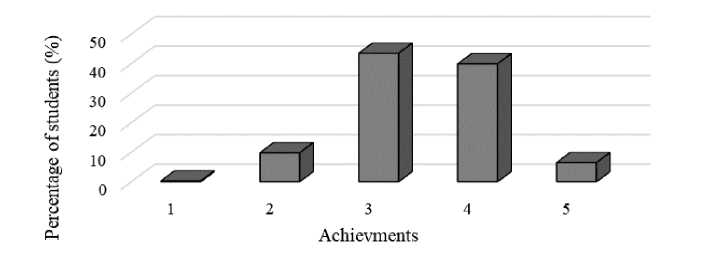
Figure 1. Distribution of students’ achieements on the knowledge test for the entire sample
The average number of points achieved on the test for the entire sample was 29.53 points, ( SE = .42), whereby the Shapiro-Wilk test determined that the condition of normality of the distribution of students’ achievements was not met ( p = .001 < .05). The coefficients of asymmetry ( SKEW = -.37) and kurtosis ( KURT = .29) indicate that the distribution curve is shifted towards the higher values, with the majority of cases within the mean of the distribution. An overview of the test results, represented via the achievements’ intervals, on the entire sample and by subpopulations is shown in Table 3, where f is the number of students whose success on the test is in a given interval, and p is the corresponding percentage share in the total sample or subpopulation.
Table 3. Overview of the test results on the entire sample and by subpopulations
|
Achievements interval |
1 (0–10)pt |
2 (10.25–20)pt |
3 (20.25–30)pt |
4 (30.25–40)pt |
5 (40.25–50)pt |
|
(0-20)% |
(20.5-40)% |
(40.5-60)% |
(60.5-80)% |
(80.5-100)% |
|
Sample |
Subpopulation |
N |
f |
p(%) |
f |
p(%) |
f |
p(%) |
f |
p (%) |
f |
p(%) |
|
Total |
- |
306 |
1 |
0.33 |
30 |
9.80 |
133 |
43.46 |
122 |
39.87 |
20 |
6.54 |
|
I grade |
68 |
1 |
1.47 |
10 |
14.71 |
39 |
57.35 |
18 |
26.47 |
0 |
0 |
|
|
Grade |
II grade |
68 |
0 |
0 |
12 |
17.65 |
31 |
45.59 |
23 |
33.82 |
2 |
2.94 |
|
III grade |
63 |
0 |
0 |
3 |
4.76 |
29 |
46.04 |
28 |
44.44 |
3 |
4.76 |
|
|
IV grade |
106 |
0 |
0 |
5 |
4.72 |
34 |
32.07 |
52 |
49.06 |
15 |
14.15 |
|
|
AM |
80 |
0 |
0 |
5 |
6.25 |
27 |
33.75 |
43 |
53.75 |
5 |
6.25 |
|
|
School |
ILR |
130 |
0 |
0 |
12 |
9.23 |
62 |
47.69 |
48 |
36.92 |
8 |
6.16 |
|
IGK |
95 |
1 |
1.05 |
13 |
13.68 |
44 |
46.32 |
30 |
31.58 |
7 |
7.37 |
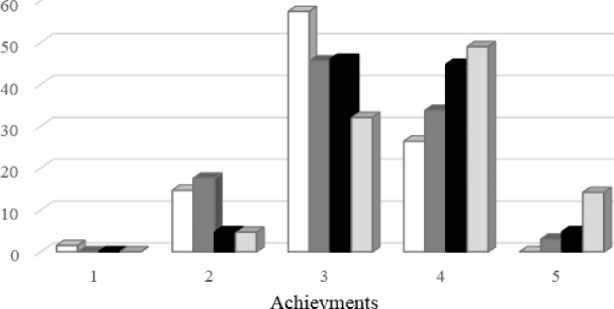
Descriptive data on the accomplished number of points on the knowledge test compared between grades, indicate that students’ achievements in all four grades moved towards the higher values ( SKEW1 = -1.06, S KEW2 = -.04, SKEW3 = -.08, SKEW4 = -.41). However, only in the first grade the majority of cases are around the mean of the distribution ( KURT1 = 1.68, KURT2 = -.52, KURT3 = -.23, KURT4 = -.16). Based on the Shapiro-Wilk test, it was found that achievements on the knowledge test meet the criterion of distribution normality for all grades except the first ( p1 = .001, p2 = .822, p3 = .941, p4 = .109).
The distribution of students’ achievements on the knowledge test by grades and categories is shown in Figure 2. The smallest number of points, the lowest achievement category, were accomplished only by students of the first grade, while in the second category there is a clear difference between younger (I and II grades) and older (III and IV grades) students, with percentage of younger ones being significantly higher. The percentage of students who accomplished achievements within the third category decreases, almost linearly, with the increase in grade. The linear increase in the number of students with the increase in grades is clearly visible in the two highest achievement categories, whereas the percentage of students in the highest category is significantly smaller.
□ I grade
■ II grade
■ Ш grade
□ IV grade
Figure 2. Distribution of students’ achievements on the knowledge test according to the grade
Descriptive data on the number of points achieved on the knowledge test by school show that students’ achievements in all three schools have moved towards higher values ( SKEWAM = -.45, SKEWILR = -.26, SKEWIGK = -.29), while only ILR school has a higher number of cases at the ends of the distribution curve ( KURTAM = .30, KURTILR = -.05, KURTIGK = .26). Achievements on the knowledge test meet the criterion of distribution normality for all three elementary schools ( pAM = .073, pILR = .387, pIGK = .296).
Distribution of students’ achievements by schools and categories is shown in Figure 3. Points in the lowest category of achievements were accomplished only by students in the primary school IGK. Regarding the second category of achievements, it is observed that the smallest number of students is from the primary school AM, while the largest come from IGK.
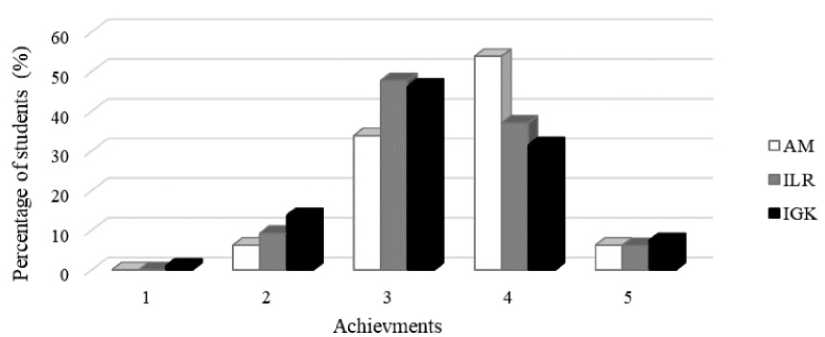
Figure 3. Distribution of students’ achievements on the knowledge test by school
Students from the ILR and IGK schools achieved approximately equal and higher number of points within the third category, in comparison to those from the AM school. The percentage of students who accomplished the achievements within the fourth category is the highest in the AM school, and the lowest in the IGK school, while the highest category of achievements has approximately the same percentage of students in all three schools and is significantly lower compared to the previous two categories.
Differences between subpopulations according to the achievements on the knowledge test
One - factor analysis of variance was used to investigate the influence of grade on the number of points scored on the test. A statistically significant difference was found in the number of points achieved by different subpopulations (grades) ( F (3,302) = 17.233, p = .000). Statistical significance between grades is high, as shown by the value of eta squared (ηp2 = .15), based on the guidelines given by Cohen (Cohen 1988, 284-7). Subsequent comparisons, using Tukey’s HSD test, indicated that the mean score of the first grade ( M = 25.90, SD = 6.97) was significantly different from those of the third ( M = 30.48, SD = 6.15,) and the fourth grade ( M = 32.74, SD = 6.84,) ( p = .001 and p = .000 respectively). Similar trend was observed for the second grade ( M = 27.25, SD = 7.25) indicating significant difference from the third and fourth grade ( p = .037 and p = .000 respectively). It was established that there is no substantial difference between the first and second grade, as well as, between the third and fourth grade. One - factor analysis of variance, used to investigate the influence of the school on the number of points obtained on the test, revealed no statistically significant difference in the number of points achieved in three different schools ( F (2,303) = 1.918, p = .149).
Analysis of students’ answers to individual questions in the knowledge test
Figure 4 displays an overview of students’ answers by categorization (correct, incomplete and incorrect/no answer) and grades (I, II, III and IV) on the knowledge test for the first five questions. It was observed that more than half of the students of all grades answered the first question correctly and that the percentage of correct answers increases with grade. Moreover, it was determined that as many as 56.54% of those who make mistake believe that the Moon is the source of light, which means that they have no knowledge that sunlight is actually reflected from the surface of the Earth’s satellite. Although to a smaller extent, misconceptions were also observed about the window and the mirror as sources of light, as well as the neon light bulb, which some students did not consider as a source of light.
When it comes to the second task, it can be seen that approximately three quarters of the third and fourth grade students correctly categorized the objects based on their transparency, while the first and second grade students were less successful, perhaps due to their unconscious experience with those entities. It was shown that a certain number of students marked a transparent document sleeve (28.75%), water (18%), a magnifying glass (17.3%), a transparent glass (17%), a window (16.3%) and eyeglasses (15.3%) as non - transparent objects. In addition, a number of students marked a can (21.56%), a wooden door (21%) and a cup of coffee (19%) as transparent objects. In the third task, the introduction of the concept of partial transparency obviously led to various doubts among almost all students. Namely, this was supported by many incomplete answers, among which certainly were included some of those with only one or two incorrectly named items. The classification of light sources into natural and artificial within the fourth task, confirmed the previously observed misconception about the Moon as a light source (98%), which contributed to a huge percentage of incomplete answers in all grades (Figure 4).
Furthermore, it was observed that three quarters of students believe that fire is a natural source of light, while a significantly smaller percentage of them wrongly believe that it is also the flame of a candle, a lighter, a lamp and a traffic light. In the fifth task, the percentage of correct answers ranges between 30% and 40% and increases up to the third grade, while the achievements of the fourth grade students were slightly lower. In the first part of the task, the students were able to successfully recognize the illustration with the appropriate position of the shadow (85%), based on the position of the flashlight directed towards the cup. However, in the second part of the task the students have encountered more problems, since the request was reversed, and they had to determine (draw) the position of the flashlight that produces certain shadows of the cups (three cases) when illuminated. Less than half of the students correctly determined the position of the flashlight when the shadow was behind the cup, while they were slightly more successful in examples where the shadow of the cup was on the side or in front of it (60% and 67% respectively).
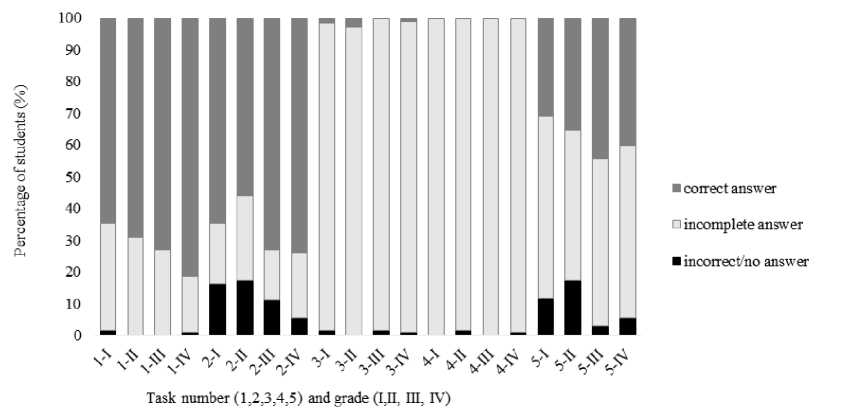
Figure 4. Distribution of students’ achievements by answer categorization for the first five tasks (1-5) on the knowledge test
An overview of students’ answers on the knowledge test for the remaining five questions, shown by categorization and the grades, is given in Figure 5. The sixth task proved to be the most demanding because not a single student solved it completely correctly, and the percentage of incomplete answers ranges between 10% and 50% and it rises with grade. This indicates that the students are not able to relate the distance of the light source to the size of the shadow, and the example with the light source further away from the object was solved correctly by a slightly higher number of students. Within the seventh task, the students supposed to draw the line to represent the rectilinear propagation of light from different sources. This task was done correctly by 70% to 80% of the students, and the proportion of correct answers increases with grade. This result is similar to the first task and could be the result of the teaching influence, given that the contents of light sources and its straight line propagation are sufficiently represented in teaching and learning programs.
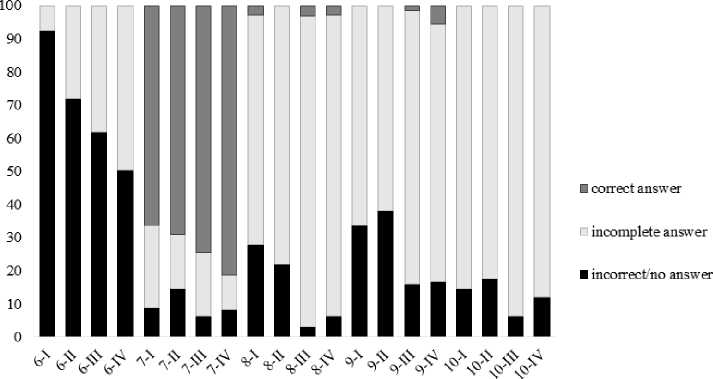
Task number (6,7,8,9,10) and grade (LU. Ш. IV)
Figure 5. Distribution of students’ achievements by answer categorization for the last five tasks (6-10) on the knowledge test
Discussions
The analysis of students’ achievements on the knowledge test about light revealed that there is no statistically significant difference in terms of success among students from different schools, while this difference exists among students of different grade (age), in favor of higher grades. The absence of differences between schools is expected because it can be assumed that the learning conditions in them are similar and that teaching in all schools takes place in accordance with the learning programs. Differences between school grades (in favor of older students), could primarily be explained by the development of their cognitive abilities, but also by the influence of school learning. The obtained results indicate that the majority of respondents consider the Moon as a source of light, confirming the findings of some previous studies (Sahin et al., 2008; Pine et al., 2001), while there were no difficulties in identifying other examples. When it comes to the transparency of materials, it was found that students successfully distinguish between objects made of transparent and opaque materials, while many of them had difficulties recognizing partially transparent objects. Students have demonstrated good results while drawing the lines, tried to illustrate the rectilinear propagation of light from different sources, which is a prerequisite for the correct acquisition of more complex concepts such as the nature of vision and shadow formation (Kokologiannaki and Ravanis, 2013; Grigorovitch, 2014). The largest number of misconceptions among all students, from the first to the fourth grade, was observed when drawing the shadows. Likewise to a number of previous studies (Pine et al., 2001; Herakleioti and Pantidos, 2016; Delserieys et al., 2017), the most common misconceptions were noted when drawing the size and position of the shadow, the connection of the shadow with its object and when sketching the details of the shadow. The results also indicate that it was easier for students to determine the position of the shadow if they have insight into the position of the light source and the object, than vice versa (when they have to determine the place of the light source knowing the position of the shadow). In addition to the shadows’ drawing, the students experienced difficulties with proper correlation of the shadow’s size on the wall and the light source distance from the object, what is in agreement with earlier research (Herakleioti and Pantidos, 2016).
Conclusions
The conducted research showed that the success of students on the knowledge test about light depends on their grade (age), but not on the school they come from. On the whole, the students’ test achievements were satisfactory in all subpopulations. Nevertheless, it was found that, among students from the first to the fourth grade of primary school, the incorrect beliefs about light are present to varying degrees and are almost identical regardless of grade. By looking at the achievements of students on individual tasks, the most dominant misconceptions about light phenomena were identified as: the Moon, a window and a mirror as sources of light; water, a visor, eyeglasses and a curtain as opaque entities; the Moon, a candle flame and fire as natural sources of light; incorrect connection of the shadow’s position with the light source’s position; size wise incorrect drawing of the shadow related to the distance between the light source and the object; inaccurate representation of the position, size, shading, details and connection of the shadow to the object. The obtained results indicate the need for more frequent checking of student knowledge as well as the application of different types of active learning ( Randler and Hulde, 2007 ; Logar and Ferk-Savec, 2011 ; Hsu, C-Y., C-C. Tsai, and J-C. Liang, 2011 ) in classroom teaching. It is known ( Wagaba, F., Treagust, D.,F., Chandrasegaran, A.L., and Won, M., 2016 ) that students often give correct answers on knowledge tests (declarative knowledge), but they are unable to explain why their answers are correct (procedural knowledge). That’s why, regardless of the varied and rich knowledge about children’s understanding of light concepts obtained by the applied test, it would be useful to design and use more precise tests such as two-, three- and four-tier tests ( Kaltakci-Gurel, D.,Eryilmaz, A. and McDer mott, L.C., 2017 ), or even combine different techniques (tests and semi-structured interviews) that would provide insight in students’ metacognitive strategies ( Wagaba et al., 2016 ). A combination of test and interview is more appropriate for the age group that we dealt with in this research, because students at early school age are not capable of explaining their answers precisely and in detail. In addition, all teachers should have the opportunity to participate in a conceptual course in geometrical optic, other topics in physics, as well as to other sciences, in which they are guided in constructing a conceptual model from their own observations ( Kaltakci-Gurel et al., 2017 ). Based on our study, it is recommended to construct an inventory of children’s misconceptions and, accordingly, to create innovative teaching models, what could enable the successful misconceptions’ overcoming.
Conflict of interests
The authors declare no conflict of interest.
Author Contributions
Conceptualization, A.B., Y.T. and N.K. methodology, A.B., Y.T., N.M. and N.K.; formal anal-ysis, Y.T. and E.S.; writing—review and editing, A.B., Y.T., N.K. and E.S. All authors have read and agreed to the published version of the manuscript.
