
Optimizing the allocation of public spending for human development: DEA analysis in the WAEMU zone
Journal: Economics and Business: Theory and Practice @economyandbusiness
Article in issue: 3 (133), 2026.
Free access
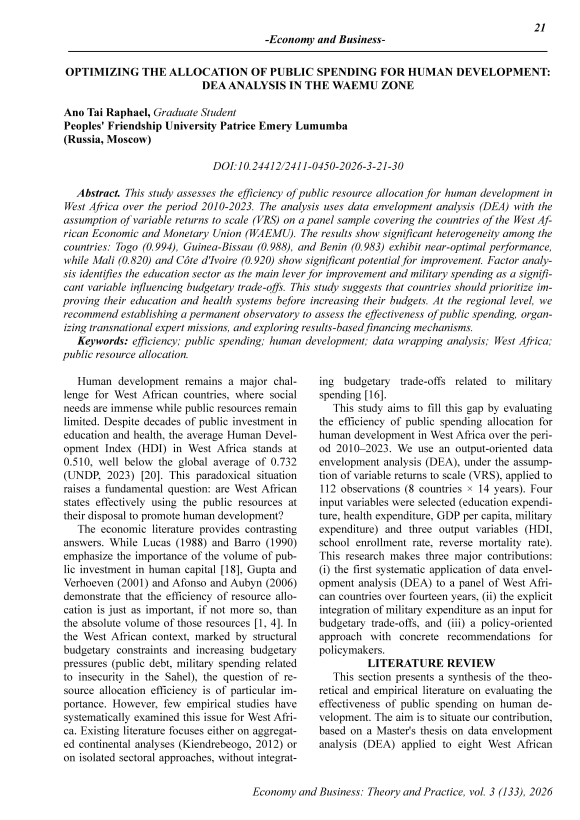
This study assesses the efficiency of public resource allocation for human development in West Africa over the period 2010-2023. The analysis uses data envelopment analysis (DEA) with the assumption of variable returns to scale (VRS) on a panel sample covering the countries of the West African Economic and Monetary Union (WAEMU). The results show significant heterogeneity among the countries: Togo (0.994), Guinea-Bissau (0.988), and Benin (0.983) exhibit near-optimal performance, while Mali (0.820) and Côte d'Ivoire (0.920) show significant potential for improvement. Factor analysis identifies the education sector as the main lever for improvement and military spending as a significant variable influencing budgetary trade-offs. This study suggests that countries should prioritize improving their education and health systems before increasing their budgets. At the regional level, we recommend establishing a permanent observatory to assess the effectiveness of public spending, organizing transnational expert missions, and exploring results-based financing mechanisms.
Similar articles in the section Public sector finance. Government finance in general

Short address: https://sciup.org/170212662
IDS: 170212662 | DOI: 10.24412/2411-0450-2026-3-21-30
Оптимизация распределения государственных расходов на развитие человеческого потенциала: анализ DEA в зоне ЗАЭВС
В данном исследовании оценивается эффективность распределения государственных ресурсов на развитие человеческого потенциала в Западной Африке за период 2010-2023 годов. Для анализа используется метод анализа эффективности с помощью оболочечного анализа эффективности использования ресурсов (DEA) с предположением о переменной отдаче от масштаба (VRS) на панельной выборке, охватывающей страны Западноафриканского экономического и валютного союза (WAEMU). Результаты показывают значительную неоднородность между странами: Того (0,994), Гвинея-Бисау (0,988) и Бенин (0,983) демонстрируют почти оптимальные показатели, в то время как Мали (0,820) и Кот-д'Ивуар (0,920) показывают значительный потенциал для улучшения. Факторный анализ определяет сектор образования как основной рычаг для улучшения, а военные расходы - как значимую переменную, влияющую на бюджетные компромиссы. Данное исследование предполагает, что странам следует уделять приоритетное внимание улучшению своих систем образования и здравоохранения, прежде чем увеличивать свои бюджеты. На региональном уровне мы рекомендуем создать постоянную обсерваторию для оценки эффективности государственных расходов, организовать транснациональные экспертные миссии и изучить механизмы финансирования, ориентированные на результаты.
Text of the scientific article Optimizing the allocation of public spending for human development: DEA analysis in the WAEMU zone
Human development remains a major challenge for West African countries, where social needs are immense while public resources remain limited. Despite decades of public investment in education and health, the average Human Development Index (HDI) in West Africa stands at 0.510, well below the global average of 0.732 (UNDP, 2023) [20]. This paradoxical situation raises a fundamental question: are West African states effectively using the public resources at their disposal to promote human development?
The economic literature provides contrasting answers. While Lucas (1988) and Barro (1990) emphasize the importance of the volume of public investment in human capital [18], Gupta and Verhoeven (2001) and Afonso and Aubyn (2006) demonstrate that the efficiency of resource allocation is just as important, if not more so, than the absolute volume of those resources [1, 4]. In the West African context, marked by structural budgetary constraints and increasing budgetary pressures (public debt, military spending related to insecurity in the Sahel), the question of resource allocation efficiency is of particular importance. However, few empirical studies have systematically examined this issue for West Africa. Existing literature focuses either on aggregated continental analyses (Kiendrebeogo, 2012) or on isolated sectoral approaches, without integrat- ing budgetary trade-offs related to military spending [16].
This study aims to fill this gap by evaluating the efficiency of public spending allocation for human development in West Africa over the period 2010–2023. We use an output-oriented data envelopment analysis (DEA), under the assumption of variable returns to scale (VRS), applied to 112 observations (8 countries × 14 years). Four input variables were selected (education expenditure, health expenditure, GDP per capita, military expenditure) and three output variables (HDI, school enrollment rate, reverse mortality rate). This research makes three major contributions: (i) the first systematic application of data envelopment analysis (DEA) to a panel of West African countries over fourteen years, (ii) the explicit integration of military expenditure as an input for budgetary trade-offs, and (iii) a policy-oriented approach with concrete recommendations for policymakers.
LITERATURE REVIEW
This section presents a synthesis of the theoretical and empirical literature on evaluating the effectiveness of public spending on human development. The aim is to situate our contribution, based on a Master's thesis on data envelopment analysis (DEA) applied to eight West African countries (2010-2023), within the existing academic field.
Theoretical Foundations
The conceptualization of human development is based on Amartya Sen's (1999) capabilities approach, which defines development as the expansion of real freedoms enjoyed by individuals, and not simply as an accumulation of income [22]. This multidimensional vision has been operationalized by the UNDP through the Human Development Index (HDI), which aggregates indicators of health, education, and standard of living [19]. From an economic perspective, endogenous growth theory (Lucas, 1988; Barro, 1990) establishes that public investment in human capital is a driver of long-term growth, while Bloom and Canning (2000) demonstrate the productive impact of healthcare spending through improved labor capacity [5]. The measurement of productive efficiency is based on the work of Farrell (1957) [12], who distinguished between technical efficiency and allocative efficiency and gave rise to two complementary approaches: stochastic frontier analysis (SFA), a parametric approach, and data envelopment analysis (DEA), a nonparametric approach (Coelli et al., 2005 Data Envelopment Analysis (DEA), introduced by Charnes, Cooper, and Rhodes (1978) [3] and generalized to variable returns by Banker, Charnes, and Cooper (1984), has the advantage of not requiring a priori functional specification and of simultaneously managing multiple inputs and outputs, thus justifying its use in our context of structural heterogeneity in West Africa[6].
Empirical Literature
The first applications of DEA to the evaluation of public policies mainly concern OECD countries. Afonso and Aubyn (2006) assess the relative efficiency of health and education systems in 25 developed countries using an output-oriented DEA model Their results indicate that Nordic countries are often efficient, while Mediterranean countries have significant room for improvement, particularly in the allocation of hospital resources. Gupta and Verhoeven (2001) applied a security failure analysis (SFA) to a sample of 37 developing countries, demonstrating that the effectiveness of public spending on education and health is positively correlated with the quality of institutions and negatively correlated with the share of military spending [13]. This pioneering study introduced the notion of a budget trade-off between security and social development, a hypothesis that we explicitly test in our specification. More recently, Herrera and Pang (2014) compared the performance of health systems in 191 countries using a two-stage DEA model [15]. Their results highlight the importance of non-budgetary determinants (governance, infrastructure, initial human capital) in explaining efficiency gaps, thus justifying the value of complementary two-stage analyses to identify levers for improvement.
The literature on sub-Saharan Africa, although less extensive, provides relevant insights. Cordero et al. (2015) assessed the effectiveness of education spending in 45 African countries, revealing marked heterogeneity and superior performance in Southern and Eastern Africa, partly attributable to greater political stability [8]. Kiendrebeogo (2012) applied data envelopment analysis (DEA) to health spending in 40 subSaharan African countries, identifying Senegal, Ghana, and Rwanda as regional benchmarks and estimating an average potential for improvement of approximately 30 percent in the lowest-performing countries. However, few studies focus exclusively on West Africa, and most treat education and health separately, without integrating the trade-off with military spending [16].
The use of DEA to measure the efficiency of income conversion into human progress has recently expanded. Desai et al. (2015) show that several middle-income countries outperform their level of wealth, highlighting the importance of resource allocation. From a dynamic perspective, the Malmquist index, combined with DEA, allows progress to be decomposed into catching up and shifting the capabilities frontier (Malmquist et al., 2018) [9]. Finally, the integration of institutional variables at a later stage (Sahoo and Tone, 2015) [21] enriches the interpretation of scores, although this approach is subject to methodological debate (Simar and Wilson, 2007) [24].
Positioning and Contribution
In light of this literature, our research aims to address three main gaps. First, this study offers the first systematic application of the Data Envelopment Analysis (DEA) Variable Evaluation System (VES), based on outcomes, to a panel of eight West African countries over the period 2010–2023, enabling detailed and up-to-date in-tra-regional comparisons. Second, it explicitly incorporates military spending as a budget trade- off factor, empirically testing the crowding-out effect hypothesis on human development in a context of security fragility. Third, it links DEA analysis to the formulation of concrete recommendations by identifying regional benchmarks and calculating improvement targets, thus responding to the growing demand from policymakers for evidence-based budget allocation tools.
METHODOLOGICAL FRAMEWORK
This study uses data envelopment analysis (DEA) to evaluate the relative effectiveness of public spending allocation to human development in West Africa over the period 2010-2023.
Orientation and Assumptions of Returns to Scale
We adopt an output-oriented DEA model, under the assumption of variable returns to scale (VRS). This methodological choice is based on specific theoretical and contextual considerations. An output orientation is favored because governments seek to maximize human development outcomes for a given level of limited budgetary resources; this orientation therefore measures the capacity to increase outputs without increasing inputs.
The VRS assumption, introduced by Banker, Charnes, and Cooper (1984), is preferred to the assumption of constant returns to scale (CRS) due to the heterogeneity of development levels, population sizes, and institutional capacities among the eight countries in the sample [6]. The VRS assumption introduces a convexity constraint that allows the efficient frontier to more accurately reflect the observed dispersion of the data, thus isolating pure technical inefficiency from size effects.
Data Sources and Processing
The sample comprises eight West African countries, observed annually over the period 2010-2023: Benin, Burkina Faso, Côte d’Ivoire, Guinea-Bissau, Mali, Niger, Senegal, and Togo. Each country-year observation constitutes a decision unit, generating a panel of 112 decision units. The data are from recognized international sources, ensuring comparability and reliability. They are extracted from the World Bank's World Development Indicators, while the Human Development Index, school enrollment rates, and mortality rates are from the UNDP Human Development Reports [20].
Several processing methods were applied to ensure the consistency of the analyses. Missing data, particularly for school enrollment rates in some countries, were imputed using the regional sector median, a robust method for small time series. The mortality rate, an undesirable indicator because a high value indicates lower performance, underwent an inverse transformation according to the following equation: TMORTinV'it = ^^7- X 1000. where TMORTinViи denotes the mortality rate of country i during year t. This transformation respects the assumption of increasing monotonicity of results required by the standard DEA model.
Variable Specification
Input Variables
Four input variables measure the resources mobilized by states to ensure human development. Education expenditure, expressed as a percentage of GDP and denoted хгд ,, measures the budgetary effort devoted to education and is based on Lucas's (1988) human capital theory, which identifies education as the engine of endogenous growth. Health expenditure, expressed as a percentage of GDP and denoted x2 , it ,, measures the budgetary effort devoted to health, in accordance with the work of Bloom and Canning (2000), which demonstrates the impact of health on labor productivity and quality of life.
GDP per capita, expressed in constant dollars and denoted x3it ,, represents the level of available economic resources and constitutes a measure of the budgetary constraint and the capacity for public investment. Finally, military spending as a percentage of GDP, denoted x4it ,, represents the share of the budget allocated to defense and is based on the budget trade-off hypothesis developed by Dunne (2002): resources allocated to security cannot be invested in social sectors, which generates a potential opportunity cost for human development.
Output Variables
Three production variables measure human development outcomes. The Human Development Index (HDI), denoted y1it and ranging from zero to one, is a composite measure integrating health, education, and standard of living. The school enrollment rate, denoted y2it and expressed as a percentage, represents the proportion of the school-age population actually enrolled in school. Finally, the inverse of the mortality rate, denoted y3,it and calculated using the transformation presented earlier, constitutes a relevant production variable after transformation, allowing the integration of the health dimension from a maximization perspective [10].
Mathematical Formulation of the Model Basic Linear Program
For each evaluated decision unit DMU0, characterized by the input vector x0 = (х1О,х2О,х3О, x40)and the output vector y0 = (У 1 О,У 2 О,У3О), the output-oriented linear program VRS is written as follows [2]:
Under constraints:
max 0Xs-/^ + £(^4=1
Si + Sr=1s+)
Z 112
X j Хц + s - = x^, Vi = 1,... ,4 (inputs constraints)
Z 112
X j yr j - S- + = ФУ г О, Vr = 1,... ,3 (output constraints) j=1
Z 112
X j = 1(VRS convexity constraint) j=1
X j > 0, s - > 0,s + > 0,ф > 0,Vj, i, r
The model parameters have precise economic interpretations. The weights λ_j represent the intensity with which each reference unit j contributes to building the efficiency frontier of the unit evaluated at 0. The factor ϕ measures the proportional radial expansion of outputs needed to achieve efficiency: if ф * = 1,25, then outputs can be increased by 25% without consuming more resources.
The input margins s - capture the surplus of usable resources for each input i, while the output margins s + measure the production deficits to be filled for each output r. The non-Archimedean infinitesimal a, usually set to 10-6, ensures that the margins are taken into account in the optimization without dominating the main objective function centered on ф.
The first constraint guarantees that the convex combination of the inputs of the reference unit, augmented by the excess margin, exactly reproduces the observed input of the evaluated unit. The second constraint guarantees that the convex combination of the outputs of the reference unit, minus the margin of error, reaches the observed output of the evaluated unit after radial expansion by a factor of ф. The third constraint, specific to the VRS model, requires that the sum of the weights Xj equals one, thus guaranteeing that the reference boundary is constructed from a convex combination of the observed units.
The technical efficiency score во of the evalu ated unit DMU0 is defined as the inverse of the optimal expansion factor ф*: во = -1. As an ex- ample, a score of θ₀=0.80 means that the evaluated unit could proportionally increase its overall production by 25%, according to the following calculation:
Potential for improvement = (1—1)
x
100% = (010-1) x 100% = 25% \ 0,80 /
without consuming more resources, revealing substantial potential for improving allocative efficiency [22].
INTERPRETATION AND DISCUSSION OF RESULTS
This section presents the results of the output-focused DEA analysis, applied to the eight West African countries over the period 2010 – 2023. Efficiency scores, areas for improvement, and performance indicators are analyzed descriptively and then comparatively.
Efficiency Scores: Descriptive Analysis
Table 1 presents the descriptive statistics of the efficiency scores by country. Across all 112 observations, the mean score is 0.943 with a standard deviation of 0.058, revealing moderate heterogeneity in performance within the sample.
Table 1. Descriptive Statistics of Efficiency Scores by Country (2010 – 2023)
|
DMU (Country) |
Average |
Standard deviation |
Minimum |
Maximum |
Efficient years |
% Efficient |
|
Togo |
0,994 |
0,008 |
0,992 |
1 |
12 |
0,857 |
|
Guinée-Bissau |
0,988 |
0,013 |
0,982 |
1 |
12 |
0,857 |
|
Bénin |
0,983 |
0,017 |
0,975 |
1 |
10 |
0,714 |
|
Niger |
0,968 |
0,024 |
0,965 |
1 |
9 |
0,643 |
|
Sénégal |
0,967 |
0,021 |
0,94 |
1 |
3 |
0,214 |
|
Burkina Faso |
0,92 |
0,032 |
0,892 |
1 |
1 |
0,071 |
|
Côte d'Ivoire |
0,92 |
0,054 |
0,83 |
1 |
3 |
0,214 |
|
Mali |
0,82 |
0,031 |
0,786 |
0,877 |
0 |
0 |
|
Total |
0,943 |
0,058 |
0,786 |
1 |
50 |
0,446 |
Three groups of countries stand out. The first, comprising Togo, Guinea-Bissau, Benin, and Niger, shows average scores above 0.965 and efficiency rates exceeding 64%, demonstrating sustained performance over the period. The second group, including Senegal, Burkina Faso, and
Côte d'Ivoire, presents intermediate average scores (0.920 – 0.967) with more pronounced variability. Finally, Mali is an exception with an average score of 0.820 and no years of efficiency, revealing persistent structural difficulties.
Score matrix by country and year
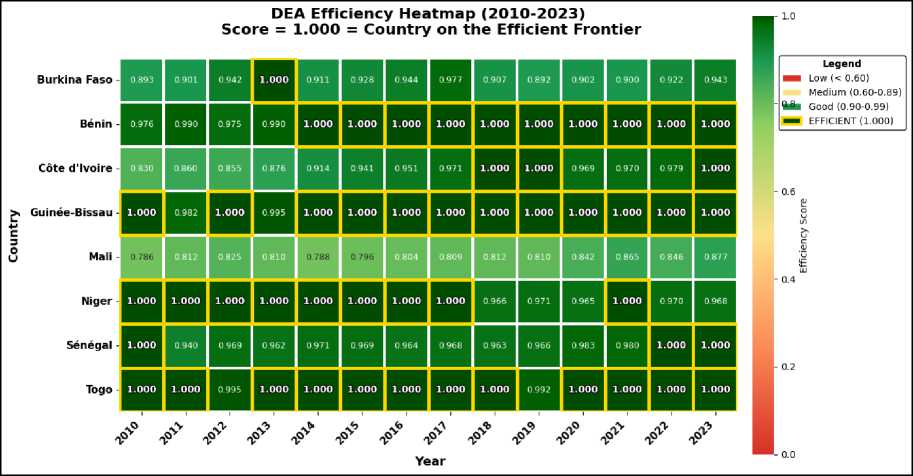
Figure 1 (heat map) below visualizes the spatial and temporal distribution of efficiency scores. Several important observations emerge
Benin, Guinea-Bissau, Niger, and Togo show a predominance of scores equal to 1.000 (dark green cells bordered in yellow), confirming their position as regional leaders. Benin achieved efficiency as early as 2014 and maintained it until 2023. Togo and Guinea-Bissau experienced only two years of inefficiency each during this period. Mali stands out due to the complete absence of efficiency scores, with shades of light green to yellow indicating scores between 0.786 and 0.877, revealing a persistent structural lag. Burkina Faso and Côte d'Ivoire exhibit contrasting trajectories: Burkina Faso only achieved efficiency in 2013, while Côte d'Ivoire made remarkable progress starting in 2018, with three consecutive years of efficiency (2018, 2019, 2023). Senegal and Niger present intermediate profiles, with periods of efficiency alternating with periods of underperformance, suggesting volatility linked to exogenous shocks or budgetary fluctuations.
Analysis of room for maneuver and improvement targets
Several robustness tests validate the stability of the results. The exclusion of military spending does not affect the rankings (ρ = 0.973, p < 0.01), thus confirming that the main results are independent of this specification. Comparisons between the input/output orientations (ρ = 0.886, p < 0.01) and the VRS/CRS returns to scale as- sumptions (ρ = 0.891, p < 0.01) reveal good methodological stability. Overall, these tests converge on a satisfactory robustness of the presented results.
For countries facing inefficiencies, the analysis of room for maneuver quantifies the adjustments needed to reach the efficiency frontier.
On the input side, education expenditure (DE-PEDU) appears to be the main lever for optimization in six of the eight countries, with potential reductions ranging from 2.6% (Togo) to 31.9% (Burkina Faso), suggesting efficiency gains in budget allocation rather than a lack of resources. Military expenditure (DEPMIL) also represents a significant area for adjustment in Togo (-34.0%), Niger (-23.6%), and Burkina Faso (-13.2%), confirming the hypothesis of a trade-off between security and social development.
On the output side, school enrollment rates (TEDU) show the greatest potential for improvement, particularly in Côte d'Ivoire (+55.7%) and Mali (+43.1%), revealing gaps in converting education expenditure into effective access to school. Mortality rates could be reduced by 40.1% in Mali and 39.7% in Côte d'Ivoire, highlighting inefficiencies in health systems. The Human Development Index (HDI), although a composite index, shows substantial
-
2. Economic Interpretation of the Results
This section interprets the results in light of existing literature, examines their theoretical and policy implications, and identifies the limitations of the analysis.
Heterogeneity of Performance and Regional Convergence
The results reveal marked heterogeneity in performance in terms of effectiveness among the eight WAEMU countries, with average scores ranging from 0.820 (Mali) to 0.994 (Togo). This dispersion confirms the findings of Cordero et al. (2015) on the intra-regional variability of educational performance in WAEMU countries, while also making an original contribution through the simultaneous integration of the education, health, and security sectors [8]. The convergence trend observed between 2010 and 2023 (reduction of the standard deviation from 0.077 to 0.040) suggests a catch-up process among the lowest-performing countries, which is consistent with the findings of Malmquist et al [9]. (2018) on the temporal dynamics of human development. This convergence could be explained by several fac- tors: (i) the harmonization of public policies within the framework of ECOWAS and WAEMU, (ii) the transfer of knowledge and best practices between peer countries, and (iii) the adoption of the post-2015 Sustainable Development Goals (SDGs), which created a common frame of reference.
The case of Mali: persistent structural inefficiency
Mali is a textbook case of structural inefficiency, with an average score of 0.820 and no efficient years during the period studied. This result confirms and updates Kiendrebeogo's (2012) findings on the difficulties faced by the Malian health sector [8], while extending them to the entire human development production system The average deficit indicates that Mali would need to increase its output by an average of 31.04% to achieve efficiency, primarily through an improvement in the school enrollment rate (+43.1%) and a reduction in mortality (-40.1%). These considerable margins suggest that the problem lies not in the volume of resources mobilized (education and health expenditures are in line with the regional average), but in their allocation and productive efficiency. Several contextual factors can explain this chronic underperformance: (i) persistent security instability since 2012, which disrupts access to basic social services in the northern regions, (ii) weak institutional capacity for managing public spending, and (iii) geographical and demographic constraints (low population density over a vast territory, which increases the costs of service delivery).
The Excellence of Togo and Guinea-Bissau: Unexpected Results
Contrary to initial expectations, Togo and Guinea-Bissau stand out as the top-performing countries in the sample, with average scores of 0.994 and 0.988, respectively. This result partially contradicts previous studies (Afonso and Aubyn, 2006), which tended to associate efficiency with high-income countries. Togo, in particular, demonstrates that it is possible to achieve efficiency with limited resources (average GDP per capita of USD 650) through optimal allocation of public spending Analysis of fiscal space reveals that the main lever for improvement for Togo lies in reducing military spending (-34.0% in 2019), thus confirming the fiscal trade-off hypothesis formulated by Gupta and Verhoeven
-
(2001) . Guinea-Bissau, despite its small size and structural constraints, exhibits remarkable performance, with only two years of inefficiency (2011 and 2013). This relative success could be explained by favorable economies of scale (a small population facilitating social service coverage) and by a concentration of efforts on targeted priority sectors.
Trade-off between military spending and human development
The analysis of budgetary flexibility highlights the role of military spending as an adjustment variable for several countries. Togo (34.0%), Niger (-23.6%), Burkina Faso (-13.2%), and Benin (-1.8%) all show potential reductions in their military spending, suggesting a crowding-out effect on social spending. This observation is particularly relevant in the West African context, marked by the resurgence of terrorism in the Sahel since 2012. It confirms Dunne's (2002) work on the opportunity cost of security spending, while adding an important nuance: this tradeoff is not systematic [10]. Niger and Burkina Faso, facing significant security challenges, maintain high levels of military spending while retaining respectable efficiency scores (0.968 and 0.920, respectively), suggesting that an effective allocation of social resources can partially offset the crowding-out effect.
The Education Sector: The Main Lever for Improvement
School enrollment rates consistently represent the main indicator of underperformance, with areas for improvement ranging from +0.8% (Togo) to +55.7% (Côte d'Ivoire). This finding aligns with the conclusions of Gupta et al. [14] (2003) regarding the inability of education spending to guarantee effective access to schooling in WAEMU countries. Several factors can explain this underperformance: (i) financial barriers to accessing education despite the theoretical free provision of primary education, (ii) supply constraints (insufficient qualified teachers, inadequate infrastructure), (iii) cultural and socioeconomic factors (child labor, early marriage), and (iv) the poor quality of education, which discourages students from continuing their studies. Côte d'Ivoire presents a particularly worrying case with a school enrollment rate 55.7% lower in 2010, although the situation is gradually improving, with efficiency levels reaching the targets set for 2018, 2019, and 2023. This trajectory demonstrates the effectiveness of the educational reforms implemented over the last decade.
RECOMMENDATIONS
-
1. Country recommendation
-
2. Regional Recommendations
For Mali (average score: 0.820): The absolute priorities are improving the education system (the enrollment rate must increase by 43.1%) and reducing mortality (-40.1%). Structural reforms are needed to: (i) strengthen access to primary education in rural and conflict-affected areas, (ii) improve the quality of primary healthcare, and (iii) optimize the allocation of existing public spending before considering any budget increases. Comparative analyses with Togo (a frequently used benchmark country) should be systematically encouraged.
For Côte d’Ivoire (average score: 0.920): Despite recent progress, the country must consolidate its gains by reducing regional disparities in access to education (a gap of 55.7% in 2010, but improvement since then). Continuing ongoing educational reforms and expanding universal health coverage are priorities. The country could draw inspiration from Benin's model of balanced resource allocation across social sectors.
For Burkina Faso (average score of 0.920): Optimizing education spending (room for maneuver of -31.9%) and a moderate reduction in military spending (-13.2%) should enable it to achieve efficiency. The country must maintain a delicate balance between security imperatives and social investments, drawing inspiration from Niger's effective crisis management practices.
For Niger (average score of 0.968): Efforts should focus on reducing military spending (23.6%) and targeted improvements in school enrollment rates (+12.2%). The country already benefits from good practices that it should consolidate and disseminate at the regional level.
For Senegal (average score of 0.967): Although the potential for improvement is limited, it is significant, particularly with regard to optimizing education spending (-7.2%) and improving the school enrollment rate (+11.7%). The country should aim for systemic efficiency by drawing inspiration from the Togolese model.
For Benin, Guinea-Bissau, and Togo (scores > 0.980): These countries must maintain their performance while sharing their best practices at the regional level through ECOWAS technical cooperation mechanisms. Togo, in particular, should formalize its experience in optimizing military spending to make it a transferable model.
At the WAEMU level, several priority actions are recommended:
Harmonization of Indicators: Standardize data collection systems for education and health to improve the comparability and reliability of future assessments.
Indicative Ceiling for Military Spending: Within the framework of regional budgetary governance, consider an indicative ceiling of 10% of GDP for military spending, with flexibility mechanisms for countries facing a proven security crisis.
CONCLUSION
This study assessed the effectiveness of public spending allocated to human development in West Africa over the period 2010-2023. The results reveal marked heterogeneity in performance: Togo (0.994), Guinea-Bissau (0.988) and Benin (0.983) show near-optimal performance, while Mali (0.820), Côte d'Ivoire (0.920) and Burkina Faso (0.920) show significant room for improvement. A trend toward convergence is observable, with the average regional score decreas- ing from 0.935 to 0.981 between 2010 and 2023. Analysis of the gap curves identifies the education sector as the main lever for improvement (enrollment rates: +55.7% for Côte d'Ivoire, +43.1% for Mali) and military spending as a significant adjustment variable (Togo: -34.0%, Niger: -23.6%). Togo stands out as the benchmark in the sub-region. These results provide policymakers with concrete tools for decision-making. For countries lagging behind in development, the priority is to improve education and health systems before considering any budget increases. For the highest-performing countries, the challenge lies in maintaining this level of performance and sharing best practices within ECOWAS and WAEMU. At the regional level, we recommend establishing a permanent observatory for the effectiveness of public spending, deploying expert missions between countries, and exploring results-based financing mechanisms.
Ultimately, this study demonstrates that the efficiency of public spending allocation is an underestimated lever for human development in West Africa. The identified efficiency gains could significantly improve human development indicators without substantial increases in public budgets, thus offering a promising pathway to achieving the Sustainable Development Goals by 2030.
