
GIS-Based Assessment of the Prospective Value of Geothermal Zones in Vojvodina
Journal: International Journal of Management Trends: Key Concepts and Research @journal-ijmt
Article in issue: 1 vol.5, 2026.
Free access
Geothermal energy is a stable, low-emission renewable resource whose exploitation depends on locating boreholes with suitable temperature at accessible depth and on the economic distance over which the resulting heat can be transported. This paper applies a Geographic Information System (GIS) workflow to an existing dataset of geothermal borehole temperatures in Vojvodina, part of the Serbian sector of the Pannonian Basin, in order to assess the province's prospective value for three categories of end use: general heating, agriculture, and industrial application/electricity generation. Boreholes were classified into three temperature–depth groups corresponding to these categories, buffer zones reflecting economically viable heat-transport distances were generated around each group, and Inverse Distance Weighting (IDW) interpolation was used to produce continuous temperature surfaces between boreholes. The workflow was automated in ModelBuilder and, for the high-temperature group, overlaid with aggregated industrial-zone polygons. The results show that low- and medium-temperature resources are widely and fairly evenly distributed across Vojvodina, while high-temperature resources are concentrated in central Banat. The analysis identifies several discrete areas that meet temperature and distance criteria but contain no existing borehole, representing candidate sites for future exploration, and shows that a number of existing industrial zones already fall within the economic reach of high-temperature boreholes. GIS is concluded to be an effective, reproducible tool for regional geothermal screening. Future work should incorporate geostatistical methods that quantify prediction uncertainty and locally calibrated transport-cost data.
Similar articles in the section Materials testing. Commercial materials. Power stations. Economics of energy






Short address: https://sciup.org/170213195
IDS: 170213195 | UDC: 006.44:[620.91:550.36(497.113) | DOI: 10.58898/ijmt.v5i1.112-128
Text of the scientific article GIS-Based Assessment of the Prospective Value of Geothermal Zones in Vojvodina

© 2026 by the authors. This article is an open access article distributed under the terms and conditions of the Creative Commons Attribution (CC BY) license .
resources are unevenly distributed, being concentrated in areas with anomalously high temperature gradients at depths reachable by conventional drilling.
Depending on the temperature of the resource, geothermal heat can be used in markedly different ways, a relationship classically summarised in the Lindal diagram, which maps the temperature of a geothermal fluid against the range of direct and indirect applications it can support (Lindal, 1973). At comparatively low temperatures it is suitable for the heating of residential and public buildings. At somewhat higher temperatures it becomes suitable for agricultural applications such as greenhouse heating, livestock facilities, and the drying or processing of food. At temperatures above roughly 100 °C it can be used directly in industrial processes and, through dry-steam, flash-steam, or binary (Organic Rankine Cycle) plants, for the generation of electricity. These three broad categories — heating, agriculture, and industry/electricity generation — correspond closely to the low-, medium-, and high-temperature segments of the Lindal diagram, and were adopted in this study as the basis for classifying the available borehole data.
The use of GIS to support geothermal exploration and resource assessment has a history of more than two decades. Burrough (1986) was among the first to set out systematically the principles of applying GIS to the management of land and natural resources, establishing the now-standard conception of GIS as a tool for storing, integrating, analysing, and visualising data drawn from multiple spatially referenced sources. Building on this foundation, Noorollahi et al. (2008) developed one of the earliest comprehensive GIS-based methodologies for geothermal exploration and well siting, combining geological, geochemical, and geophysical evidence layers within a Boolean and Index Overlay decision-making framework applied to part of the Sabalan geothermal field in Iran. Since then, GIS-based multi-criteria decision analysis (MCDA) for geothermal prospectivity mapping has become a well-established line of research, with recent applications extending from northeastern China to Nigeria, where Tende et al. (2025) combined attribute correlation analysis with a weighted-sum model to map prospective geothermal zones at a reported classification accuracy above 80%. A related but distinct strand of research has focused specifically on repurposing existing oil-and-gas wells for geothermal use: Watson et al. (2020), for instance, built a GIS model integrating well location, depth, operational status, and bottom-hole temperature to identify the onshore hydrocarbon fields in the United Kingdom with the greatest potential for geothermal conversion. The present study is methodologically closer to this latter strand: rather than constructing a multi-criteria favourability model from indirect geological evidence, it works directly with an existing set of borehole temperature measurements — many of them originating, as in the UK study, from hydrocarbon exploration — using buffering and deterministic spatial interpolation to translate point data into a continuous, decisionrelevant surface. This choice reflects both the nature of the available data, which consists of direct temperature-at-depth measurements rather than indirect geophysical proxies, and the practical, decisionsupport orientation of the analysis, which aims to inform near-term exploration and investment priorities rather than to build a generalised predictive model.
Vojvodina, the northern province of Serbia, lies in the southeastern part of the Pannonian Basin. The relatively thin crust beneath this part of the basin is associated with an anomalously high terrestrial heat flow, reported between 50 and 130 mW/m² for Vojvodina, against a European average of approximately 55 mW/m² (Janković, 2019), a figure broadly consistent with the regional compilations assembled in the Atlas of Geothermal Resources in Europe (Hurter & Schellschmidt, 2003). Serbia is consequently regarded as one of the geothermally richest countries in Europe, yet this potential remains largely unexploited (Janković, 2019). Numerous boreholes drilled across the province for hydrocarbon exploration and, separately, for hydrothermal purposes, have produced a substantial body of temperature-at-depth data; to date, however, this data has not been systematically translated into a spatial product identifying which parts of the province are best suited to which type of geothermal use.
GIS provides the means to integrate such borehole data with other spatial layers — administrative boundaries, industrial land use, protected areas — representing each as a distinct thematic layer linked by a common geographic reference (Goodchild, 1990; Frank, 1990), and to generate continuous surfaces from discrete point measurements through spatial interpolation. The underlying logic of organising and querying large, heterogeneous datasets to support decision-making is not unique to spatial analysis: it parallels a broader shift toward data-driven and automated decision support documented across other management and technology domains, including the integration of large-scale sensor and data infrastructures discussed by Klipa et al. (2022) in this journal. GIS workflows can, in addition, be automated so that the same sequence of operations can be re-applied as new data become available, or transferred to other regions with comparable geological characteristics — an aspect of practical relevance to organisations responsible for managing exploration portfolios across multiple licence areas.
The purpose of this paper is to apply such a workflow to the existing borehole dataset for Vojvodina in order to:
-
(1) classify boreholes into three groups corresponding to the three categories of end use described above, on the basis of temperature and depth;
-
(2) delineate, for each group, the area within which heat transport from borehole to consumer remains economically viable;
-
(3) interpolate continuous temperature surfaces between boreholes; and
-
(4) identify, through overlay analysis, both gaps in coverage that may warrant new exploratory drilling and areas of overlap between high-temperature zones and existing industrial land use. The remainder of the paper describes the data and methods used (Section 2), presents the resulting spatial patterns (Section 3), discusses their significance and limitations in relation to the wider literature (Section 4), and draws conclusions and recommendations for further work (Section 5).
Materials and methods
Study area
Borehole dataset
The borehole dataset used in this study derives from an unpublished regional study compiling results from existing oil-and-gas and hydrothermal boreholes drilled across the Serbian sector of the Pannonian Basin (Bogićević, 2020). Each borehole record contains an identifier, X and Y coordinates, depth, and temperature, with temperature recorded at successive 50 m depth intervals from the surface to the bottom of the hole; across the full dataset, recorded values range from 10 °C to 220 °C. Within this wider dataset, the subset reaching reservoir temperatures above 120 °C comprises 114 boreholes and 5,147 individually measured horizons, with a combined thermal power of 298 MW; the single largest concentration of this high-temperature potential is found in central Banat, around Vojvoda Stepa and Itebej, where sandstone reservoirs between 2,300 and 2,900 m depth account for approximately 23% of the total high-temperature thermal power identified for the Serbian sector of the basin (Bogićević, 2020). Constructing a geothermal dataset largely from boreholes originally drilled for hydrocarbon exploration mirrors the approach taken in other mature petroleum basins, such as the GIS-based assessment of onshore hydrocarbon wells for geothermal repurposing in the United Kingdom (Watson et al., 2020); in both cases, decades of subsurface temperature logging carried out for petroleum exploration purposes provide, at comparatively low marginal cost, a starting point for evaluating geothermal potential that would otherwise require dedicated exploration boreholes.
Software environment
All spatial processing was carried out in Esri ArcMap (ArcGIS Desktop), using its standard analysis, data management, and spatial-statistics toolboxes, together with the ModelBuilder geoprocessing environment, documented in Esri's own technical resources (Esri, n.d.-b), for workflow automation.
Data preparation and georeferencing
Borehole records, originally stored in tabular (spreadsheet) form, were imported into the GIS as an XY event layer defined by the coordinate fields of each record, and the resulting point layer was then exported to a permanent point feature class (shapefile) to allow further filtering, geoprocessing, and symbolisation. Auxiliary base layers — the administrative boundary of Vojvodina, the national border, and an OpenStreetMap basemap — were added to provide spatial context, with each layer treated as an independent thematic layer combining a geometric (spatial) component and an associated attribute table, following the standard GIS data model (Burrough, 1986; Goodchild, 1990). A number of existing thematic and planning maps used later in the analysis (the regional spatial plan of Vojvodina and a published classification of rural areas) were supplied only as raster images without an embedded coordinate system, and were therefore georeferenced using a minimum of three control points matched to known locations on the vector administrative boundary, with a first-order (affine) polynomial transformation, which is appropriate where the source raster is already a planar, undistorted projection rather than a scanned or curved historical map.
Classification of boreholes by intended use
Three temperature–depth groups were defined, each corresponding to one of the three categories of geothermal use introduced in Section 1 and consistent with the established Lindal classification of geothermal use by temperature (Lindal, 1973), and to the depth interval shared by the largest number of boreholes within the relevant temperature range:
Group 1 — 20–60 °C at a representative depth of 450 m, corresponding to general and residential heating.
Group 2 — 40–70 °C at a representative depth of 750 m, corresponding to agricultural use (greenhouses, livestock facilities, food processing).
Group 3 — 85–140 °C at a representative depth of 1,900 m, corresponding to industrial process heat and, through binary/Organic Rankine Cycle plants, electricity generation.
For each group, the borehole records were filtered on the depth field using the Query Builder tool applied to the attribute table of the imported point layer, and the resulting three subsets were each exported as separate point feature classes for subsequent processing. Restricting each group to a single representative depth, rather than retaining every measured horizon, allowed a single point per borehole to be carried forward into the buffer and interpolation stages described below, avoiding the need to interpolate and combine multiple overlapping horizons per borehole.
Buffer analysis
To express the spatial reach of each borehole's economically usable heat, buffer zones were generated around the boreholes of each group using the Buffer tool. The buffer distances were based on reported limits for the economic transport of heat: steam at 120–250 °C can typically be transported over distances of about 3 to 5 km; hot water at 90–175 °C can be transported economically over distances of up to about 30 km; and lower-grade heat has an economic transport limit of around 15 km, which can be extended somewhat with modest supplementary reheating (Ammar et al., 2012). On this basis, two buffer distances were applied uniformly to each of the three temperature groups — 15 km, representing the more conservative, baseline economic limit, and 30 km, representing the extended limit more applicable to higher-enthalpy resources — producing six buffer layers in total (two per group). These distance thresholds are necessarily generic, having been derived from process-industry data for a different country; their role here is to provide a consistent, literature-based first approximation of economic reach, rather than a site-specific engineering estimate, a point returned to in the Discussion.
Spatial interpolation
Because borehole measurements are necessarily discrete in space, the Inverse Distance Weighting (IDW) method was used to generate a continuous temperature surface between boreholes for each of the three groups. IDW estimates the value at an unsampled location as a weighted average of the surrounding measured values, with each weight inversely proportional to the distance from that location raised to a fixed power; as a result, the method reproduces the exact measured value at every input point and gives nearby boreholes more influence than distant ones. IDW was selected for this stage of the analysis because it is a deterministic method requiring comparatively little parameterisation, and is therefore well suited to a first-pass, exploratory interpolation of a relatively homogeneous dataset such as borehole temperature, where the input values vary continuously in space and there is no a priori reason to expect the directional or anisotropic behaviour for which more elaborate geostatistical methods are designed. A power parameter of 2 and a variable search radius were used for all three groups, and the output cell size was left at the default resolution proposed by the software for the spatial extent of each input dataset.
Comparative studies of spatial interpolation methods applied to other continuously varying environmental variables have shown mixed results: IDW has been found to perform comparably with, or even better than, ordinary kriging in some station-wise validations of climatic variables, but to be outperformed by kriging and other geostatistical methods where the variable in question exhibits strong spatial autocorrelation, as is often the case with rainfall (Caloiero et al., 2021). The principal limitations of IDW relevant to the present study — the absence of any associated estimate of interpolation error, and a tendency to produce concentric “bullseye” patterns around isolated input points — are addressed further in the Discussion.
Workflow automation
The full sequence of operations described above — importing borehole coordinates as an XY event layer, filtering by depth into the three groups, buffering each group at two distances, clipping the buffers to the province boundary, and interpolating each group with IDW — was assembled into a single reusable geoprocessing model using ModelBuilder (Esri, n.d.-b). Each step was first validated individually before the complete model was executed, and intermediate outputs (such as each buffer layer) were inspected before being passed on as input to the next operation. Automating the workflow in this way means that the same model can be re-applied to an updated borehole dataset, or adapted to another region of the Pannonian Basin, by substituting only the input feature classes and the buffer/clip parameters, without rebuilding the analysis from scratch. This emphasis on a reusable, shareable analytical workflow echoes a broader theme in GIS research on building spatial data infrastructures that allow analytical products to be exchanged and re-applied beyond the context in which they were first developed (Farha, 1999).
Overlay with industrial land use
For Group 3, intended primarily for industrial application, the buffer and IDW layers were further overlaid with a layer of industrial-zone polygons for Vojvodina. To reduce a large number of small, scattered industrial parcels to a more analytically meaningful set of areas, the industrial-zone layer was first generalised using the Aggregate Polygons tool (Esri, n.d.-a), with an aggregation distance of 4 km, reflecting the approximate diameter of industrial zones around the larger settlements of the province. The resulting aggregated industrial zones were then intersected with the 15 km and 30 km buffers and with the IDW surface for Group 3, in order to assess the extent to which existing industrial areas already lie within the economically viable distance of a high-temperature borehole.
Results
Spatial distribution of borehole data
Figure 1 shows boreholes concentrated predominantly in the northern and central parts of Vojvodina, particularly in the Banat area near the borders with Romania and Hungary, with a markedly sparser distribution toward the south and southwest of the province, near the borders with Croatia and Bosnia and Herzegovina. This uneven coverage largely reflects the historical pattern of hydrocarbon exploration drilling in the Serbian sector of the Pannonian Basin, on which the present dataset is built (Bogićević, 2020), rather than any intrinsic absence of geothermal potential in the less-drilled areas.
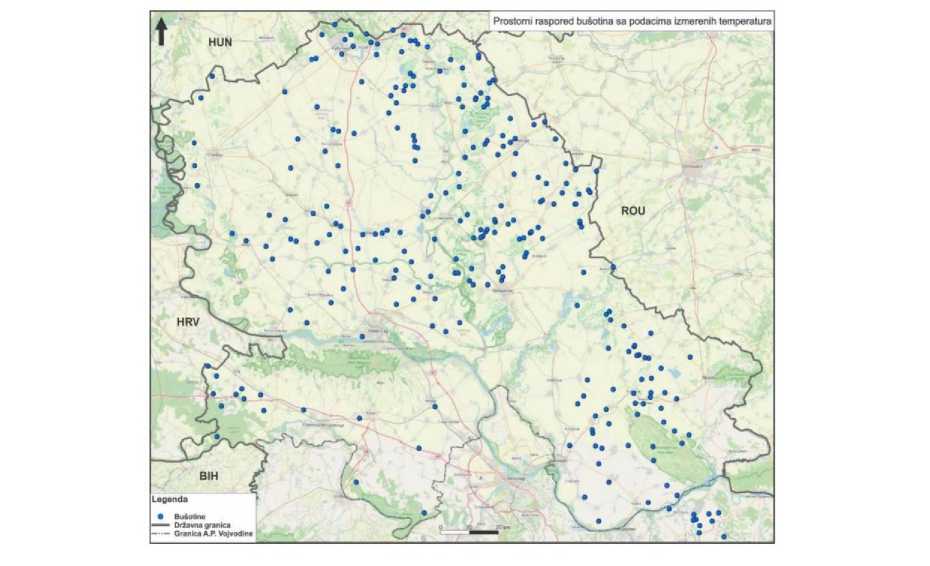
Figure 1. Spatial distribution of boreholes with measured temperatures ranging from 10 °C to 220 °C across Vojvodina.
Borehole groups by use category
Filtering the dataset into the three temperature–depth groups produced markedly different spatial patterns. Group 1 (20–60 °C at 450 m) included the largest and most evenly distributed set of boreholes, covering most of the province with the exception of its southern margins. Group 2 (40–70 °C at 750 m) showed a broadly similar but somewhat more clustered distribution, again concentrated in the north and east, with a secondary cluster in the southeast near the border. Group 3 (85–140 °C at 1,900 m) was considerably more localised, with the great majority of boreholes concentrated in a relatively compact area of central Banat, consistent with the finding that this area alone accounts for around 23% of the high-temperature thermal power identified for the whole of the Serbian sector of the Pannonian Basin. Table 1 summarises the three groups.
Table 1 Classification of boreholes into three temperature–depth groups according to intended geothermal use
|
Group |
Temperature range (°C) |
Representative depth (m) |
Intended use |
Buffer distances applied |
|
1 |
20–60 |
450 |
General / residential heating |
15 km, 30 km |
|
2 |
40–70 |
750 |
Agriculture |
15 km, 30 km |
|
3 |
85–140 |
1,900 |
Industry / electricity generation (ORC) |
15 km, 30 km |
Buffer zones
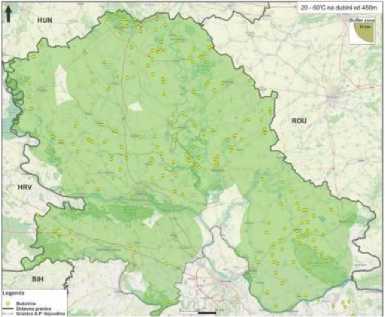
(a) Group 1 — 20–60 °C, 450 m
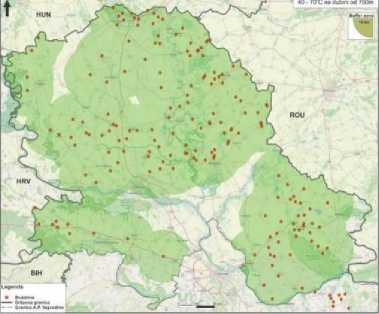
(b) Group 2 — 40–70 °C, 750 m
(c) Group 3 — 85–140 °C, 1900 m
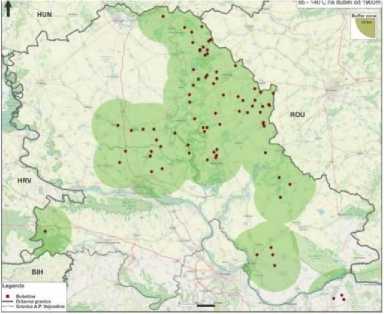
Figure 2. Buffer zones of 15 km around boreholes of (a) Group 1, (b) Group 2, and (c) Group 3.
(a) Group 1 — 20–60 °C, 450 m
(b) Group 2 — 40–70 °C, 750 m
(c) Group 3 — 85–140 °C, 1900 m
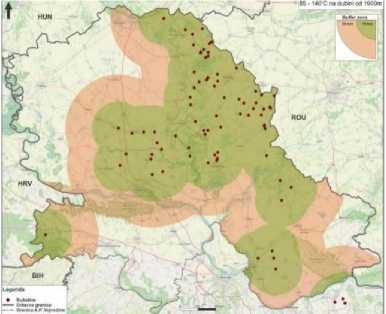
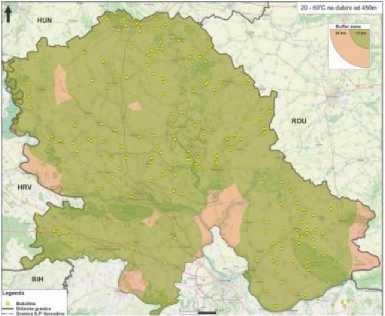
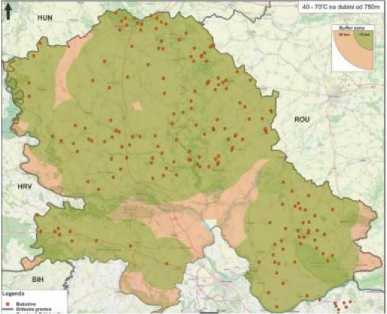
Figure 3. Buffer zones of 30 km around boreholes of (a) Group 1, (b) Group 2, and (c) Group 3.
Applying the 15 km buffer to each group (Figure 2) produced near-continuous coverage of the central and northern parts of the province for Groups 1 and 2, owing to the density and even spacing of boreholes in those temperature ranges. For Group 3, the 15 km buffer remained discontinuous, leaving substantial areas of the province — including most of its western and southern portions — outside the buffer of any high-temperature borehole. Extending the buffer to 30 km (Figure 3) closed most of these gaps for Group 3 and extended coverage for all three groups toward the province's borders, but also showed that, even 120
under this less conservative assumption, several discrete areas in the west and south of Vojvodina remain beyond the economic reach of any existing high-temperature borehole.
Interpolated temperature surfaces
(a) Group 1 — 20–60 °C, 450 m
(b) Group 2 — 40–70 °C, 750 m
(c) Group 3 — 85–140 °C, 1900 m
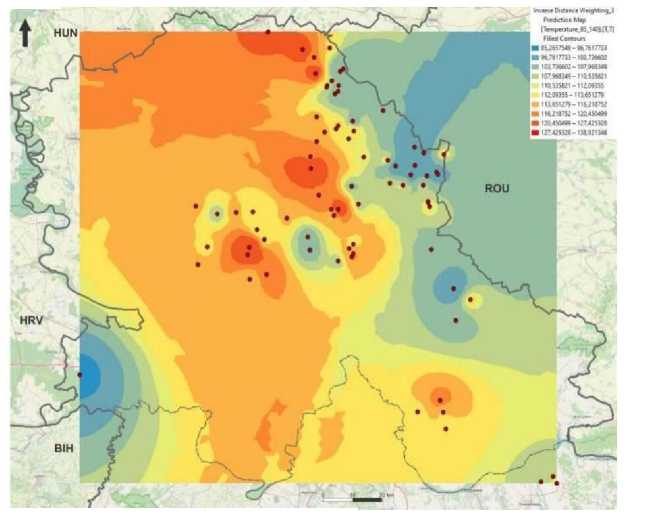
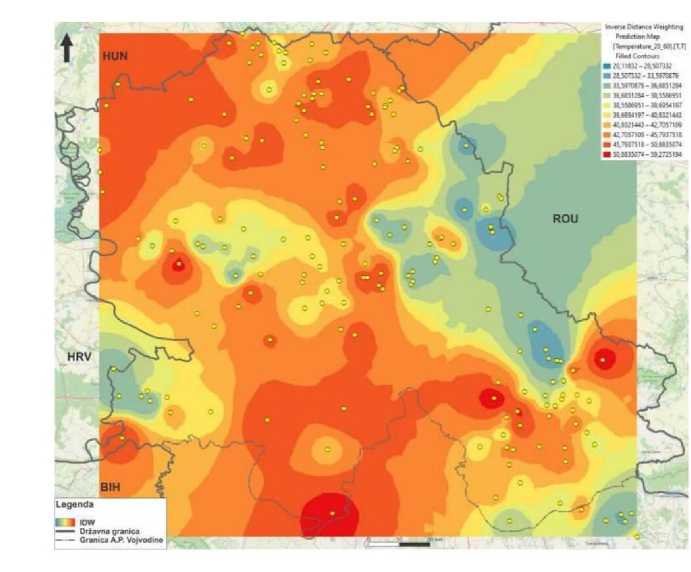
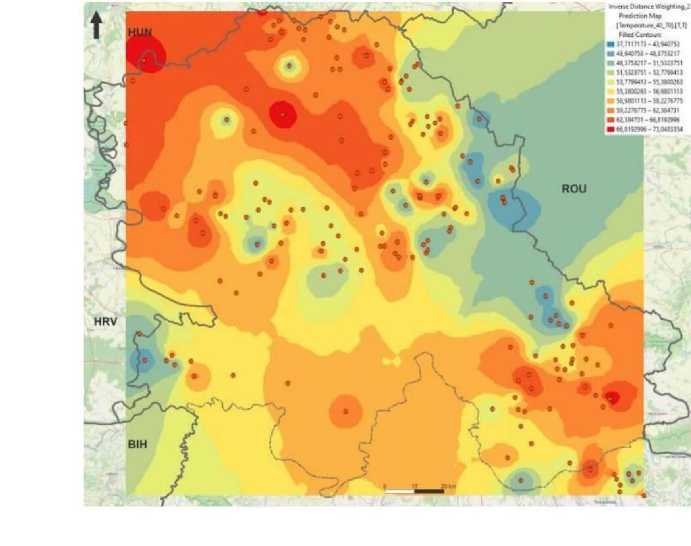
Figure 4. IDW-interpolated temperature surfaces for (a) Group 1, (b) Group 2, and (c) Group 3.
The IDW-interpolated surfaces (Figure 4) provide a continuous representation of expected temperature between boreholes for each group. For Group 1, the interpolated surface shows a generally moderate temperature field across the province with several localised maxima, the most pronounced occurring in the south of the study area. For Group 2, the surface shows higher values concentrated in the northwest, near the Hungarian border, and in isolated patches further south and east. For Group 3, the surface is dominated by a broad zone of elevated temperature across the central part of the province, corresponding to the cluster of high-temperature boreholes identified above, with values declining toward the margins of the dataset.
Prospective “gap” zones
Combining the buffer layers of all three groups through an overlay/clip operation, and intersecting the result with the boundary of Vojvodina, produced a composite zone representing the area within which at least one of the three temperature categories is, in principle, economically accessible (Figure 5). Several discrete polygons within this composite zone were found to fall outside the immediate vicinity (15 km) of any existing borehole while still meeting the wider (30 km) distance criterion and lying within the interpolated temperature range of at least one group. These areas, located mainly toward the western and southern margins of the province, represent candidate locations for new exploratory boreholes, since they combine favourable temperature conditions with an absence of infrastructure that has already been tested.
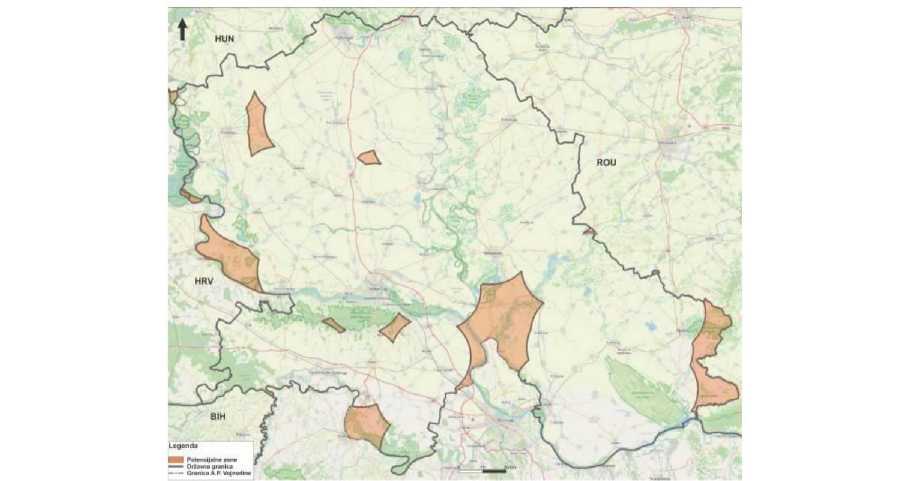
Figure 5. Composite overlay of all buffer zones, clipped to the boundary of Vojvodina, showing prospective gap zones without existing boreholes.
Overlap with industrial zones
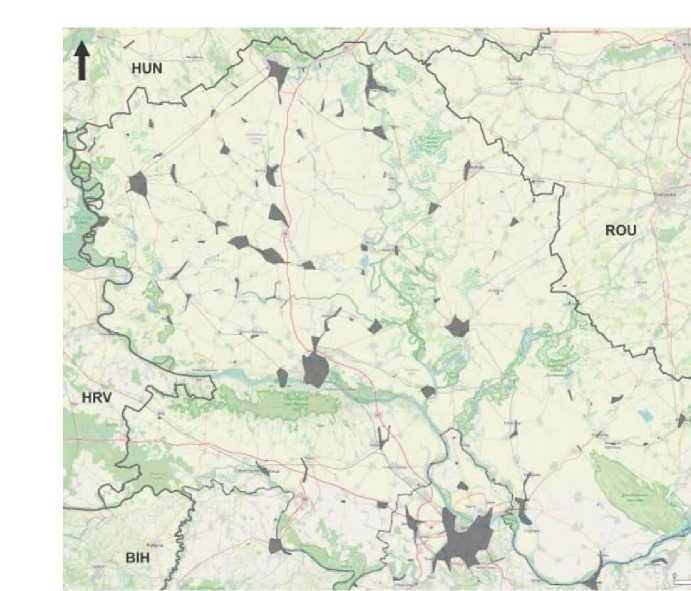
Figure 6. Aggregated industrial-zone polygons (4 km aggregation distance) across Vojvodina.
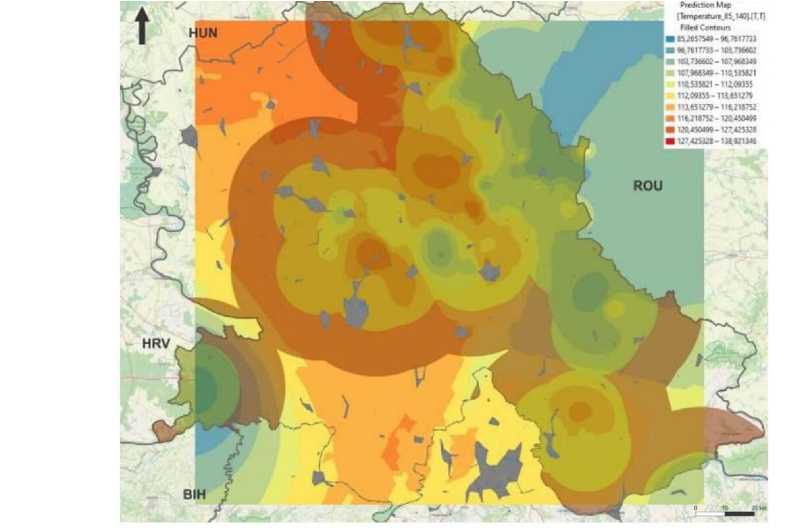
Figure 7. Overlay of aggregated industrial zones with the 15 km and 30 km buffers and the IDW surface for Group 3.
Aggregating the industrial-zone polygons at a 4 km distance produced a set of consolidated industrial areas distributed across the province's larger settlements (Figure 6). Overlaying these aggregated zones with the 15 km and 30 km buffers and the IDW surface for Group 3 (Figure 7) showed that a substantial number of industrial zones, particularly those in the central part of the province, already fall within the 30 km buffer of at least one high-temperature borehole, and several fall within the more conservative 15 km buffer. This overlap indicates that, alongside new exploration, there may be scope to investigate the feasibility of supplying specific existing industrial users directly from already-drilled high-temperature boreholes.
Discussions
The identification of discrete gap zones — areas that satisfy temperature and distance criteria but contain no existing borehole — is, from a practical standpoint, the most directly actionable result of this analysis. Because these zones were derived purely from the spatial relationship between existing data points, administrative boundaries, and an externally sourced economic-distance threshold, they should be read as a first-order screening result rather than a guarantee of geothermal potential: confirming the suitability of any specific gap zone for drilling would require additional geological, hydrogeological, and geophysical investigation that lies outside the scope of a purely spatial analysis.
This deliberately simple, data-driven approach can usefully be set against the more elaborate multicriteria decision analysis (MCDA) methodologies that dominate the published GIS-geothermal literature. Noorollahi et al. (2008) and, more recently, Tende et al. (2025) combine several independent geological, geochemical, and geophysical evidence layers — faults, lithology, gravity and magnetic anomalies, known thermal manifestations — into a single favourability index, typically validated against known occurrences using statistical measures such as the receiver operating characteristic/area under curve (ROC/AUC); Tende et al. (2025), for example, reported a classification accuracy above 80% for their weighted-sum model in the Benue Trough of Nigeria. The present analysis does not attempt to construct or validate a comparable favourability index, both because the additional evidence layers it would require (fault maps, gravity and magnetic data, and the like) were not available for this study, and because the borehole dataset already provides a direct, rather than a proxy, measurement of the variable of interest. The tradeoff is that the gap zones identified here carry no formal accuracy or probability estimate of the kind that an MCDA or statistical model would provide. A natural extension of the present work would therefore be to treat the buffer- and IDW-based screening presented here as a first filter, and to subject the resulting gap zones to a more detailed MCDA-style evaluation — along the lines of Noorollahi et al. (2008), Tende et al. (2025), or the well-based repurposing assessment of Watson et al. (2020) — once the relevant geological and geophysical layers become available.
The same caveat about formal validation applies, with even greater force, to the IDW-interpolated surfaces themselves. IDW is, by design, an exact interpolator that reproduces the value at each input point and provides no measure of the uncertainty associated with its predictions between points; it is also prone to producing artificial concentric patterns around isolated boreholes, visible in places in the surfaces presented here, most clearly toward the edges of the dataset where boreholes are sparse. Comparative studies of spatial interpolation methods applied to other continuously varying environmental variables have reached mixed conclusions on this point: some have found IDW broadly comparable to, or even more accurate than, ordinary kriging in station-wise validation, while others, particularly for variables with strong spatial autocorrelation such as rainfall, have found geostatistical methods to outperform IDW in formal cross-validation (Caloiero et al., 2021). The interpolated surfaces presented here are therefore best used as an exploratory, visual aid to identify broad trends and candidate areas, rather than as a quantitatively precise predictive tool. A geostatistical method capable of producing an associated error surface, such as kriging, together with a formal cross-validation against withheld borehole measurements, would be a natural next step where greater confidence in the interpolated values is required, and would also allow the density and placement of any future boreholes to be optimised with respect to the resulting reduction in prediction uncertainty.
The buffer distances used in this study were derived from a single literature source concerned primarily with industrial heat recovery in the United Kingdom (Ammar et al., 2012), and were applied uniformly across Vojvodina without adjustment for local terrain, existing pipeline infrastructure, or local energy prices. Locally calibrated cost data, where available, would allow the buffer distances — and consequently the extent of the identified gap zones — to be refined considerably, and would also make it 125
possible to differentiate buffer distances within a single temperature group according to local conditions rather than applying a single national value uniformly.
Finally, the overlap identified between high-temperature buffer zones and existing industrial land use suggests a second, complementary direction for future work: rather than focusing exclusively on new exploration, it may be worthwhile to assess in more detail the technical feasibility of connecting specific, already-identified industrial users to high-temperature boreholes that already lie within their economic reach. Combined with the reproducibility offered by the ModelBuilder automation used in this study, such an assessment could be extended relatively easily to other parts of the Pannonian Basin, or repeated as new borehole data become available. More broadly, the workflow presented here is an example of using a relatively modest, well-documented spatial dataset to generate a decision-relevant product — an application of automated, data-driven analysis to a resource-management problem that mirrors, on a smaller and more domain-specific scale, the kind of large-scale data integration and automated decision support discussed elsewhere in this journal in the context of Big Data and artificial intelligence (Klipa et al., 2022). For an organisation managing a portfolio of exploration assets, a reproducible screening tool of this kind can support the prioritisation of investment between candidate areas well before the stage at which a full, MCDA-based feasibility study would be commissioned.
Conclusions
This study applied a GIS-based workflow — combining borehole classification, buffer analysis, IDW spatial interpolation, and automated geoprocessing — to assess the prospective value of geothermal zones in Vojvodina across three categories of end use: general heating, agriculture, and industrial application/electricity generation. The analysis confirmed that the lower-temperature resources suitable for heating and agriculture are widely distributed across the province, while the high-temperature resources suitable for industrial use and electricity generation are concentrated in a relatively small area of central Banat. By overlaying buffer zones derived from economically viable heat-transport distances with the spatial distribution of existing boreholes, the analysis identified several discrete areas that meet temperature and distance criteria but have not yet been drilled, representing candidate locations for future exploration. A further overlay with industrial land use indicated that a number of existing industrial zones already lie within the economic reach of high-temperature boreholes, pointing to a complementary opportunity for the direct industrial application of an already-identified resource.
These results support the conclusion that GIS is an effective and reproducible tool for the regional-scale assessment of geothermal resource potential, capable of integrating heterogeneous spatial datasets — borehole measurements, administrative boundaries, and land use — into a single, decisionrelevant product. The automation of the workflow through ModelBuilder further means that the same analysis can be updated as new borehole data become available, or transferred to other parts of the Pannonian Basin with comparable geothermal characteristics.
At the same time, the results should be interpreted as a first-order, exploratory screening rather than a substitute for detailed geological and economic feasibility studies. Future work should prioritise the use of geostatistical interpolation methods capable of quantifying prediction uncertainty, the incorporation of locally calibrated transport-cost data in place of the generic distance thresholds used here, and the addition of further spatial layers — such as existing pipeline infrastructure, protected natural areas, and detailed land-use classifications — to refine the identification and ranking of prospective zones for both new exploration and direct industrial application. Combining the present, data-driven screening with the more elaborate multi-criteria decision analysis methods established in the wider GIS-geothermal literature (Noorollahi et al., 2008; Tende et al., 2025) would offer a practical, staged route from a low-cost initial assessment to a fully validated feasibility study, of the kind already adopted for the repurposing of hydrocarbon wells elsewhere in Europe (Watson et al., 2020).
Conflict of interests
The author declares no conflict of interest.
